Electronic copy available at: http://ssrn.com/abstract=2526512
A STRUCTURAL EQUATION MODELING-BASED EXAMINATION OF THE PRIVATE LABEL BRAND (PLB) CONSUMER EVALUATION PROCESS
James Mark Mayer, Indiana University, USA, [email protected] ABSTRACT
The goal of this paper is to answer the question “What variables influence consumer private label brand (PLB) evaluations?” We employ structural equation modeling (SEM) in order to analyze a hypothesized process by which consumer-based evaluations of retailer and product category, along with perceived risk of the category and PLB all affect the ultimate PLB brand evaluation. PLBs have been heavily researched in academic marketing research journals but SEM-based research is minimal. Research has generally been conducted using model-building techniques which are then empirically tested using real-world data. Given the complexity of the process, an alternate approach is to use experimental techniques to gain first-hand PLB data and then analyze it using appropriate methodology. The current project represents a step in that direction. While the model is subject to limitations that call its utility into question, it does provide guidance for a future, more theoretically-sound a priori model and resulting SEM analysis.
Keywords: Private Label, SEM, Retail Brands, Perceived Risk INTRODUCTION
The goal of this paper is to answer the question “What variables influence consumer private label brand (PLB) evaluations?” I employ structural equation modeling (SEM) in order to analyze a hypothesized process by which consumer-based evaluations of retailer and product category, along with perceived risk of the category and PLB all affect the ultimate PLB brand evaluation. PLBs have been heavily researched in academic marketing research journals (and a robust literature review is conducted below), but SEM-based research is minimal. Research has generally been conducted using model-building techniques which are then empirically tested using real-world data (e.g., scanner data from a retailer category in one specific category). Given the complexity of the process, an alternate approach is to use experimental techniques to gain first-hand (i.e., from the consumer) PLB data and then analyze it using appropriate methodology. The current project represents a step in that direction, as I use extant theory to conceptualize and operationalize a process by which PLB evaluations are developed by consumers and test the theoretical model using structural equation modeling. While the model is subject to theoretical, conceptual, and executional limitations that call its utility into question, it does provide guidance (and perhaps some evidence of the merit) of a future, more theoretically-sound a priori model and resulting SEM analysis.
LITERATURE REVIEW
PLBs are a heavily researched area in the marketing literature. Guided by the overall goal of this paper (explaining the PLB evaluation process) this literature review will focus on the following four areas:
1. Providing an overall picture of the private label brand phenomenon 2. Answering the question “Who buys PLBs?”
3. Answering the question “Why do consumers buy PLBs?”
_________________________________________________________________________________ This is the author's manuscript of the article published in final edited form as:
Mayer, J. M. (2016). A Structural Equation Modeling-Based Examination of the Private Label Brand (PLB)
Consumer Evaluation Process. In Let’s Get Engaged! Crossing the Threshold of Marketing’s Engagement Era (pp. 767-780). Springer International Publishing. http://dx.doi.org/10.1007/978-3-319-11815-4_225
Electronic copy available at: http://ssrn.com/abstract=2526512 4. Examining the role of the retailer in driving consumer PLB acceptance The Private Label Brand Phenomenon
Private Label Brands (PLBs)—often referred to as “store brands,” “house brands,” and “own brands”— are defined as brands owned, controlled, and sold exclusively by a retailer (Raju et. al 1995). Regardless of whether one is speaking from a consumer, retailer, or competitor (e.g., national manufacturers’ branded products) point-of-view, PLBs are a key dynamic in today’s consumer packaged goods (CPG) environment. PLBs were first introduced over 100 years ago in a few categories, including tea (Raju et. al 1995). However, store brand sales were negligible through the 1950s (Soberman and Parker 2006) as retailers competed largely through branded national products. In addition to a minor focus on PLBs, many retailers sold “generics”--e.g., a plain white box with “Corn Flakes” in bold black font, containing little text beyond the brand name and required nutritional labeling (Murphy and Laczniak 1979)--by definition didn’t feature a brand name, and were a clear trade-off on price, image, and perceived quality (Soberman and Parker 2006). Generics were generally seen by consumers as inferior in quality both to brands and to private labels (Rosen 1984), and were, by nature, largely undifferentiated from one retailer to another. As retail consolidation became rampant, and one of the effects was as retailer evolved into larger chains, retailers increasingly dropped the generic products in favor of more focus on PLBs. Likewise, smaller national brands were cut, and consumers were left with the choice between a limited number of national brands and one, perhaps two, PLBs (Soberman and Parker 2006).
Retailers became increasingly focused on their “own brands.” For the first time, retailers were selling brands that were exclusively available in their stores (Hansen et al. 2006). Stepping back to view the entire store, retailers started to realize that no manufacturer could compete with a store-wide private label brand in terms of coverage (Hoch 1996). As retailers started to increasingly apply brand management techniques—for instance, positioning PLBs beyond price—PLBs became more attractive to consumers and more important to retailers, until we reach the point where we are today, with PLBs being a cornerstone of nearly every major retailer’s core strategy. Hansen et. al summarize this by stating that today “one of the most important activities for supermarket retailers is the creation and maintenance of their private label brands” (2006), and this assertion is supported by the 2000 Annual Report of Progressive Grocer where the #1 action rated as most likely for retailers was “Stress Private Label.” (Dowdell 2006). The result of this focus is that average dollar market share of PLBs increased from just over 15% in 1988 to 20% in 1998 (Ailawadi and Harlam 2004) and PLBs are the No. 1 seller in 240-plus grocery categories, roughly a quarter of total categories sold.
There is not a lot of mystery as to why retailers are focusing on PLBs. Research indicates that (1) PLBs have higher gross margins than national brands (Ailawadi and Harlam 2004) and can help increase category and total profits (Dhar et. al 2001), (2) that strong PLBs can increase consumer store loyalty (Grewal 2004, Corstjens and Lal 2000), (3) that a strong PLB program can also enable retailers to achieve more than their “fair share” of a category’s total sales (Dhar et. al 2001) and retailers that outpace competitors in a category (i.e., have high category development index (CDI) scores) generally have strong PLB programs (Dhar and Hoch 1997), and that (4) a strong PLB program can provide retailers increased power in their relationship vis-à-vis national brand manufacturers (Chintagunta et. al 2002). While the retail side of the equation is rather straightforward, the consumer side is much murkier, and that is where I turn my attention next.
PLBs: Consumer Dynamics
PLBs have achieved remarkable levels of consumer acceptance. Some examples (from Dardell and Tarnowski 2006):
• Approximately 85% of private label buyers say that it's a good alternative to brands. • 59% percent of consumers say that it's "just as good" as national brands.
• One-third of consumers say that some private label items have "higher quality" than brands. • Approximately 90% percent of consumers feel comfortable serving private label to their guests. • 72% of consumers don't believe that national brands are worth the extra cost.
• 68% percent of consumers believe that private label is an extremely good value.
Using multiple regression, Sethuraman and Cole (1996) found the following demographic drivers were significant drivers of choosing national brand vs. store brands:
• Higher income (> $50K) or lower income (< $25K) households are willing to pay larger price premiums than middle-income households ($25-50K).
• Younger consumers are willing to pay larger price premiums than older consumers. • Females are willing to pay larger price premiums than males.
Richardson et. al (1996) find that consumer propensity to purchase PLBs is more complicated and depends on a number of factors, relating both to the individual (both demographic and psychological) and the category (in terms of quality variation, value for money, consumer knowledge, etc.). In other research, Dhar and Hoch (1997) find that a consumer base that is less wealthy and more elderly significantly enhances store brand programs. However, Dick et. al (1995) find that the proportion of consumers buying PLBs drops dramatically after age 45+. This is just one example of numerous contradictory findings in the literature (note also that given the rapid growth of PLBs over the past decade, it stands to reason that consumer penetration has increased and may have rendered findings of even some newer articles obsolete). Overall, academic research has found that the consumers most likely to purchase PLBs are middle-income, moderately well-educated, and with large families. Nonteheless, the utility of these findings is a bit questionable. Demographic variables only account for a small percentage (4-5%) of the variation in PLB purchases (Sethuraman and Cole 1996), which has led some researchers to the belief that there are no significant differences whatsoever in demographics between PLB and national brand consumers (Sudhir and Talukdar 2004). This is supported by the 2001 findings of the PLMA that over 80% of consumers have purchased private label products (Sheinin and Wagner 2003).
Rather than attempting to attach demographic information to PLB usage, perhaps understanding (and targeting) these consumers is better accomplished by considering store-brand proclivity as a variable in-and-of-itself, and examining psychographic commonalities, rather than seeking associated demographic characteristics. For instance, Hansen et. al (2006) find (based on data from one retail store) that, across 10 product categories, households “do display similarities in their preference for store brands and marketing mix sensitivity across the categories” and suggest that “household-level factor estimates could be used in identifying the “store-brand prone” consumers and targeting these consumers in new product categories” (p. 88). Given this approach, it is appropriate to consider a next question: why do consumers purchase PLBs?
For the past 50 years, the primary attraction of generic products and private label brands has been their lower prices versus national brands. A walk through any major retailer will confirm the price discrepancy between PLBs and leading national brands. For instance, PLBs in grocery stores cost 10-30% less than national brands (Baltas 1997). The introduction of private labels does (given PLBs’ usual status as one of, if not the, lowest-priced brands in a category) add a brand that would theoretically appeal to price-conscious consumers. Accordingly, store brand consumers have been found to be more price-conscious than average consumers (Dick et al 1995).
Quality assumptions are another key driver of consumer acceptance or rejection of PLB products. The degree to which a consumer is uncertain of the quality of a PLB vs. a national brand will contribute to the success or lack thereof (Batra and Sinha 2000). Common sense would indicate that when PLBs, which are usually the lowest-priced brands in a category, start to make significant quality gains that at least a portion of that category’s consumer base would increasingly view them as a viable option. The key here is perceived value, defined by Dodds et. al (1991 p. 316) as “a cognitive tradeoff between perceived quality and sacrifice.” When products are viewed by consumers as being “low quality” and “low price,” the perceived value will likely be poor despite the low price. However, when quality starts to increase—as has been the case with PLBs—and both absolute and relative (to national brands) pricing have remained roughly flat, it follows that perceived value would strengthen and appeal to value-conscious consumers.
However, this is not to say that all consumers—even value-conscious ones—will view PLBs as an attractive option. Garretson et. al (2002) write that consumers essentially have two main choices if they want to save money: (1) buy national brands while using coupons, shopping on deal, etc., or (2) buy private label brands. In answering the question “are these two options equally appealing to value-conscious consumers?” they find that value-value-consciousness is indeed exhibited through both of these behaviors, but that consumers generally prefer one or the other, and that preference is driven by the belief (or lack thereof) that price signifies quality. For consumers that believe this to a high degree, getting a special deal on a national brand means that they have proven themselves a “smart shopper” while getting the higher-quality brand at a value price. For consumers with less of a tendency to believe that price signifies quality, they seek “pure value” and are attracted to private label products (Garretson et. al 2002). Consumers that are “price-conscious” but not “promotion-sensitive” seem to make up the stereotypical “store brand shopper” (Baltas 1999 p. 321). This research can perhaps be connected to that of Lee (2004), who finds that consumers (I.E., Korean shoppers) compare PLBs to their self image in much the same way they do national brands. If these findings also apply to American consumers, consider a consumer who prides herself as “seeing through the marketing hype”; private labels may strongly appeal to her if she believes that she’s getting essentially the same product for a much reduced price since she’s not paying for advertising, promotion, and other national brand orientated costs.
Similarly, research by Ailawadi et. al (2001) segments consumers into four distinct groups: deal-focused consumers, store brand-focused consumers, deal and store brand users (use-all), and nonusers of both store brands and deals (use-none). As signified by the chosen consumer labels, PLBs appeal differently to each of these groups. As the authors write, by using this grouping “manufacturers and retailers have the opportunity to either avoid each other or compete head to head, depending on which segment they target” (p. 71).
Certain categories are much more developed in terms of private label share and penetration than others. There are, quite simply, categories in which value-conscious, store-brand focused consumers are much less likely to purchase PLBs than others. At a category level, one of the key drivers of PLB acceptance is risk, since “PLB buying increases as the consequences of making a purchase mistake decrease” (Batra and Sinha 2000 p 187). The findings of Erdem et. al (2004) also support this notion, as Americans are found to view PLBs with more uncertainty than shoppers in Spain or the U.K., and tend to be more risk averse than the European test subjects were. This risk aversion also plays into the findings of Batra and Sinha (2000), who find that consumers are more comfortable purchasing a PLB in a “search” category (where product benefits can be understood by reading a label) than an “experiential” category (where the product benefits have to be experienced to be understood).
Another related concept is that of consumer involvement. It stands to reason that the level of consumer involvement and overall evaluation of a category could either help or hurt PLB sales; depending on the category, consumers may say “I know this category, and there’s not a real difference between this store brand and the national brand” or they may say “In this category, you really get what you pay for.” It is in frequently purchased categories with high consumer involvement and low risk (e.g., milk) that private labels have perhaps their greatest potential with these consumers. Given that consumer contribution depends on the dollar margin of the unit purchased and also on the number and type of products purchased (Ailawadi and Harlam 2004), when retailers can establish loyal consumers in these categories they take a major step towards PLB success.
PLB Dynamics: The Role of the Retailer
Retailers are becoming more sophisticated with PLBs, and often not treating their PLBs with a one-rule-fits-all mentality (e.g., consistent pricing across categories at a percentage of the leading brand’s price). However, retailers have unique concepts (e.g., Target’s positioning differs from Food Lion’s differs from Publix’s) and these concepts are likely to carry over onto the “own brand” PLBs. Retailers with high-quality positionings may have an easier time conveying a high-quality PLB offering, and research suggests that the most important factor in explaining variation in price premiums brands can achieve versus PLBs is perceived quality differential (Sethuraman and Cole 1999). The importance of this consistency cannot be overstated; a high-quality PLB not only implies a high degree of relative quality to national brands, but low quality variability in the PLB product itself (Hoch and Banjeri 1993). High-quality products is a piece of retailer strategy that academic literature seems to take almost as a given for having a successful private label program, but the actual store experience can influence consumers as well. As Ailawadi and Keller (2004) write, “a pleasing in-store atmosphere provides substantial hedonic utility to consumers and encourages them to visit more often, stay longer, and buy more. Although it also improves consumers’ perceptions of the quality of merchandise in the store, consumers tend to associate it with higher prices” (p. 333).
Hypothesis Generation and Resulting Model
Given the preceding literature review, we next offer hypotheses. To reiterate, the stated goal of this paper is to explicate the process of consumer evaluations of PLB products. An obvious driver of this evaluation is going to be the retailer itself. Given that this product is the retailer’s “own brand,” consumer evaluations of PLBs are likely to be highly correlated to their evaluations of the PLB’s parent retailer. Therefore, it stands to reason that if a consumer has a highly positive evaluation of Target, she
will likely think more highly of Target’s PLBs; conversely, a consumer with a negative evaluation of Target will likely negatively evaluate Target’s PLBs.
Similarly, consumers will have inherent evaluations of the category itself. A consumer that has a high evaluation of snack nuts will likely evaluate PLB snack nuts more highly than one with a low evaluation of the category. Note that there are possible conflicting dynamics (as discussed previously regarding consumer involvement), as a consumer may have extremely high evaluation of the category and have the knowledge to say “PLBs are bad in this category” or that high evaluation may be driven by the leading brand or brands and PLB would be viewed as vastly inferior; however, ceteris paribus I posit that more often than not a high category evaluation will be positively correlated with a high PLB evaluation. Thus we have H1 and H2:
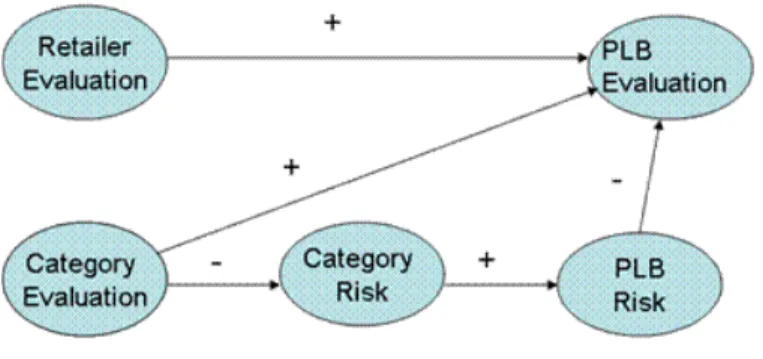
H1: Consumers’ evaluations of the retailer (store) will have a direct positive effect on their evaluation of that retailer’s PLB products.
H2: Consumers’ evaluations of the product category will have a direct positive effect on their evaluations of that category’s PLB products.
The PLB literature, as discussed, has demonstrated that perceived risk is a key driver of PLB acceptance. For instance, I may view milk as a very low risk product, and since there’s not a great penalty if I choose poorly I may be more inclined to buy private label brands. The same would probably not hold for products like automobile tires, or contraceptives, or other products where consequences could potentially be much direr. Therefore, the PLB evaluation will be negatively influenced by the consumers’ perceived risk associated with that product, which will be positively correlated with the perceived risk of the overall category. Finally, consumer’s evaluations of the PLB risk may be partially derived from their overall liking or lack thereof of a category. For instance, I may view cigarettes negatively, and therefore view them as higher in risk than someone with a positive view (note that an alternative hypothesis would be that the relationship between category evaluation and perceived risk would be bi-directional, with risk also negatively influencing category evaluation, but I include only the former in my model in keeping with parsimony). Thus we have H3:
H3: Consumer’s evaluations of PLB risk will have a direct negative effect on their evaluations of PLB products., with category risk negatively affecting PLB risk, and category evaluation negatively affecting category risk.
Structural equation modeling is an appropriate methodology to examine these hypothesis since I have hypothesized both direct and indirect effects of various variables on the ultimate PLB evaluation (thus rendering multiple regression of limited utility) and since I am going to be treating these key variables as latent (thus allowing more than one operational measure to be employed for each). The structural model and predicted relationships are found in Figure 1.
I treat retailer evaluation and category evaluation as exogenous variables, noting that there are myriad factors that influence those latent variables’ items’ values. Category risk, PLB risk, and PLB evaluation are conceptualized as endogenous variables; treated category risk as endogenous is questionable (as previously discussed), and I would expect the associated error to be very large, and for there to be a very low R-squared when category risk is regressed against category evaluation.
Note that this model is missing some key variables that were discussed in the literature review. For instance, the overwhelmingly important issue of price (absolute price, price gaps vs. national brand competitors, etc.) is not accounted for. Also, some consumer “conditions” (whether demographics, store
brand proclivity, or a more complex classification like Ailawadi et. al’s (2001) previously discussed four-groups classification schema) should likely have been analyzed integral to, or as antecedents to, the PLB evaluation process. These omissions are driven by the use of a preexisting data set which did not measure these other variables; while the hypotheses were developed a priori, I had an underlying knowledge of the data available to me for this specific class paper, and thus I have only a partial, simplified picture what is undoubtedly a more complicated process. With the caveat in mind (and given that I will discuss these omissions more in the limitations section), I move next to the methods section.
METHOD AND RESULTS
I first developed a retailer, product category, and brands to use as stimuli. For this paper, I chose a focal product category of cheese slices. I chose to use a fictitious retailer and fictitious brand in order to avoid possible confounds driven by pre-existing consumer perceptions of real-world examples. I developed a fictitious retailer with a price-quality neutral positioning and named it FoodMart, describing it as “FoodMart Supermarkets is a chain of supermarkets that offers quality foods at average prices. Their customers want good products at a fair price. When customers want both solid quality and prices, FoodMart Supermarkets is the top choice.” I chose to utilize the retailer’s own-name on the PLB because of two reasons (1) this is a very common practice among large retailers, and (2) research has suggested that this is the most effective way to go-to-market with PLBs (e.g., Dhar and Hoch 1997). The descriptions that subjects read are about the brand’s entry into the cheese slices category (e.g., Boyer brand Cheese Slices).
After my respondents read these descriptions, they completed a questionnaire featuring seven-point semantic scales to measure subject’s evaluation indexes of retailer, product category, and category brands. Retailer evaluation index, product category evaluation index, and brand evaluation index are operationalized using three semantic scale items that are very common in the marketing literature (anchored by unfavorable/favorable, negative/positive, bad/good, and unpleasant/pleasant). A consideration before proceeding further is whether or not the model is identified, given latent variables with three items apiece; that is, whether there are at least an equal number of observations and free model parameters (Kline 2005). In this case, a cursory glance reveals that there will be substantially more observations than parameters, and the model is also recursive given that none of the variable disturbances are correlated and none of the relationships are operationalized as bi-directional (Kline 2005). The questionnaire also featured three semantic scales designed to measure category and brand risk (anchored again by measures common in the marketing literature: high risk/low risk, unsafe/safe, and dangerous/not dangerous). The questionnaire was completed by 80 undergraduate students at a major southeastern university (interestingly, I had absolutely no missing data on any of the sections used in this analysis). SEM generally requires a much larger sample size (as Kline (2005) writes, “it is still a large-sample technique (pg. 10)”), so I will revisit the sample size later in terms of power analysis and the possibility of Type II errors.
Measurement Model
The five latent variables (retailer evaluation, category evaluation, category risk, PLB risk, and PLB evaluation) were first analyzed for reliability. Each coefficient alpha is extremely high (.95-.97); while in general a higher coefficient alpha is desirable, indicating items “hanging together” under their respective latent variables, in this case they could be troublesome. Because the items were grouped
together in blocks and not rotated in any way (see appendix for questionnaire) there is the potential here for respondent bias that artificially inflated these reliabilities.
Given that caveat, I next analyze the overall fit of the measurement model using confirmatory factor analysis (CFA) using AMOS 7.0. I perform a five-factor CFA with the 15 items. The CFA indicates the measurement model has roughly between a moderate and good level of fit. The chi-square test is statistically significant with high confidence (χ2=116.5, df=80, p=.005), but given that this test is extremely sensitive the sample size I also measure χ2/df = 1.5. While there is no agreement of what value (often 2, 3, or 5) indicates “good” fit (Kline 2005), the 1.5 score is lower than all of these rules-of-thumb. Hoelter’s N indicates at what sample size the chi-square test would have achieved significance; at a .05 level this equals 70, and given a total sample size of 80 this hints that the chi-square test’s significance overstates the limitation of the model’s utility. The goodness of fit index (GFI) which estimates the proportion of variability in my sample’s covariance matrix that is explained by this model (Kline 2005)—and is roughly analogous to the R-squared and widely reported—is .85, which is below the recommended level of .90 (Kline 2005) indicated that my measurement model has somewhat suspect explanatory power. The standardized root mean square residual (SRMR), an index measuring observed vs. predicted covariance fit (Kline 2005) is .03, below the typically suggested level of .10 and Hu and Bentler’s (1999) more restrictive recommendation of .08. The root mean square error of approximation (RMSEA) which measures lack of fit of the model to a population-based index and approximates a non-central chi-square distribution (and thus doesn’t assume perfect fit) (Kline 2005) is .076, below the generally accepted measure of reasonable fit (.08) but above Hu and Bentler’s more conservative .06 recommendation. Furthermore, the RMSEA’s upper confidence limit is .105, which is above the .10 level that can indicate poor fit. Thus, overall the RMSEA indicates moderate fit at best. The widely cited comparative fit index (CFI) comparing the measurement model to a null model (Kline 2005) is .98, well over both the acceptable rule-of-thumb of .90 and Hu and Bentler’s more conservative .95. The Tucker-Lewis Index (TLI), another comparative fit index, is .97, again better than the generally accepted .90 and Hu and Bentler’s .95. Finally, the Akaike Information Criterion (AIC) for the measurement model is 196.5, which I’ll use to compare to other potential models from this same data set. So overall, the measurement model indicates a moderate (perhaps towards good) fit of the data to my model. I next examine the structural equation model.
Structural Equation Model
I again estimate the overall fit of my model. The first consideration is whether or not my structural model is significantly different from the measurement model, which would indicate that the restrictions I posit are having a deleterious effect on the overall utility of the model. The structural model’s chi-square test is again statistically significant with high confidence (χ2=131.84, df=84, p=.001). Comparing
this to the measurement model yields a chi-square statistic difference of 15.3 with 4 degrees of freedom, with p=.004. Therefore, the two models are statistically different (but the low chi-square difference could add to this black-and-white analysis a shade of grey, perhaps that the model is still of value.) Given the a priori ideal of SEM, rather than adding in paths I simply note this potential shortcoming of the model and proceed with the analysis of this more theoretically justified model.
The structural model’s χ2/df = 1.6, again lower than acceptable rules-of-thumb. Hoelter’s N (indicating
at what sample size the chi-square test would have achieved significance at a .05 level) equals 64, perhaps indicating moderate fit. The goodness of fit index (GFI) is .84, again below the recommended
level of .90 (Kline 2005). The standardized root mean square residual (SRMR) is .06, again below even the more restrictive recommendation of .08. The root mean square error of approximation (RMSEA) is .085, just above the generally accepted measure of reasonable fit (.08) but below the .10 level that indicates poor fit (although the upper confidence interval is .11). The comparative fit index (CFI) is .97, well over both the acceptable rule-of-thumb of .90 and Hu and Bentler’s more conservative .95. The Tucker-Lewis Index (TLI) is .96, again better than the generally accepted .90 and Hu and Bentler’s .95. Finally, the Akaike Information Criterion (AIC) for the measurement model is 203.8, above the measurement model’s 196.5, but reasonably close; additionally, a similar measure, the expected cross validation index (ECVI)’s confidence intervals for the two models overlap and each contain the other’s index value, indicating that the two models are rather similar in fit. Overall, the theoretical model is roughly similar to the measurement model, but somewhat borderline on the borderline in terms of overall fit based on its fit measures alone.
Parameter Estimate Analysis
The next step in the SEM analysis is to examine the individual parameter estimates, especially in terms of the hypothesized relationship effects. One of the difficulties of SEM is that the chi-square test is the only true statistical test that is conducted, and given its rigidity it is rather rare to have an insignificant result. Given that, and based on the collective rules of thumb from SEM experts, my measurement model and structural model looked to be a moderate fit at worst; many of the fit statistics seemed to indicate an excellent fit (especially given only 80 subjects). However, the specific parameter estimates seem to confirm that I have simply “capitalized on chance” with the overall fit estimates, but that did not carry through to the parameter estimates.
Interestingly, retailer evaluation-PLB evaluation relationship is non-significant. This runs contrary to nearly all PLB research that would suggest that the single most important indicator of PLB success is the retailer’s equity. Also interestingly, the hypothesized negative relationships (category evaluation-category risk and PLB risk-PLB evaluation) are both highly significant and positive. This is essentially saying that my data suggest that for every increase in a consumer’s evaluation of the category a corresponding increase in their perceived risk will occur, and that for every increase in PLB risk a corresponding increase in PLB evaluation will occur. Of particular interest is the fact that when a multiple regression analysis (using the mean level of all the items for each variable) with PLB evaluation as the dependent variable and the other latent variables (retailer evaluation, category evaluation, category risk, PLB risk) as independent variables, all of the hypothesized relationships are in the hypothesized direction (positive or negative) and retailer risk and category risk are non-significant (or what many researchers would call “marginally significant” at the .05 confidence level) and retailer evaluation is strongly significant (p < .012). I would be remiss in not mentioning the limited statistical power in my SEM model. I had only N=80 in this study, and using shareware obtained from a colleague, at an alpha level of .05 I have a power statistic of .47. In order to have a power statistic of .80, I’d have needed a sample size of nearly double that (N=148).
LIMITATIONS AND CONCLUSION
The first and most major limitation is theoretical, namely that major variables that theory would perhaps demand be present are missing. Two of these are price and PLB typicality. The fact that price is not included anywhere in the conceptualization of the model is a fatal flaw, as perhaps the most important
component of PLB strategy is pricing, and evidence in academic research of that assertion abounds (e.g., Corstjens and Lal 2000, Ailawaidi and Harlam 2004). In terms of typicality, while leading national brands, by their very nature, can be assumed to be typical of the categories they are in (e.g., Gatorade in sports drinks), but a PLB can also be viewed as very typical of a category (e.g., in a high PLB-share categories like internal analgesics) or atypical of a category (e.g., in a low PLB-share category like beer). Note that because PLB products to a large degree are perceived as “copycats” (Kumar and Steenkamp 2007) even in high-typicality situations, there is little chance that consumers will view a PLB as atypical because is it superior to the NB; it simply approaches the NB’s value equation (quality divided by price). The study is also flawed in the conceptualization given that there is probably no way that one category (in this case, cheese slices) could possibly serve as an exemplar for an entire phenomenon as robust as the private label phenomenon. Categories vary widely in terms of PLB performance and a theoretically improved version of this study would need to be repeated across many different categories (with different risk levels)—or build them in to the overall model—in order to have any semblance of external validity. Finally, the execution of the study was questionable. The stimulus design is conducive to answer bias with no rotation, no negatively scaled items, and in its “block” format, and the high correlations between PLB, retailer, and category evaluation items and risk items (and between both of those) indicate that bias might have occurred. The sample size was rather small (80 subjects). As stated in the opening, the goal of this paper is to answer the question “What variables influence consumer private label brand (PLB) evaluations?” I present an interesting first step, albeit a rough one. To proceed further, one would essentially need to start at the theoretical level and truly build an a priori model of the PLB evaluation process, then properly conceptualize and execute that model. There is enough here, however, for me to believe that this is indeed an executable project and that an SEM-based process analysis would be a valuable addition to the PLB marketing literature.
REFERENCES
Ailawadi, Kusum and Bari Harlam (2004), An Empirical Analysis of the Determinants of Retail Margins: The Role of Store-Brand Share, Journal of Marketing, 68, January, 147-65.
Ailawadi, Kusum and Kevin Keller (2004), Understanding Retail Branding: Conceptual Insights and Research Priorities, Journal of Retailing, 80, 331-42.
Ailawadi, Kusum, Scott A. Neslin, and Karen Gedenk (2001), Pursuing the Value Conscious Consumer: Store Brands Versus National Brand Promotions, Journal of Marketing, 65, 71-89.
Baltas, George (1997), Determinants of Store Brand Choice: A Behavioral Analysis, Journal of Product & Brand Management, 6, 5, 315-24.
Batra, Rajeev and Indrajit Sinha, (2000), Consumer-Level Factors Moderating the Success of Private Label Brands, Journal of Retailing, 76, 2, 175-91.
Chintagunta, Pradeep, Andre Bonfrer , and Inseong Song (2002), Investigating the Effects of Store-Brand Introduction on Retailer Demand and Pricing Behavior, Management Science, 48, 10, 1242-67. Corstjens, Marcel, and Rajiv Lal (2000), Building Store Loyalty Through Store Brands, Journal of Marketing Research, XXXVII, August 281-91.
Dhar, Sanjay K., Stephen J. Hoch, Nanda Kumar (2001), Effective Category Management Depends on the Role of the Category, Journal of Retailing, 77, 165-84.
Dhar, Sanjay K., and Stephen J. Hoch, (1997), Why Store Brand Penetration Varies By Retailer, Marketing Science, 16, 3, 208-27.
Dick, Alan, Arun Jain, and Paul Richardson (1995), Correlates of Store Brand Proneness: Some Empirical Observations, Journal of Product & Brand Management, 4, 15-22.
Dodds William B., Kent B. Monroe, and Dhruv Grewal (1991), Effects of Price, Brand, and Store Information on Buyers' Product Evaulations, Journal of Marketing Research, XXVIII, August, 307-19. Dowdell, Stephen and Joseph Tarnowski (2006), Going Public With Private Label, Progressive Grocer, 85 (9), 34-6.
Erdem, Tulin, Ying Zhao, and Ana Valenzuela (2004), Performance of Store Brands: A Cross-Country Analysis of Consumer Store-Brand Preferences, Perceptions, and Risk, Journal of Marketing Research, XLI, February, 86-100.
Garretson, Judith A., Dan Fisher, and Scot Burton (2002), Antecedents of Private Label Attitude and National Brand Promotion Attitude: Similarities and Differences, Journal of Retailing, 78, 91-9.
Grewal, Dhruv, Michael Levy, and Donald Lehmann, (2004), Retail Branding and Customer Loyalty: An Overview, Journal of Retailing, 80, 4, 245-9.
Hansen, Karsten, Vishal Singh, and Pradeep Chintagunta (2006), Understanding Store-Brand Purchase Behavior Across Categories, Marketing Science, 25, 1, 75-90.
Hoch, Stephen (1996), How Should National Brands Think of Private Labels? Sloan Management Review, 37, Winter, 89-102.
Hoch, Stephen and Shumeet Banerji (1993), When do Private Label Brands Succeed? Sloan Management Review, 34, 4, 57-67.
Hu, L.T., & Bentler, P. (1999), Cutoff criteria for fit indexes in covariance structure analysis: Conventional criteria versus new alternatives, Structural Equation Modeling, 6, 1-55.
Kline, R. B. (2004), Principles and Practice of Structural Equation Modeling (2ndEd.). New York: Guilford Publications.
Kumar V., and Denish Shah (2004), Building and Sustaining Profitable Customer Loyalty for the 21st Century, Journal of Retailing, 80, 317-30.
Lee, Dongdae (2004), Image Congruence and Attitudes Toward Private Brands, Advances in Consumer Research, 31, 435-41.
McDonald, R., & Ho, M.-H. R. (2002), Principles and practice in reporting structural equation analyses, Psychological Methods, 7, 64-82.
Murphy, Patrick E., and Gene R. Laczniak (1979), Generic Supermarket Items: A Product and Consumer Analysis, Journal of Retailing, 55, 2, 3-14.
Raju, Jagmohan S., Rej Sethuraman, Sanjay K. Dhar (1995), The Introduction and Performance of Store Brands, Management Science, 41, 6, 957-78.
Richardson, Paul S., Arun K. Jain, and Alan Dick (1996), Household Store Brand Proneness: A Framework, Journal of Retailing, 72, 2, 159-85.
Rosen, Dennis L. (1984), Consumer Perceptions of Quality for Generic Grocery Products: A Comparison Across Product Categories, Journal of Retailing, 60, 4, 64-80.
Sethuraman, Raj and Catherine Cole (1999), Factors Influencing the Price Premiums that Consumers Pay for National Brands Over Store Brands, Journal of Product & Brand Management, 8 (4), 340-51. Sethuraman, Raj , V. Srinivasan, and Doyle Kim (1999), Asymmetric and Neighborhood Cross-Price Effects: Some Empirical Generalizations, Marketing Science, 18, 1, 23-41.
Sheinin, Daniel and Janet Wagner (2003), Pricing Store Brands Across Categories and Retailers, Journal of Product & Brand Management, 12 (4), 201-219.
Soberman, David A. and Philip M. Parker (2006), The Economics of Quality-Equivalent Store Brands, International Journal of Research in Marketing, 23, 125-139.
Sudhir K. and Debabrata Talukdar (2004), Does Store Brand Patronage Improve Store Patronage?, Review of Industrial Organization, 24, 143-160.
Tanaka, J.S. (1993), Multifaceted conceptions of fit in structural equation models, in K.A. Bollen & J.S. Long (Eds.), Testing Structural Equation Models (pages 10-39), Newbury Park, CA: Sage.