I
POLICY
RFSEARCH 'WORKING PAPi;R
1457
I
Does D)ecentralization
Decentralization tends toincrease both total and
Increase Spending
subnational spending onPublic
If
public infrastructure. Why thison
PU
Infrastructure?
is so is not clear- possiblybecause subnationa)
Antonio Estache govemments' choices in
Sarbajit Sinha terms of quality and quantity
of infrastructure differ from
central governments choices.
Background paper for World Development Reporl 1994
The World Bank
Office of the Vice Prcsidenrt Development Ecooon-flcs
May 1995
Public Disclosure Authorized
Public Disclosure Authorized
Public Disclosure Authorized
Summary findings
i: is coiiinii'(iilv a gued that when the bntiefits of an concilisions can be made about whether decentralization ;ifrastruroict service art mostisy local anid there is little makes spending more or less cfficient Among the
w' e Lor ecOllonlies of scai- as in urhan trat sit, road conclusions they offer:
-ii.lirt(itanct, w ater supply, andl solid wate rrianagenment - Decentralization tends to increase both total and
decetiidalization is the mi 'st effecive wvay o deliver subniatiorial spending on infrastructure - possibly
Vice. iI host services have bheen dtcentralizd in manv because the preferences of subnational governments in
'a
)tWries, a lLd main others are rapidly deifceintrillizing, terms of quality and quantity of infrastructure are
1lw lentral governiillnt is slill respoosble for many different from the central government's preferences.
'tactr ittrastruCtuLt services, such i s power and(3 T he conventional wisdom is true: For u!cconintuifncatioils, but this Ito Is changing as the decenitralization, policymakers everywhere must respinsibility is ncreasitigls tralnsfeired tI sUbnational guaranitee a balance between revenue and spending
g. veriroents. Rc-cenr technological Hinno atimiis rdCluce assignmenr. A good way to offset the impact of
.-iv n.'ed hr sertsie to be provided bl mnopolistic decentralization on spending levels is to increase the :tiiuties. 'iower genierati(oin arnd distribution car niw be imbalance between revenue and spending assignments.
m
1ridlcd cI ompnritiv(ilv hb deCetrralized u nlit, and parts * Be careful about applying lessons learned in :Zi ru1le local telepho ne nii(pilolies will inCreasinglv industrial countries to decentralization in developing
'-, oiIpirt it,ii n f-imn wiless telepliones and rival cotintries. What happens in industrial countries may help
a Ichli ire sy asstss the decentralizationi's impact on total spending in
lis , ra, incre-rased decentralization affected spending developing countries, because the elasticity of per capita vi lIs on intrastrilcl Liret TIhe ortciorne reflects the net infrastructure spending is roughly similar in both 'ib. ilire i-f ippsrmng Lffecrs. `pending increases if the countiries (about 0.3 in developing countries and about so1bnarional governinent makce infrastructure a higher 0.2 in industrial countries). But that is not a good pri,itii rThan thIe federal govcrnment did, if they are less indicator for subnational spending, for which the '.ttectivc It delivering serviLes, ir if they give up the elasticity is greater than 1 in developing countries
ienctits of economies (if scale ito get mlore autonotny. (between 1. I and 1.3, depending on how
s,jpcnding dc.reases if thet aNssitn infrastructure a lowsvl deceiitralization is measured) and less than I in industrial priorniy ori it t(ist proiriets are mnore cost-effcctive. couiirries (between 0.7 and 0.9).
In their analysis, IFstache and Sinh.a focnL- ot spending evcls and ignore th. rea'ilns these lcvel, clhange, so no
[his paper -a product of the Office of the Vice President, Development Economics - is a background paper for World
Development Rep(ort 1994 on infrastructure. Copies of this paper are available free from the World Bank, 1818 H Street NW, \Vashington, DC 20433. I'lease contact the World Development Report office, room T7-101, extension 31393 (26 pages). NMay I 995.
Ihe Policy Researcl W'orki,n l'a per Series diss,-irnates the findings of w'cork in progress to encourage the exchange of ideas about
dei'elopnient issues. An iec ,iveof if the s5eii e is n) get the findin)gs out qut:cklv, even ifthe pt-esentations are less than fully polished. The
papers carry the narmes of the autho and h'ul,ld bte usse d and cited accordingly. T7he findings. initerpretations, and conclusions are the
a uIt/ers' ,:' .tnd s/i )il 'i'u,t 1e a,tt, ib14t1cd tr, tir' W orld flank, rts Fxecutive Board of Dire(tors. or any of its member countries.
Does Decentralization
Increase Spending
on Public Infrastructure?
Antonio Estache Sarbajit Sinha
When the benefits of an infrastructure service are mostly local and there is little scope for economies of scale, as in solid waste management, urban transit, water supply, and roads maintenance, it is commonly argued that decentralization is the most effective way to deliver service. These categories of expenditure are already decentralized in so many countries and are increasingly being decentralized in so many others.
There are many other infrastructure services, such as power and telecommunications, for which most expenditures are still mainly the responsibility of the central government. But this is changing rapidly as the responsibility for some of these activities is increasingly being transferred to or shared with subnational governments. Tne increased opportunity to decentralize infrastructure is the result of recent technological innovations that reduce the need for services to be provided by monopolistic utilities.' In the power sector, generation and distribution can now be handled competitively by decentralized units.2 Similarly, even if parts of local telephony remain natural monopolies, other portions will be exposed to competition from wireless telephony and rival wireline systems.3
How have increases in decentralization in infrastructure affected expenditure levels in infrastructure? The outcome reflects the net impact of opposing effects. Expenditure will
The paper has benefited from comments by Richard Bird, Mathias Deatripont, Greg Ingram, Peter Lanjouw, Lant Pritchett, Gerard Roland and Joaquim von Amsberg. Any mistakes are of course our sole responsibility. Moreover, the discussion does not reflect the views of the World Bank, its Executive Board of Directors, or its member countries
1. At the local level, monopolies will remain, but their monopoly power will be reduced by the introduction of yardstick competition between local monopolies.
2. See Besant-Jones (1993) or Humplick (1992). 3. See Baumol and Sidak (1993).
increase if, collectively, subnational governments rank infrastructure as a higher priority than did the federal government, if they are less effective at delivering services, or if they give up
the benefits of economies of scale in order to obtain more autonomy. It will decrease if decentralization results in a lower ranking of infrastructure or if it results in increased cost-effectiveness for most projects.
The paper estimates econometrically the net impact of decentralization on total and subnational infrastructure expenditure in two country samples: one including ten
industrialized countries, and the other ten developing countries.4 The two samples are
separated because infrastructure expenditure in the developing countries is likely to increase faster since their coverage ratios are still lagging significantly behind those found in
industrialized countries and in many cases the private sector is unlikely to pitch in.5
The analysis focuses on expenditure level and ignores the sources of changes in these levels.6 Thus no conclusions can be made about the impact of decentralization on the
efficiency of expenditures. However, because the level of infrastructure expenditure is also related to other factors, including some over which policymakers have leverage, such as grants and matching revenue and expenditure assignment, the analysis has direct policy relevance. More specifically, the paper identifies the relative importance of these factors and shows how they can complement or offset the direct effect of decentralization of expenditure and revenue responsibilities.
4. For a recent discussion of infrastructure decentralization, see Bird (1994). 5. See chapter I in Wbrld Developmerit Report 1994.
6. A companion paper by Estache and Humplick (1994) assesses the efficiency gains and losses due to decentralization.
Checking facts: What is the data and what does it say?
Organization for Economic Cooperation and Development (OECD) countries have good databases on decentralization in infrastructure. Developing countries, where most decentralization efforts are now taking place, do not. To obtain a comparable measure of the extent of decentralization in infrastructure for a multiple country saniple, the International Monetary FUnd (IMF) government statistics provide the only source of data. This database covers public expenditures in power, transport, and communications for both central and subnational government levels, but it has limitations. The most important limitation is the omission of many autonomous parastatals. Hence, the expenditure levels reported are lower bounds. This is important because in many countries, some of the infrastructure services discussed here (power and telecoms) are provided by public enterprises. Some of these parastatal expenditures are included in the IMF data since the government finance statistics include transfers by government departments to these public enterprises when they fail to address financial autonomy. In sum, if the IMF series are not an exact measure of the actual level of expenditure in the sector, they provide a reasonable proxy of the evolution of
expenditure behavior. A second problem is the grouping of different subsectors. For instance, transport and communications each represent a single expenditure category with
different degrees of involvement of the public sector, yet they are compiled together. A final problem is that this database does not separate capital and recurrent expenditures. This prevents a comparison of the differential role of these two categories of expenditure.
In spite of these limitations, the IMF source has the significant advantage of allowing a comparison of subnational infrastructure expenditure for a sample of industrialized and
developing countries (listed in the Appendix).7 The sample size is however limited to: ten
industrialized and ten developing countries. They were the only countries for which time series on infrastructure expenditure were available for all government levels. The
subsectoral data are aggregated to define a proxy for infrastructure expenditure. The main weakness of this proxy is the omission of the water sector, which can not be singled out in the IMF database.
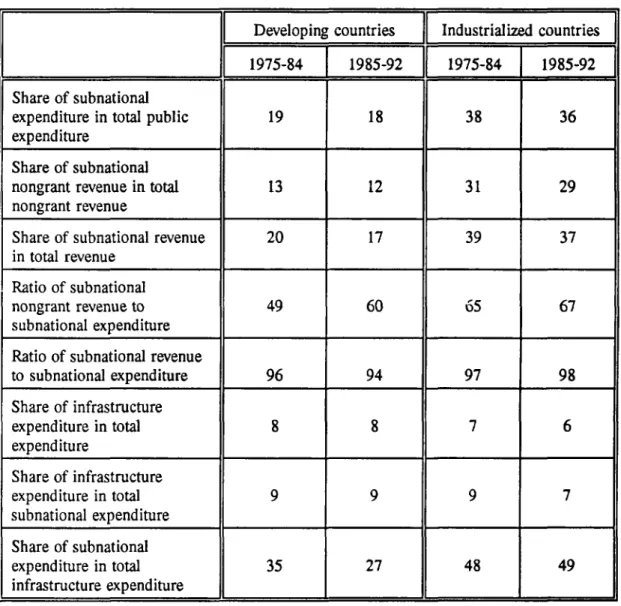
In this sample, decentralization of expenditures and of revenue is at least twice as large in the industrialized country group as the developing country group (Table 1).8 In both country groups, all three average indicators have stagnated between 1975 and 1992. This suggests that the evidence on the increased decentralization must have been found
elsewhere.
This is revealed in the evolution of the imbalances between expenditure and revenue assignments to subnational governments. This is where the greatest change over time has
been observed. Measured as the ratio of own revenue sources to expenditure, the imbalance is always larger in developing countries than in industrialized countries. But the average gap between own revenue and expenditure was cut from 51 percent in developing countries and
7. Oates (1989), Dillinger (1994), and Easterly (1993) address some of the issues raised by the IMF statistics. The main impact of these omissions is that the data provide a lower bound for the extent of decentralization since most of the omissions are subnational expenditures.
8. The Appendix gives the details on country and period coverage for each government level.
Table 1. Evolution of decentralization in developing and industrialized countries (percent)
]
Developing countries Industrialized countries1975-84
[
1985-92 1975-84 1985-92=
Share of subnational
expenditure in total public 19 18 38 36
expenditure
Share of subnational
nongrant revenue in total 13 12 31 29
nongrant revenue
Share of subnational revenue 20 17 39 37
in total revenue Ratio of subnational
nongrant revenue to 49 60 65 67
subnational expenditure .
Ratio of subnational revenue
to subnational expenditure 96 94 97 98 Share of infrastructure expenditure in total 8 8 7 6 expenditure Share of infrastructure expenditure in total 9 9 9 7 subnational expenditure . Share of subnational expenditure in total 35 27 48 49 infrastructure expenditure .
40 percent in industrialized countries between 1975 and 1984 to 35 percent in developing countries and to 33 percent in industrialized countries between 1985 and 1992. This may be the best indicator of the commitment to increased decentralized autonomy over expenditure decisions, particularly in developing countries. Grants appear to correct the imbalances substantially in developing countries, and almost completely in industrialized countries. The
level of aggregation available hides a potential problem. In many countries the earmarking of grants is significant and may favor or penalize infrastructure.
The decentralization figures suggest that if decentralization increases with income, it does not affect the share of total expenditure spent on infrastructure subsectors (Table 1). If anything, it reduces it somewhat. The share of expenditure subnational governments spend on these sectors is essentially the same in both groups of countries although two differences are worth pointing out. First, subnational governments contribute only a third of total infrastructure expenditure in developing countries, while in industrialized countries they contribute half of it. Second, although this share has been constant over the past eighteen years in the industrialized countries, it has been declining in the developing countries.9 The country-specific averages suggest wider differences. Subnational expenditure in these sectors vary from close to zero in Chile to more than 70 percent in other countries, both
industrialized and developing, with federal government structures. Even if this
approximation is somewhat overestimated because the large, central parastatals' expenditures are not accounted for, it provides a quantitative hint of the key role of subnational
governments in infrastructure.
9. Note that expenditure levels may be declining because efficiency is increasing. For evidence, see Estache and Humplick (1994).
A survey of studies on the effects of decentralization on total public expenditures
The previous sections rough data analysis must be complemented by a more detailed econometric study that can draw on the lessons from extensive literature on aggregate
expenditure levels. This section summarizes this literature. It draws some conclusions about the variables that have consistently been found relevant and hence should be included in the analysis of the effects of decentralization on infrastructure expenditure.
The literature on the relationship between the size of the government (usually measurecl as the ratio of public expenditure to GDP) and the degree of decentralization is large. It has primarily focused on the total size of the public sector rather than on the size of specific expenditure categories. It provides, however, useful and relevant insights. In
particular, it shows that the interactions of many opposing factors explains the size of the government. Yardstick competition across subnational governments or increased
accountability to voters may reduce the size of government as suggested by public choice
theory.'° A stronger preference by subnational governments for private provision of
services, as observed in the solid waste management and some aspects of the road and water
sectors may also contribute to lower public spending." In contrast, decentralized control
over expenditure decisions may be less tight than central control and result in higher expenditure levels, as was seen in Brazil after the 1988 constitutional reform. A
differentiation of technologies across regions may only partially reduce the cost reductions
10. This is the Leviathan hypothesis proposed by Brennan and Buchanan (1980). 11. Humplick (1992).
offered by economies of scale, and hence increases in expenditure levels may result from the different technologies adopted by subnational governments. Finally, higher expenditure levels may result from higher marginal and fixed costs, since the development of a local
administration can be a costly operation."2
The specific effect that each factor has on public sector growth is essentially an empirical matter ignored by the literature because the data needed to assess their relative importance are difficult to find. Most empirical research focuses instead on the reduced form that provides some indication of their net impact. The empirical studies measure different aspects of the problem (intracounty competition compared with intercounty
competition) depending on the factors explicitly considered in the models. These factors are generally reflected in the proxy picked to describe the extent and nature of decentralization (such as total expenditure or revenue share versus number of local units, unit specific
revenue share, general purpose or specific purpose, political nature of federalism) and in the selection of the database (national versus international, time-series versus cross-section). Since these studies have recently been surveyed by Oates (1989, 1991, 1993), the discussion below focuses on cross-country studies, which are the most relevant to this paper.
Studies based on international data bases have slowly moved toward rejecting a linkage between decentralization and total expenditure growth. The first international cross-sectional study was conducted by Oates (1972). He examines a cross-cross-sectional data set of fifty-seven countries in 1965 and finds inconclusive results. While he shows a negative relationship between the size of the public sector and a dummy variable describing whether
12. As mentioned by R. Prud'homme in a comment on a draft of the Wirld Development
the country is federalized, he finds a positive relationship for a variable measuring the degree of decentralization. Oates (1985) revisits the issue with a cross-sectional study of a 1982 international data set distinguishing between industrialized and developing countries. He rejects the hypothesis that a negative relationship exists between the extent of fiscal
decentralization and tax receipts as a share of GNP (a proxy for the size of government) for both groups of countries. Heil (1991), working on two different intemational data sets (1987 IMF data and 1988 OECD data), confirms these results. Saunders (1988) disagrees. Adding a dummy variable for federal countries, he finds that decentralization reduces aggregate expenditure for a panel of eighteen industrialized countries between 1978 and 1980.
These results have been criticized because studies based on international data bases assume that mobility is not an issue and hence may underestimate the reduction in public expenditure growth that can result from mobility. When mobility can be taken into account, as in the case of cross-sectional studies of the U.S., allowing for the analysis of very small units of observation, such as counties and local governments, decentralization seems to result in lower public sector growth, providing some credibility to the Brennan-Buchanan
hypothesis."3
An econometric analysis of total and subnational infrastructure expenditures
This section estimates a simple model explaining the behavior of per capita
infrastructure expenditure between 1970 and 1992 from a panel of data provided by the two
samples of countries previously described."4 The results reported here were obtained using
weighted least squares (WLS) to minimize the risks of failing to reject insignificant variables
because of potential heteroskedasticity problems.'5 The variable explained is the level of
per capita expenditure in infrastructure measured in 1985 US dollars."6 The explanatory
variables selected are similar to those found in the literature surveyed in the previous section:
* The per capita income level, to approximate the importance of the level of
development of the country. Any significant difference in the importance of this variable in the two samples of countries would provide some evidence that
fiscal decentralization may affect rich and poor countries differently'7.
* The country size, to approximate the importance of economies of scale. The
benefits of economies of scale tend to be mostly regional in large countries and national in smaller countries, explaining why decentralization has generally
been more common in larger countries.'8
14. Argentina uas omitted due to data problems for some of the right hand side variables. 15. Since the error variance is not known, we assumed that it is proportional to the square of the GDP variable, since this was the most significant variable in all models.
16. The model could also be viewed as an estimate of the demand for infrastructure expenditure, since from the perspective of that specific sector, the supply can be viewed as infinitely elastic.
17. Bahl and Linn (1992).
18. The inclusion of the country size has two roles. In addition to addressing one source of economies of scale, it picks up any country-specific characteristic (a proxy for a fixed effect traditionally accounted for in panel problems). The importance of this second role is that it implies that the interpretation of the coefficients can focus on the time-series component. In a nutshell, this interpretation assumes that all observations are from the same data generation process and thus country differences arise because of differences in location along the same
* The population density, to approximate the importance of congestion and economies of scale, which can result from population density at the local level. * The degree of decentralization measured in terms of the share of subnational
expenditure in total expenditure or own revenue in total revenue."9
* The ratio of subnational revenue to subnational expenditure, to measure the degree of vertical imbalance. The financial autonomy of subnational
governments is a common theme in the fiscal federalism literature. Grants are not central government expenditures and are seldom perceived by voters as part of the tax burden imposed on them by the subnational governments
(revealing a certain form of fiscal myopia since often they pay some of these grants through taxes to the central government).
3 The price-related variables, reflecting the degree of subsidy given to
subnational governments through grants and the overall price index as a proxy for the evolution of infrastructure service prices in each country and for the extent to which public sector financing relies on the inflation tax.
In an earlier version of the model, we had also included a dummy variable describing the political structure of the country, that is whether it has a federal structure or not. But
18.(... continued)
path. This interpretation 'uld have been much more difficult to sustain in a panel of data covering both country groups.
19. It could be argued that causality could run either way between decentralization and infrastructure expenditure. But infrastructure expenditure levels are not large enough to be considered plausible candidates to Granger-cause decentralization, as measured here.
this variable was never significant and we decided not to include it in the model. This decision did not affect the results reported here.
The functional form of the model is Cobb-Douglas, and it is estimated in logarithms. This allows us to interpret the estimated coefficients as elasticities. For each country group, the model is estimated for two data sets: the per capita total public infrastructure expenditure and the per capita subnational expenditure. A model is then estimated for each of these data sets. Decentralization is measured in terms of expenditure in one model and in terms of revenue in the other. Table 2 summarizes the results for developing countries and for industrialized countries.
The developing countries sample
All the variables are significant in all the models of the developing country sample and the adjusted R2 suggests a good fit for each (Table 2). The main conclusions focus on
the impact of decentralization. The elasticity of total infrastructure expenditure to the degree of decentralization in developing countries is about 0.3, whether decentralization is measured in terms of revenue or expenditure. This is not negligible since public investment in
infrastructure averages 4 percent of national output and typically accounts for half of all public investment.20 The impact of decentralization on subnational infrastructure
expenditure is about 4 times as large. A one percent increase in the degree of decentralization results in a 1.1 to 1.3 percent increase in subnational infrastructure expenditure for a given level of imbalance between revenue and expenditure assignments.
Obviously, decentralization matters and increases total and subnational expenditure on infrastructure services.
The impact of decentralization can, however, be offset by other factors related to decentralization. For instance, the increases due to decentralization are likely to be more than offset by an increase in the imbalance between revenue and expenditure assignment, as
typically found in developing countries (Table 1). This is the case for total infrastructure expenditure. For subnational expenditure, the results are less clear because many of the resources available to subnational governments are fungible and the increase in imbalance may be offset by a shift of local resources in favor of infrastructure and at the expense of any other subnational expenditure category. When decentralization is measured in terms of expenditure, the effect of the gap between own revenue sources and expenditure is less than half the effect of decentralization. When decentralization is measured in terms of revenue, it is about 30 percent more. In either case, the net effect on infrastructure expenditure levels is negative.
Surprisingly, the impact of grants is also negative. If services were local public goods, and the burden of providing these services was financed through grants and hence shared by the total country population, the grant variable should have a positive sign. The negative sign may be interpreted in three ways. First, the local users do not show fiscal myopia in the sense that they know that if they do not pay for the services through user fees or local taxes, they will pay for them through general taxes. Second, a large share of the grants picked up in the sample may be mostly matching grants that force local users to make
choices they don't care for. Third, a large share of the services provided by decentralized units are not local public goods, and hence grants do not lead to local free riding.
Table 2. Determinants of per capita expenditure on infrastructure in developing countries and in industrial countries (1985 US$)
Developing countries Industrial countries
Determinants 1
Total public Subnational public Total public Subnationdl public expenditure expenditure expenditure expenditure Population density -0.21 -0.19 0.34 0.30 -0.22 -0.22 0.05 -0.13 (-3.12) (-2.71) (3.30) (2.6) (-7.09) (-7.06) (1.76) (-0.37) GDP per capita 0.93 0.90 -1.18 -0.99 0.84 0.84 1.64 1.71 (6.3) (5.69) (4.54) (-3.26) (5.60) (5.50) (10.38) (10.34) Country size -0.24 -0.24 -1.55 -1.43 -0.20 -0.20 0.05 0.03 (-3.0) (-2.8) (-10.92) (-8.77) (-8.08) (-8.14) (1.76) (1.13) Decentralization 0.36 1.30 0.19 0.87 of expenditure (3.38) (7.02) _ (1.82) (7.91) Decentralization 0.28 1.14 0.17 0.69 of revenue (2.64) (6.08) (1.85) (6.76) Imbalance between -0.70 -0.94 -0.49 -1.47 0.31 0.18 -0.89 -1.41 expenditure assigment (-5.85) (-5.11) (-2.55) (-4.48) (1.95) (0.93) (-5.59) (-7.08) and own revenue sources
Grants to subnational -0.42 -0.43 -0.03 -0.03 -0.01 -0.01 -0.02 0.11 governments as a share of (4.33) (4.31) (-2.88) (-2.82) (-0.05) (-0.03) (-2.08) (1.36) subnational expenditure Price index 0.08 0.09 0.13 0.15 0.16 0.16 -0.23 40.25 (2.69) (3.01) (3.18) (3.46) (3.16) (3.13) (4.69) (-4.93) Constant -2.45 -2.47 21.11 18.43 -1.94 -1.89 -8.99 -9.73 _ (-1.76) (-5.69) (8.37) (6.19) (-1.45) (-1.40) (-6.31) (-6.54) Adjusted R2 0.85 0.84 0.89 0.88 0.58 0.58 0.80 0.78 Number of observations 109 109 77 77 174 174 147 147
In addition to the implications of the results for the variables related to
expenditure. The most obvious is the difference in signs for the income per capita and the population density variables. Total expenditure in infrastructure has a positive income elasticity of 0.9, irrespective of how decentralization is measured. In contrast, subnational infrastructure expenditures have a negative income elasticity equal to or greater than one.
The most likely explanation for the difference between total and subnational
expenditure is that the income level is strongly correlated with the degree of efficiency and is hence a proxy for two opposing effects: (i) expenditure requirements from higher production levels reflecting the importance of infrastructure in the production process and (ii) efficiency gains seen in the most successful developing countries. The larger the country's production level, the larger the need for infrastructure expenditure. The larger the income level per capita the more efficient that country is or the least important in relative terms are fixed costs induced by decentralization, at least in this sample. Hence, the more effective is the use of the current infrastructure capacity and the lower the need to increase infrastructure
expenditure. In net terms, as income grows, overall investment requirements in the sector expand more than the gains achieved from efficiency, while the subnational requirements do not have to grow as fast and are able to benefit from the efficiency gains.
Population density also has opposing effects on total and subnational expenditure in developing countries. Congestion tends to be more a local problem than a national problem, and it thus applies mostly to the decnetralized services. At the aggregate level, this variable also picks up the gains from economies of scale in infrastructure. For this sample, these gains are reflected in an elasticity of expenditure with respect to population density of about -0.2. At the local level, as population density increases, the demand for denser road and
communication networks and for the number of connections also increases. This implies higher maintenance costs that may offset, at the local level, the efficiency gains from network externalities. The elasticity of subnational expenditure with respect to population density is about 0.3.
The other aspect of economies of scale, as measured by country size, shows different behavior. The country size variable is much more important for subnational infrastructure expenditure than for total infrastructure expenditure. The larger a country, the larger its provincial units tend to be. The larger the province, the larger the gains from economies of scale in decentralized infrastructure expenditure.
The positive coefficient on the price variable is difficult to explain. The most probably reason is that monetization is an effective way of financing infrastructure in developing countries. A second explanation is related to the evolution of infrastructure service prices. This explanation is more tentative since the price variable used is a very poor proxy for the price of infrastructure relative to other prices. In developing countries, the price of infrastructure is often relatively more controlled than other prices since many are public tariffs, and adjustment lags lead to a deterioration of this relative price. Surprisingly, its effect is somewhat stronger for subnational governments than for the full public sector. In absolute terms, however, it is not very significant. A one dollar increase in prices results
7The industrialized countries sample
The model is less successful in explaining aggregate expenditures in the industrialized countries sample, as suggested by the lower R2. Moreover, some of the variables are not significant. There are however a few interesting results.
Decentralization increases both total and subnational expenditure in infrastructure in industrialized countries. However, it increases the subnational level more than the total level. Moreover, in contrast to what was observed in the developing country sample, the elasticity of subnational expenditure in infrastructure is less than one. In other words, the reranking of expenditure allowed by decentralization leads to a decline in the share of total expenditure allocated to infrastructure.
Imbalances between total revenue and expenditure assignments tend to neutralize the increases in subnational infrastructure expenditure could be increased expenditure
decentralization. It more than offsets the increases from higher revenue decentralization. The impact of imbalances on aggregate expenditure levels in the sector is not significantly different from zero.
The effect of grants as a percentage of the expenditure level is insignificant,
irrespective of the way decentralization is measured. This may be due to a multicollinearity problem between the imbalance and grant variables, suggesting that the role of grants in industrialized countries is more one of addressing a mismatch between revenue and
expenditure assignments. For the developing country sample, the variable was significant, suggesting a more proactive role in sector-specific resource allocation.
Population density has no role in explaining subnational expenditures in this sample. One explanation may be that congestion is better priced in industrialized countries. For instance, while the population coverage for phone services is still low in many European countries, the markup built in the phone charges is often a rationing scheme to reduce excess effective demand for the service in spite of high potential demand. Another explanation may be that the stocks of infrastructure are so large that the focus in industrialized countries is more on low-cost maintenance than on costly increases in investment to expand coverage.
The elasticity with respect to the price level is positive for total infrastructure expenditure, but negative for subnational expenditure. This suggests that over the last twenty-tw years, the inflation tax tended to penalize subnational governments but benefitted the general government. Economies of scale due to population density or country size reduce the total level of expenditure but have little effect on subnational expenditure levels.
Comparing developing and industrialized countries
A comparison across country groups is also useful (Table 2). Elements of the determinants of total public infrastructure expenditures in developing and industrialized countries, both economies of scale variables (population density and country size) have a similar intensity across country groups. Also, the effect of income level is similar. But there are also some clear differences. First, an increase in the degree of decentralization results in larger increases in infrastructure expenditure in developing countries than in
industrialized countries. Second, the imbalance between revenue and expenditure assignment has a strong and significant negative impact on the total level of infrastructure expenditure in
developing countries. It has an insignificant or more modest effect in industrialized
countries, depending on how decentralization is measured. Third, grants have a significant negative impact in developing countries while they have no effect in industrialized countries. Fourth, the price level has a much stronger positive effect on the level of infrastructure expenditure in industrialized countries than in developing countries.
With respect to the level of subnational infrastructure expenditures, there are only two roughly common elements. First, the degree of imbalance between revenue and expenditure assignments significantly reduces subnational expenditure in both country groups, and the reduction is much larger when decentralization is measured in terms of revenue than in terms of expenditure. Second, the effect of grants is very small in both country groups. The
conclusion on grants is, however, not very robust since the level of aggregation of the data used impedes a detailed analysis of the importance of grant designs.
There are more differences than similarities between the two country groups.
Economies of scale and congestion matter in developing countries. They are insignificant or irrelevant to the level of per capita infrastructure expenditure in industrial countries. The large negative impact of country size on the demand for public infrastructure expenditure by subnational governments is in fact very significant, highlighting one of the potential costs of excessive decentralization in countries often pressed by limits on fiscal resources. As income per capita grows, the demand for subnational expenditure grows more than proportionately in industrial countries, while it declines in the same proportion in countries. A higher degree of decentralization increases the level of infrastructure expenditure more than proportionately in developing countries and less than proportionately in industrial countries. Higher prices
increase the level of subnational expenditure in developing countries while they decrease it in industrialized countries.
Policy conclusions
The paper has shown that the behavior of infrastructure expenditure in both developed and developing countries is reasonably well explained by a few factors: proxies for
economies of scale, the level of development of the country, the degree of decentralization of fiscal resources or responsibilities, the price level, the imbalance between revenue and
expenditure assignment and the extent to which grants correct that imbalance. While the model has better explanatory power for subnational expenditure than for total expenditure, its overall relevance is sufficient to make a few key policy conclusions.
The most obvious conclusion is to be careful when applying lessons learned from the experience of decentralization in industrialized countries to less developed countries. What happens in industrialized countries may help explain the impact of decentralization in
developing countries for total expenditures because the elasticity of per capita infrastructure expenditure with respect to the degree of decentralziation is roughly similar in both country groups (about .3 in developing countries and about .2 in industrialized countries). But it does not provide a good leading indicator for subnational expenditures. The elasticity is larger than I in developing countries (between 1. 1 and 1.3 depending on how
decentralization is measured) and less than one in industrialized countries (between .7 and
Second, decentralization tends to increase both aggregate and subnational
infrastructure expenditure. This suggests that infrastructure expenditures are not neutral with respect to decentralization and that a reranking of expenditures may occur. This is,
however, only a weak test of the reranking assumption and more work needs to be done to test for the impact of decentralization on other expenditure categories.
Third, the sector-specific results confirm the conventinal wisdom that policymakers in industrialized or developing countries, must guarantee a balance between revenue and the expenditure assignment for decentralization. In contrast, a good instrument to offset the impact of decentralization on expenditure levels is to increase the imbalance between revenue and expenditure assignments.
Data appendix
All data are from the IMF Government Finance Statistics or the IMF International Finance Statistics, except for data on areas that appeared in previous World Developmet Reports. The time coverage is from 1970-92, for twenty countries (ten developing and ten industrialized) including Argentina, Australia, Austria, Canada, Chile, Czechoslovakia, Denmark, France, Germany, Hungary, Iceland, India, Indonesia, Israel, Romania,
Switzerland, Thailand, United Kingdom, United States, and Zimbabwe. For subnational government data, the sum of state and local govemment figures were used where available and applicable. Otherwise, the data are either state or local govemment. The other data are consolidated central government figures. The general government (total) has been defined as the sum of these three (or two, when only two levels exist) levels of govemment.
Infrastructure expenditures include expenditures on energy and fuel and transport and communications only. All expenditures include transfers. Except for ratios, figures have been converted to constant U.S. dollars using GDP deflators and exchange rates (1985 values only). All regressions are in natural logarithm. Because some of Argentina's data
(particularly highly volatile exchange rates and multiple changes in exchange rate regimes) were unreliable, it was dropped from our econometric analysis.
Data availability by country. level of government and year
Country Government level Year
Argentina Central 1978-89 State 1978-87 Australia Central 1970-91 State 1970-91 Local 1970-91 Austria Central 1970-91 State 1970-91 Canada Central 1971-89 State 1971-89 Local 1971-89 Chile Central 1972-88 Local 1974-88 Czechoslovakia Central 1989-90 Local 1989-90 Denmark Central 1970-90 Local 1970-90 France Central 1972-91 Local 1972-91 Germany Central 1970-91 State 1970-91 Local 1970-91 Hungary Central 1981-90 Local 1981-90 Iceland Central 1972-86 Local 1972-86 India Central 1974-88 State 1974-88
Indonesia Central 1975-90 State 1975-90 Israel Central 1974-89 Local 1974-89 Romania Central 1970-91 Local 1970-91 Switzerland Central 1970-84 State 1970-84 Local 1970-84 Thailand Central 1972-92 Local 1972-92
United Kingdom Central 1973-90
Local 1973-90
United States Central 1972-90
Stute 1972-90
Local 1972-90
Zimbabwe Central 1976-86
Bahl, R., and J. Linn. 1992. Urban Public Finance in Developing Countries. New York: Oxford University Press.
Baumol, W.J., and J.G. Sidak. 1993. Toward Competition in Local Telephony. AEI Studies in Telecommunications, Cambridge: The MIT Press.
Besant-Jones, John, ed. 1993. "Reforming the Policies for Electric Power in Developing Countries." World Bank, Industry and Energy Department, Washington, D.C. Bird, Richard. 1994. "Decentralizing Infrastructure: For Good or for Ill?" World Bank
Policy Research Working Paper 1258, Washington, D.C.
Brennan, G., and J.M. Buchanan. 1980. Th7e Power to Tax: Analytical Foundations of a
Fiscal Constitution, New York: Cambridge University Press.
Dillinger, W 1994. "Decentralization and its Implications for Urban Service Delivery." World Bank Urban Management Programme Discussion Paper 16, Washington, D.C. Easterly, William, and Rebelo. 1993. "Fiscal Policy and Economic Growth: An Empirical
Investigation." Journal of Monetary Economics 32 (2): 417-58.
Estache, Antonio and Frannie Humplick. 1994. "Does Decentralization Improve Efficiency in Infrastructure?" World Bank, Washington, D.C.
European Economy. 1994. No 53 Stable Money-Sound Finances
Heil, J.B. 1991. "The Search for Leviathan Revisited." Public Finance Quarterly July, pp.334-46.
Humplick, Frannie. 1992. "Private Ownership, Competition and Decentralization: Impacts on Infrastructure Performance." World Bank, Washington, D.C.
Oates, W.E. 1972. Fiscal Federalism. New York: Harcourt Brace Jovanovich.
Oates, W.E. 1985. "Searching for Leviathan: An Empirical Study." Amenican Economic Review, September, pp.748-57.
Oates, W.E. 1989. "Fiscal Decentralization and the Size of the Public Sector: Some Further Reflections." American Economic Review, pp579-83.
Oates, W.E. 1991. "Public Finance with Several Levels of Government: Theories and Reflections." Working Paper No. 90-20, University of Maryland, College Park, Maryland.
Oates, W.E. (1993), "Fiscal Decentralization and Economic Development", Working Paper No. 93-4, University of Maryland, College Park, Maryland.
Owens, J., and J. Nooregaard. 1991. "The Role of Lower Levels of Govemment: The Experience of Selected OECD countries." in J. Owens and G. Panella, eds., Local
Government: An International Perspective. Amsterdam: North Holland.
Prud'homme, R. 1994. "Decentralization in Madagascar", World Bank, Washington, D.C. Saunders. 1988. "Explaining International Differences in Public Expenditure: An Empirical
Study." Public Finance 43(2):271-94.
Contact
Title Author Date for paper
WPS1437 Travel Mode Substitution in Sao Joffre Swait March 1995 C. Jones Paulo: Estimates and Implications Gunnar S. Eskeland 37699 for Air Pollution Control
WPS1438 Trade Reform, Efficiency, and Growth Ejaz Ghani March 1995 A. Nokhostin
Carl Jayarajah 34150
WPS1439 Nontariff Barriers Africa Faces: What Azita Amjadi March 1995 S. Lipscomb
Did the Uruguay Round Accomplish, Alexander Yeats 33718
and What Remains to Be Done?
WPS1440 Poverty and Social Transfers in Christiaan Grootaert March 1995 N. Sachdeva
Poland 82717
WPS1441 The Significance of Credits and Douglas Galbi March 1995 N. Castillo
Subsidies in Russian Agricultural 33490
Reform
WPS1442 Energy Price Increases in Einar Hope March 1995 C. Jones
Developing Countries: Case Studies Balbir Singh 37699
of Colombia, Ghana, Indonesia, Malaysia, Turkey, and Zimbabwe
WPS1443 Policy-Based Finance, Financial Dimitri Vittas April 1995 P. Infante
Regulation, and Financial Sector Akihiko Kawaura 37642
Development in Japan
WPS1444 Roads, Lands, Markets, and Kenneth M. Chomitz April 1995 E. Schaper
Deforestation: A Spatial Model David A. Gray 33457
of Land Use in Belize
WPS1445 Human Capital and Industry Wage Chris N. Sakellariou April 1995 I. Conachy
Structure in Guatemala 33669
WPS1446 Review of Integrated Approaches Donna J. Lee April 1995 C. Spooner
to River Basin Planning, Ariel Dinar 32116
Development, and Management
WPS1447 Environmental Inspections and Benoit Laplante April 1995 E. Schaper
Emissions of the Pulp and Paper Paul Rilstone 33457
Industry: The Case of Quebec
WPS1448 Environmental Regulation and Susmita Dasgupta April 1995 E. Schaper
Development: A Cross-Country Ashoka Mody 33457
Empirical Analysis Subhendu Roy
David Wheeler
WPS1449 Worker Displacement during the Peter Orazem April 1995 J. Prochnow-Walke
Transition: Experience from 37466
Contact
Title Author Date for paper
WPS1450 Social Safety Net and the Poor Fareed M. A. Hassan May 1995 F. Smith
during the Transition: The Case of R. Kyle Peters, Jr. 36072
Bulgaria
WPS1451 Tunisia's Insurance Sector Dimitri Viftas May 1995 P. Infante
37642
WPS1452 The 1985-94 Global Real Estate Bertrand Renaud May 1995 R. Garner
Cycle: Its Causes and Consequences 37670
WPS1453 Air Pollution and Mortality: Results Bart Ostro May 1995 C. Bernardo
from Santiago, Chile Jose Miguel Sanchez 37699
Carlos Aranda Gunnar S. Eskeland
WPS1 454 Child Labor: A Review Christiaan Grootaert May 1995 M. Youssef
Ravi Kanbur 34614
WPS1455 Tentative First Steps: An Assessment Bernard Hoekman May 1995 F. Hatab
of the Uruguay Round Agreement 35835
on Services
WPS1456 Equity Markets, Transaction Costs, Valerie R. Bencivenga May 1995 P. Sintim-Aboagye
and Capital Accumulation: An Bruce D. Smith 38526
Illustration Ross M. Starr
WPS1457 Does Decentralization Increase Antonio Estache May 1995 WDR