Effect of nanoadditives on ionic conductivity of solid polymer electrolyte
Arup Deya,S Karanb & S K Dec* a
Garh Raipur High School, Raipur, Bankura 722 134
b
Department of Physics, Narula Institute of Technology, 81 Nilgunj Road, Agarpara, Kolkata 700 109
c
Department of Materials Science, Indian Association for the Cultivation of Science, Jadavpur, Kolkata 700 032 *E-mail: msskd @iacs.res.in
Received 10 January 2013; revised 21 February 2013; accepted 6 March 2013
Solid composite polymer electrolytes consisting of high molecular weight polyethylene oxide (PEO) with potassium iodide (KI) and sodium perchlorate (NaClO4) as electrolyte salts and cerium oxide (CeO2) and zirconium oxide (ZrO2)
nanoparticles, respectively, as fillers have been prepared by standard solution cast technique. In the present work, PEO15-KI-CeO2 electrolytes have been prepared over a range of CeO2 content with particle size ~10 nm, whereas
PEO25-NaClO4-ZrO2 electrolytes have been synthesized with various particle sizes of nano ZrO2 keeping the concentration
constant to investigate the effect on the ionic conductivity.
Keywords: Polymer electrolyte, Nanocomposite, Thermal properties, Ionic conductivity
1 Introduction
Ionically conducting polymer composites are important materials both from fundamental studies as well as practical applications in high energy density solid-state batteries, supercapacitors, fuel cell, smart windows, sensors and electrochemical devices etc1-4. The polymer-salt complexes, prepared by complexing polar polymer, particularly PEO, having high molecular weight and electron-rich heteroatom in its backbone with alkali metal salts namely, LiClO4,
NaClO4, NH4ClO4, KI etc., provide sufficiently high
ionic conductivity5-10. Ion transport occurs through amorphous region assisted by the segmental motion of the polymer chain. High concentration of crystalline phase in pure PEO impedes the ionic conductivity. Increasing salt concentration, high levels ionic conductivity can be achieved but the major drawback of these polymer electrolytes is poor mechanical strength and potential stability.
Most of the recent research efforts to improve the room temperature conductivity without the fall of mechanical and potential stability have been directed towards the addition of nanoscale ceramic fillers such as SiO2, Al2O3, TiO2, and CeO2 into PEO based
polymer electrolytes2,11-17. A well accepted formation mechanism of composite polymer electrolytes is the Lewis acid-base reaction between the ceramic filler and the polymer18,19. According to this mechanism, the interaction of Lewis acid sites on the surface of nanopartcles with base centers of ether oxygen in PEO leads to the formation of complex. The dispersed
ceramic filler influences the recrystallization kinetics of the PEO polymer chains and ultimately establishes structural modification by promoting local amorphous phase within the polymer host. In addition, the Lewis acid-base type surface groups of filler interact with cations and anions and provide additional sites creating favourable high conducting pathways in the vicinity of filler grains for the migration of ions20,21. The particle size of the filler is also expected to have a wide influence on the ionic conductivity of the composite polymer electrolytes. The conductivity increases with decrease in particle size, i.e., increasing specific surface area of the ceramic fillers. This may be due to stronger Lewis acid-base type interactions which enhance the dissociation of the supporting salt in the composite polymer electrolyte. However, the mechanism of ionic conductivity enhancement and the role played by the nanosized ceramic fillers are still not well understood.
In the present work, the concentration-effect of CeO2 nanoparticles in PEO15-KI system and the
size-effect of ZrO2 nanoparticles in PEO25-NaClO4 system
to improve the structural, morphological, thermal properties and ionic conductivity of these polymer electrolytes, have been reported.
2 Experimental Details
2.1 Preparation of CeO2
Cerium oxide (CeO2) powder was prepared by a
citrate-nitrate autoignition process in which aqueous solution of ceric ammonium nitrate (NH4)2[Ce(NO3)6]
was mixed with an aqueous solution of citric acid maintaining a constant citrate to nitrate ratio (C/N). The mixed solution was allowed to evaporate at a fixed temperature (~ 200°C) with continuous stirring. The mixed solution first became viscous and turned into gel during heating. Then the gel slowly foamed, swelled and finally burnt to produce yellow-coloured CeO2 powder. The powder was calcined at 200°C for
2 h and the average particle size was about 10 nm.
2.2 Preparation of ZrO2
The nanosize zirconia was prepared using zirconium oxychloride octahydrate [ZrOCl2, 8H2O]
and NaOH by solvothermal process. For this, a closed cylindrical Teflon lined stainless steel chamber with a 50 ml capacity was taken. All the reagents and solvents were of analytical grade and used without any further purification. In a typical preparation process, 0.01 M zirconium oxychloride octahydrate [ZrOCl2, 8H2O] was added to 0.05 M aqueous NaOH
solution at room temperature and stirred for 20 min. A white precipitate was appeared, washed and dried at room temperature. The precipitate was then taken in a Teflon chamber filled to its 80% volume with ethanol. After 10 min of stirring the closed chamber was placed inside a preheated box furnace at desired temperature for 12 h. To calibrate the size of the nanostructures the experiment was performed at different synthesis temperatures such as 100°, 120°, 140° and 160°C. The precipitate was collected, washed with water and ethanol several times and dried in air at ambient temperature.
2.3 Preparation of PEO-based polymer electrolyte
The solvent casting technique was used to prepare PEO15-KI and nanosize CeO2 doped composite
polymer electrolyte films using methanol as the common solvent. Methanolic solution of PEO (Mw=106) and KI with the required wt.% ratio was first thoroughly mixed and stirred using a magnetic stirrer at room temperature. When the bubbles disappeared and the polymeric solution became viscous, CeO2 was added in estimated amount and
mixed with continuous stirring. The resulting homogeneous solution was poured into polypropylene Petri dish and vacuum dried at 50°C for 48 h to remove all traces of solvent. The thin films were preserved in vacuum desiccators.
For the preparation of PEO25-NaClO4 and ZrO2
added composite polymer electrolyte films, the same process was applied using the same solvent. The molar ratio in PEO-NaClO4 polymer salt complex was
25:1. PEO and NaClO4 were dried under vacuum at
50°C and 120°C, respectively, for 48 h before use. Prepared ZrO2 nanometric powder with four different
particle sizes were also vacuum dried at 120°C for 24 h prior to use.
X-ray diffraction patterns of the polymeric systems were recorded by X’Pert PRO Panalytical X-ray diffractometer in the range 15-65° using CuKĮ
radiation. The thermal behaviour of the electrolyte films was studied utilizing Perkin Elmer Diamond DSC in a temperature range-50°-100°C with a scan rate of 10°C/min under a constant flow (100 ml/min) of nitrogen gas to avoid any contact of atmospheric moisture. Pure indium was used for temperature and enthalpy calibration of the instrument. The Fourier transform infrared (FTIR) spectra were obtained by a computer interfaced Shimadzu FTIR-8300 spectrometer in the frequency range 2000-500 cm−1.
Ionic conductivity was measured using the ac
impedance techniques with Agilent 4192A frequency response impedance analyzer, where the electrolyte films were sandwiched between two polished stainless steel blocking electrodes. Temperature was monitored by Eurotherm temperature controller (Model No. 2404) using thermocouple sensor.
3 Results and Discussion
3.1 The concentration-effect of CeO2 nanoparticles in PEO15
-KI system
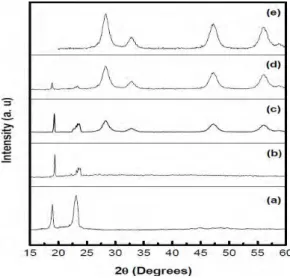
X-ray diffraction patterns of pure PEO, PEO15-KI,
PEO15-KI-CeO2 nanocomposites and pure CeO2 are
shown in Fig. 1. In Fig. 1(a), characteristic crystalline peaks of PEO are observed at 2ș = 19.13 and 23.30°
Fig. 1 — X-ray diffraction patterns of (a) pure PEO; (b) PEO15-KI
and (c) 8 wt.% CeO2; (d) 25 wt.% CeO2 of PEO15-KI-CeO2
which are assigned to (120) and (112) planes, respectively. These peaks for PEO15-KI displayed in
Fig. 1(b), become less intense compared to pure PEO. The intensity of the peak at smaller angle is higher than that of larger angle. This indicates the decrease in degree of crystallinity and complexation of PEO with KI salt. Interaction between the K+ ions and ether oxygen of PEO chains disrupts the previous ordered arrangements of the PEO chains, resulting in the reduction of crystallinity. XRD patterns of composite polymer electrolytes are shown in Fig. 1(c and d), respectively. It is found that four additional peaks appear at 2ș = 28.4, 32.9, 47.3 and 56.18° in the CeO2
added composite polymer electrolytes. These are attributed to (111), (200), (220) and (311) planes of cubic calcium fluorite structure of CeO2 [Fig. 1(e)],
respectively. It is also observed that with the increase in the content of filler the intensity of peaks corresponding to CeO2 increases. The crystallite size
of the nanofillers is estimated by Scherrer formula22. The initial size of CeO2 is found to be approximately
10 nm. The size of CeO2 does not vary with increase
of concentration.
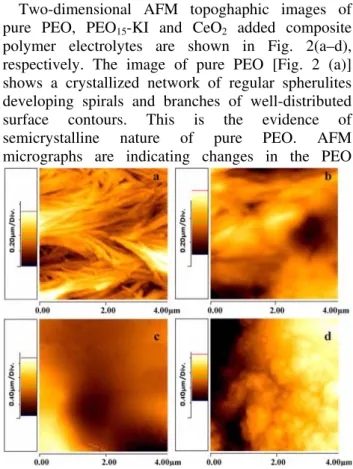
Two-dimensional AFM topoghaphic images of pure PEO, PEO15-KI and CeO2 added composite
polymer electrolytes are shown in Fig. 2(a–d), respectively. The image of pure PEO [Fig. 2 (a)] shows a crystallized network of regular spherulites developing spirals and branches of well-distributed surface contours. This is the evidence of semicrystalline nature of pure PEO. AFM micrographs are indicating changes in the PEO
surface morphology with the addition of KI salt as shown in Fig. 2(b). Interaction of KI salt with the PEO destroys the regular crystallized network and reduces the degree crystallinity of the polymer complex remarkably. Introduction of the CeO2
nanoparticles into the polymer matrix produces drastic morphological changes to the host polymer electrolyte. When 20 wt.% of CeO2 nanoparticles are
added, the composite polymer electrolyte exhibits almost a flat surface as shown in Fig. 2(c). In contrast, Fig. 2(d) shows the development of granular morphology when the value of CeO2 content in the
composite polymer electrolyte reaches 25 wt.%. This structural modification promotes different crystallization behaviour in the polymer electrolyte system. AFM pictures suggest that the insertion of CeO2 produces different morphologies of the
composite polymer electrolytes. The favourable microstructure provides conducting path way for the ions at the surface of CeO2 which can improve the
ionic conductivity.
Figure 3 shows the typical differential scanning calorimetric traces of pure PEO, PEO15-KI and
different PEO15-KI-CeO2 systems. Fig. 3 shows that
the endothermic peak of PEO is broadened and the peak height decreases with the inclusion of KI and CeO2 into the polymer matrix. Different thermal
parameters, such as the glass transition temperature (Tg), the melting temperature (Tm), the enthalpy of
melting (Hm) and the degree of crystallinity (Ȥ) are
determined from DSC curves and are listed in Table 1.
Fig. 2 — Two-dimensional AFM topographic images of (a) pure PEO; (b) PEO15-KI and (c) 20 wt.% CeO2; d) 25 wt.% CeO2 of
PEO15-KI-CeO2 composite polymer electrolytes
Fig. 3 — DSC traces of (a) pure PEO; (b) PEO15-KI and
(c) 5 wt.% CeO2; (d) 20 wt.% CeO2; (e) 25 wt.% CeO2 of PEO15
Incorporation of nanofiller CeO2 into PEO15-KI salt
complex does not result in any systematic change in
Tg. The values of Tg are within the range-52.8°-41.8°C
for all the ceria concentrations tested. It is observed that the addition of CeO2 to PEO15-KI complex causes
a random change in Tg. The melting temperature of
pure PEO is found to decrease from ~71°C to ~58°C due to the addition of KI salt as presented in Table 1. At lower concentration of CeO2, Tm also decreases but
it increases with further increase of the filler content. The enthalpy of melting is determined from the area of the melting curve. From Table 1, it is clear that Hm
decreases from 155 to 28.47 J/g in the entire composition range. Percentage of crystallinity is determined by the formula, Ȥ = ǻH/ǻHPEO, where
ǻHPEO = 155 J/g assuming pure PEO as 100%
crystalline. The percentage of crystallinity decreases remarkably from 100 to 27 upon addition of KI and it reaches to the lowest value of 18 for 20 wt.% CeO2
added composite polymer electrolyte. However, further addition of nanofiller enhances the crystallinity as evident from Table 1 for 25 wt.% CeO2 added composite polymer electrolyte.
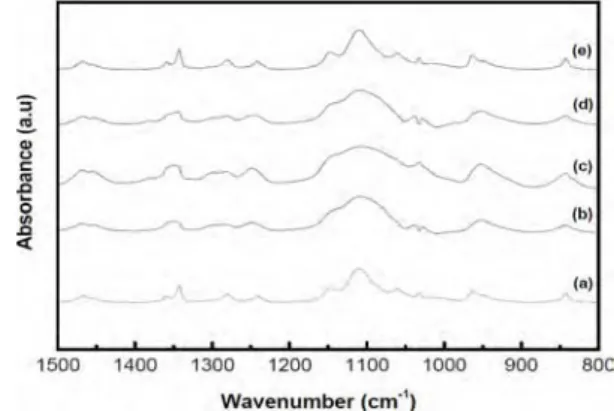
The FTIR spectra of PEO, PEO15-KI and
PEO15-KI-CeO2 are shown in Fig. 4. The absorption
features of pure PEO are shown in Fig. 4(a) in the spectral ranges 800-1000 cm−1 and 1200-1500 cm−1
which are observed due to different vibrational modes of H-C-H bonds. CH2 bending and asymmetric
rocking modes are at 842 cm−1 and 963 cm−1.
Moreover, the bands at 1242 cm−1 and 1281 cm−1 are
attributed to CH2 asymmetric and symmetric twisting
and those at 1342 cm−1 and 1360 cm−1 are ascribed to
CH2 wagging modes, respectively. Peaks at 1455 cm−1
and 1467 cm−1 are ascribed to symmetric and
asymmetric CH2 bending, respectively. As these
bands are very sensitive to macro-molecular conformations, they provide evidence for the presence of crystalline PEO phase. All CH2 bands are
broadened in PEO15-KI complex as shown in Fig.
4(b). Two well-defined peaks at 1342 cm−1 and 1360
cm−1 for pure PEO merge into a wide single peak. For
PEO15-KI-CeO2 samples, the width of the peaks of
CH2 bands changes with the increase of the filler
concentration.
The most interesting result is that the IR band of C-O-C vibration for 25 wt.% of CeO2 doped polymer
electrolyte is almost identical to that of pure PEO. When the concentration of the CeO2 is high enough
both the cations, Ce4+ and K+, are competing against each other to coordinate with ether oxygen of PEO. The hard Lewis acid centers on the surface of CeO2
exhibitstrong interaction with ether oxygen of PEO, even with ether oxygen of solvating K+ ion. This, in turn, reduces the ability of salvation of PEO to KI salt and produces heterogeneous nucleation of PEO on the surface of CeO2 nanoparticles. Thus the CeO2
nanoparticles act as epitaxial centers for the growth of crystalline phase of PEO. This result is consistent with the DSC study of the composite electrolyte at the highest concentration of CeO2. The melting
temperature of crystalline PEO formed in the presence of highest content (25 wt.%) of CeO2 is 59.7°C which
is much lower than that of pure PEO as shown in Table 1. This suggests that the crystalline phase of PEO in nanocomposite is quite different from crystalline nature of pure PEO. Similar behavior in FTIR spectrum with higher concentrations of nanosized ZnO and Al2O3 have also been found
23-25
. Overall, the interactions among the three moieties of PEO, KI and CeO2 are associated with the changes in
intensity, shape and position of these stretching bands. Table 1 — Composition and glass transition temperature (Tg),
melting temperature (Tm), change of enthalpy of melting (Hm)
and percentage of crystalline (Ȥ) of different PEO15-KI-CeO2
composite polymer electrolytes
Sample Tg (°C) Tm (°C) Hm (J/g) ȋ (%) Pure PEO - 71.1 155 100 PEO15-KI −50.2 58.2 41.34 27 PEO15-KI-CeO2 3 wt.% −51.3 56.4 34.76 22 PEO15-KI-CeO2 5 wt.% −52.3 55.0 32.65 21 PEO15-KI-CeO2 8 wt.% −52.5 54.6 33.24 21 PEO15-KI-CeO2 10 wt.% −52.8 54.3 33.62 22 PEO15-KI-CeO2 15 wt.% −48.6 56.3 32.03 21 PEO15-KI-CeO2 20 wt.% −49.4 56.7 28.47 18 PEO15-KI-CeO2 25 wt.% −41.8 59.7 32.87 21
Fig. 4 — FTIR spectra of (a) pure PEO; (b) PEO15-KI and (c) 10
wt.% CeO2; (d) 15 wt.% CeO2; (e) 25 wt.% CeO2 of PEO15
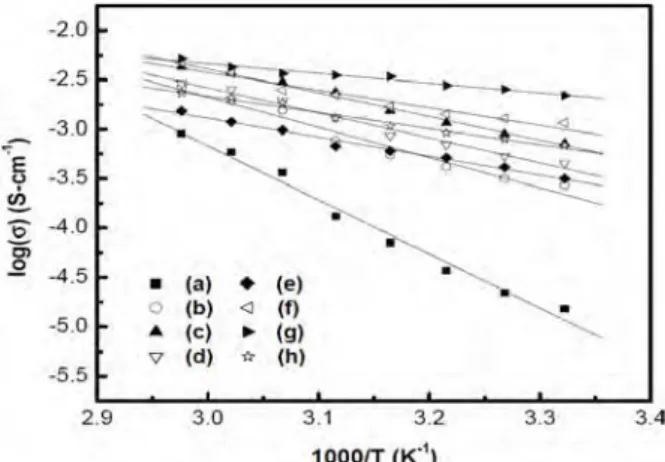
The temperature dependence of ionic conductivity of electrolyte nanocomposites for different concentrations of CeO2 is shown in Fig. 5. The
conductivity curves exhibit positive temperature coefficient within the measured temperature range. The conductivity plots, log(ı) versus 1000/T, show linear behaviour within the studied temperature range. This behaviour is consistent with Arrhenius type charge conduction in polymer electrolyte nanocomposites. The conductivity relationship is given as:
ı = ı0exp(−Ea/kT) …(1)
where ı0 is the pre-exponential factor, Ea is the
activation energy and k is the Boltzmann’s constant. The activation energy of individual sample has been computed from the slope of each straight line and the data are listed in Table 2. The activation energy of composite polymer electrolyte has been reduced considerably than that of polymer-salt complex.
3.1 Size-effect of ZrO2 nanoparticles in PEO25-NaClO4 system All synthesized ZrO2 samples were characterized
by XRD at room temperature to identify the crystal structure. Diffraction peaks of all the samples were indexed to the cubic phase of zirconium oxide having space group Fm3m according to the JCPDS card no. 27-0997. The crystallite size of the sample was determined accurately by fitting the whole XRD pattern employing Rietveld method. The calculated values of the crystallite sizes are 4.5 ± 0.02 nm, 5.6 ± 0.05 nm, 6.4 ± 0.04 nm, and 7.6 ± 0:04 nm synthesized at temperature 100°C, 120°C, 140°C, and 160°C, respectively. XRD studies were carried out for
pure PEO, PEO25-NaClO4, composite polymer
electrolyte films containing 4.5 and 7.6 nm of ZrO2.
Two characteristic peaks at 2ș = 19.1 and 23.5° are assigned to (120) and (112) planes of crystalline PEO as shown in Fig. 6(a). The characteristic peaks of pure PEO for PEO25-NaClO4 complex show variation in
intensity and broadening as shown in Fig. 6(b) suggesting that the ordering of the PEO polymer is disturbed due to coordination interactions between the Na+ ions and ether oxygen ions. In Fig. 6(c–d), the appearance of crystalline peaks of ZrO2 at 2ș = 30, 50
and 60° confirm the incorporation of ZrO2
nanoparticles in PEO25-NaClO4 and the formation of
composite polymer electrolyte. It is also observed that the peak intensity of ZrO2 increases with the increase
in particle size.
The variation of glass transition temperature (Tg),
melting temperature (Tm), change of enthalpy of
melting (ǻH) and percentage of crystalline (Ȥz) of
pure PEO, PEO25-NaClO4 and different composite
polymer electrolytes have been presented in Table 3. The value of Tm decreases drastically nearly to 63°C
from 71°C upon the addition of NaClO4 into the
Fig. 5 — Temperature dependence conductivity plots of (a) PEO15-KI and (b) 3 wt.% CeO2; (c) 5 wt.% CeO2; (d) 8 wt.%
CeO2; (e) 10 wt.% CeO2; (f) 15 wt.% CeO2; (g) 20 wt.% CeO2;
(h) 25 wt.% CeO2 of PEO15-KI-CeO2 composite polymer
electrolytes
Table 2 — Composition and room temperature ionic conductivity (ı) and activation energy (Ea) of different PEO15
-KI-CeO2 composite polymer electrolytes
Sample ı (S-cm−1) E a (eV) PEO15-KI 1.53×10⁻⁵ 0.38 PEO15-KI-CeO2 3 wt.% 2.71×10⁻⁴ 0.21 PEO15-KI-CeO2 5 wt.% 7.19×10⁻⁴ 0.16 PEO15-KI-CeO2 8 wt.% 4.55×10⁻⁴ 0.17 PEO15-KI-CeO2 10 wt.% 3.17×10⁻⁴ 0.13 PEO15-KI-CeO2 15 wt.% 1.16×10⁻³ 0.12 PEO15-KI-CeO2 20 wt.% 2.15×10⁻³ 0.07 PEO15-KI-CeO2 25 wt.% 6.89×10⁻⁴ 0.11
Fig. 6 — X-ray diffraction patterns of (a) pure PEO; (b) PEO25
-NaClO4 and composite polymer electrolyte for (c) 4.5 nm, and (d)
polymer matrix. However, Tm remains invariable after
the nanofiller doping and it is also independent of the particle size of the filler. The value of Tg as presented
in Table 3, is not varying so much which indicates that the cross-linking and hence, mobility is not changing appreciably with doping of ZrO2. The
crystallinity (Ȥz) of the polymer nanocomposites has
been calculated from the area of the melting curve using the formula, Ȥz = ǻH/ǻHPEO, where
ǻHPEO = 213.7 J/g is the melting enthalpy of a
completely crystalline PEO sample26. The value of Ȥz
in the PEO25-NaClO4-ZrO2 system decreases
remarkably with the addition of ZrO2. The observed
trend in PEO crystallinity can be explained as the Lewis acid-base type interaction among polyether matrix, ZrO2 filler, Na
+
cation and ClO−4 anion2,10,27.
The complexation and ion-ion interactions between the various constitutions of PEO25-NaClO4-ZrO2
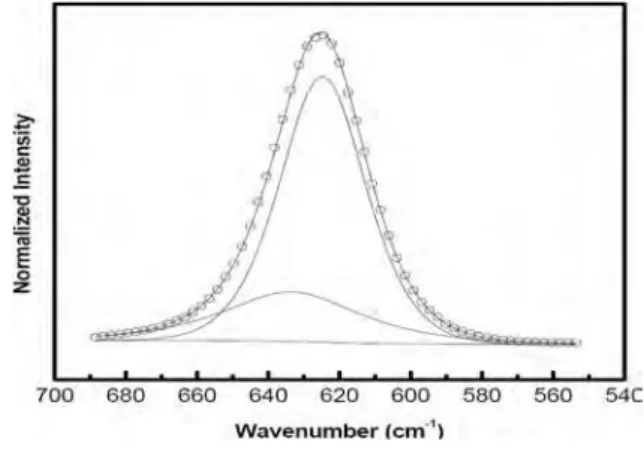
complex have been studied by FTIR spectrum. It is found that a new peak at 625 cm−1 is appeared when
NaClO4 has been added into PEO matrix, which can
be assigned to spectroscopically free Ȟ(ClO−4) anions.
This characteristic peak is also found to exist in all the composite polymer electrolytes. For all the samples, peak maximum of the Ȟ(ClO−4) band in FTIR spectra
has been normalized to unity and fitted to Gaussian-Lorentzian product function with a straight baseline28. Fig. 7 is a typical example of fitted Gaussian-Lorentzian peak to the experimental FTIR data in the Ȟ(ClO−4) region for PEO
25-NaClO4-ZrO2 composite
system with 6.4 nm particle size of ZrO2. It is
observed that the Ȟ(ClO−4) band has been well
separated into two maxima centered at 624 and 633 cm−1. It is suggested that the Ȟ(ClO−4) band within
the ranges 620 and 625 cm−1 can be attributed to
spectroscopically free ClO−4 anions whereas the band
centered between 630 and 635 cm−1 is related to the
contact-ion pairs29,30. The fraction of free ClO−4
anions and Na+-CIO4−contact-ion pairs has been
calculated by taking the ratio of the integral area of each peak to the total area of Ȟ(ClO−4) vibration. It is
found that the value for free anions is much larger than that for contact-ion pairs. The percentage of free anions for PEO25-NaClO4 system is 68 whereas for
composite polymer electrolyte with 5 wt. % ZrO2 of
particle size 4.5 nm, it is found to be 81. For other composite polymer electrolytes with larger particle sizes of ZrO2, however, a slight decrease in the
fraction of free anions has been observed. This result suggests that the strong Lewis acid-base interaction with comparatively larger surface area of ZrO2
nanoparticles favors the dissolution of NaClO4 salt in
the composite polymer electrolyte system and promotes more free Na+ cations.
The variation in ionic conductivity of composite polymer electrolytes as a function of the size of ZrO2
nanofiller at room temperature is shown in Fig. 8. The optimum value of the ionic conductivity is 6.96 × 10⁻⁵
S-cm−1 for 4.5 nm of ZrO
2. The ionic conductivity
Fig. 7 — Peak fitting of FTIR spectra for Ȟ(ClO−4) in composite polymer electrolyte for 6.4 nm size of ZrO2.
Fig. 8 — Conductivity variation plot for different sizes of ZrO2
nanoparticles at room temperature Table 3 — Composition, size and glass transition temperature
(Tg), melting temperature (Tm), change of enthalpy of melting
(ǻH) and percentage of crystalline (Ȥz) of pure PEO, PEO25
-NaClO4 and different composite polymer electrolyte
Sample Size of ZrO2
(nm) Tg (°C) Tm (°C) ǻH (J/g) Ȥz (%) Pure PEO - - 71.10 155 72.53 PEO25-NaClO4 - -37.9 63.51 106 49.61
PEO25-NaClO4-ZrO2 4.5 -36.6 62.83 86 40.24
PEO25-NaClO4-ZrO2 5.6 -36.9 62.14 89 41.65
PEO25-NaClO4-ZrO2 6.4 -37.1 62.32 91 43.05
gradually decreases as the particle size of ZrO2
increases and the lowest value of 4.64 × 10⁻⁶ S-cm−1
is obtained for 7.6 nm particle size. In PEO-salt complex, ion conduction occurs through amorphous regions. The nanosized ZrO2 particles reduce the
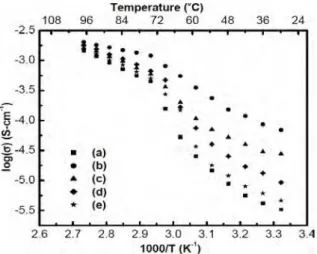
crystallinity of PEO chains resulting in higher conductivity. From Table 3, it is seen that the degree of crystallinity is the lowest for the smallest particle size which gives rise to the highest conductivity. Figure 9 shows the temperature dependence of ionic conductivity of PEO25-NaClO4 and PEO25
-NaClO4-ZrO2 nanocomposites. All the samples show
a discontinuity around Tm of PEO in the temperature
range 55-65°C. However, the degree of this discontinuity in the case of PEO25-NaClO4-ZrO2 is
obviously lower than that in the case of PEO25-NaClO4 suggesting that the addition of ZrO2
can, in part, restrain the recrystallization of PEO in the nanocomposite electrolytes, in accordance with the result obtained from XRD study. The maximum value of the ionic conductivity of PEO25-NaClO4
-ZrO2 is obtained for particle size 4.5 nm of ZrO2 at all
temperatures. This is possibly due to the relatively smaller size of ZrO2 particles as compared to polymer
host molecule which can easily penetrate into the polymer matrix and establish an interaction between ZrO2 and polymer chain molecules. ZrO2 particles
have Lewis acid centers on their surface. The Lewis acid-base interaction of ZrO2 with ether oxygen
creates additional high conducting pathways for migrating ions. In addition, the enhanced surface area of ZrO2 ensures the much stronger Lewis acid-base
interactions between it and PEO chains, and thus a
small amount of ZrO2 can effectively improve the
ionic conductivity of the composite polymer electrolyte. As the number of such surface groups is expected to be proportional to the specific surface area of grains, our results appear to be consistent with this explanation.
The migration of ion depends mainly on the segmental movement of polymer chain in the amorphous region. This type of ionic conduction often obeys empirical Vogel-Tammann-Fulcher (VTF) relation31,
ı(T) =AT−1/2exp[
−EA/k(T−T0)] … (2)
where ı(T) is the total ionic conductivity and A is the pre-exponential constant proportional to number of carriers and T is the absolute temperature. EA is
considered as the apparent activation energy. T0 is the
Vogel temperature or ideal glass transition temperature at which free volume of the polymer tends to zero value. The data above softening temperature for PEO25-NaClO4-ZrO2 was fitted with
the VTF equation, Eq. (2), by means of the usual approach of fitting and the fitted plot is shown in Fig. 10. The best fitted parameters are listed in Table 4. The estimated values of EA increase with
Fig. 9 — Temperature dependent conductivity plots of (a) PEO25
-NaClO4 and composite polymer electrolyte for (b) 4.5 nm;
(c) 5.6 nm; (d) 6.4 nm; and (e) 7.6 nm size of ZrO2 for (b) 4.5 nm;
(c) 5.6 nm; (d) 6.4 nm; and (e) 7.6 nm size of ZrO2
Fig. 10 — Arrhenius plots of the conductivity of (a) PEO25
-NaClO4 and composite polymer electrolyte for (b) 4.5 nm; (c) 5.6
nm; (d) 6.4 nm; and (e) 7.6 nm size of ZrO2 fitted by VTF Eq. (2)
Table 4 — Composition, size and fitted data of Vogel temperature, (T0) and apparent activation energy (EA) of
PEO25-NaClO4 and different composite polymer electrolyte
Sample Size of ZrO2
(nm) T0 (K) EA (eV) PEO25-NaClO4 - 194 0.027
PEO25-NaClO4-ZrO2 4.5 201 0.011
PEO25-NaClO4-ZrO2 5.6 198 0.022
PEO25-NaClO4-ZrO2 6.4 198 0.023
increase of particle size. Comparison between Table 3 and Table 4 shows that the best fitted Vogel temperature T0 is almost 50°C lower than the glass
transition temperature (Tg) for each composition. The
results are consistent with the literature32-34. The close value of T0 with Tg and the presence of good linearity
indicate that the ionic motion is coupled with the segmental motion of PEO chain.
4 Conclusions
The ionic conductivity is remarkably improved by the addition of CeO2 nanoparticles in PEO15-KI
system. The maximum room temperature conductivity, 2.15 × 10⁻³ S-cm−1 has been obtained
for 20 wt.% of CeO2 doped composite polymer
electrolyte. The epitaxial effect of CeO2 nanoparticles
plays important roles to influence the ionic conductivity of composite polymer electrolyte. Different sizes of cubic ZrO2 nanoparticles have also
influence the ionic conductivity. The room temperature ionic conductivity increases with decrease in particle size and the observed highest value of the ionic conductivity is 6.96 × 10⁻⁵ S-cm−1
for 4.5 nm of ZrO2. Temperature dependence of
conductivity above softening temperature follows empirical VTF theory.
References
1 Vaia T J P & Beall G W, Polymer-clay Nanocomposites (Wiley, New York) (2002).
2 Croce F, Appetecchi G B, Persi L & Scrosati B, Nature, 394 (1998) 456-458.
3 Sasikala U, Kumar P N, Rao V V R N & Sharma A K, Int J Engg Sci & Advd Tech, 2 (2012) 722.
4 Singh P K, Nagarale R K, Pandey S P, Rhee H W & Bhattacharya B, Adv Nat Sci: Nanosci Nanotechnol, 2 (2011) 023002.
5 Reiter J, Krejza O & Sedlarikova M, Solar Energy Materials & Solar Cells, 93 (2009) 249.
6 Rajendran S, Babu R S & Sivakumar P, J Membrane Sci, 315 (2008) 67.
7 Bhide A & Hariharan K, Eupn Poly J, 43 (2007) 4253. 8 Zhou S & Fang S, Eupn Poly J, 43 (2007) 3695.
9 Reddy M J, Kumar J S, Rao U V S & Chu, Solid State Ionics, 177 (2006) 253.
10 Kalaignan P, Kang M S & Kang Y S, Solid State Ionics, 177 (2006) 1091.
11 Croce F, Curini R, Martinaelli A, Persi L, Ronci F, Scrosati B & Caminiti R, J Phys Chem B, 103 (1998) 10632. 12 Sun Ji K, Moon H S, Kim J W & Park J W, J Power Sources,
117 (2003) 124.
13 Nan C W, Fan L, Lin Y & Cai Q, Phys Rev Lett, 91 (2003) 266104.
14 Yuan A & Zhao J, Electrochim Acta, 51 (2006) 2454. 15 Morita M, Noborio H, Yoshimoto N & Ishikawa M, Solid
State Ionics, 177 (2006) 715.
16 Wang X L, Mei A, Li M, Lin Y H & Nan C W, J Appl Phys, 102 (2007) 054907.
17 Dey A, Karan S & De S K, Solid State Ionics, 178 (2008) 1963.
18 Croce F, Persi L, Scrosati B, Serraino-Fiory F, Plichta E & Hendrickson M A, Electrochim Acta, 46 (2001) 2457. 19 Chung S H, Wang Y, Persi L, Croce F, Greenbaum S G,
Scrosati B & Plichta E, J Power Sources, 97 (2001) 644. 20 Marcinek M, Bac A, Lipka P, Zaleska A, Zukowska G,
Borkowska R & Wieczorek W, J Phys Chem B, 104 (2000) 11088.
21 Wieczorek W, Florjanczyk Z & Stevens J R, Electrochim Acta, 40 (1995) 2251.
22 Guinier A, X-Ray Diffraction in Crystals, Imperfect Crystals and Amorphous Bodies (Dover Publications, New York) (1994).
23 Zhang H, Wang J, Zheng H, Zhau K & Zhau Y, J Phys Chem B, 109 (2005) 2610.
24 Strawwhecker K & Manias E, Chem Mater, 15 (2003) 844. 25 Wieczorek W, Zaleswska A, Raducha D, Florjanczyk Z &
Stevens J R, J Phys Chem B, 102 (1998) 352. 26 J Xi and X Tang, Chem Phys Lett, 393 (2004) 271.
27 Ibrahim S, Md R Johan, Int J Electrochem Sci, 7 (2012) 2596.
28 Irish D E, Tang S Y, Talts H & Petrucci S, J Phys Chem, 83 (1979) 3268.
29 Salomon M, Xu M Z, Eyring E M & Petrucci S, J Phys Chem, 98 (1994) 8234.
30 Wieczorek W, Zalewska A, Raducha D, Florjanczyk Z, & Stevens J R, J Phys Chem B, 102 (1998) 8725.
31 Ratner M A, Polymer Electrolyte Reviews, edited by J R Mac-Callum & C A Vincent, Elsevier, London, 1, (1989). 32 Wright P V, Electrochim Acta, 43 (1998) 1137.
33 Gray F M, Polymer Electrolytes, RSC Materials Monographs, The Royal Society of Chemistry, Information Services, UK, Letchworth, (1997).