AUTHOR(S):
TITLE:
YEAR:
Publisher citation:
OpenAIR citation:
Publisher copyright statement:
OpenAIR takedown statement:
This publication is made freely available under ________ open access.
This is the ___________________ version of proceedings originally published by _____________________________
and presented at ________________________________________________________________________________
(ISBN __________________; eISBN __________________; ISSN __________).
This publication is distributed under a CC ____________ license. ____________________________________________________
Section 6 of the “Repository policy for OpenAIR @ RGU” (available from
http://www.rgu.ac.uk/staff-and-current-students/library/library-policies/repository-policies
) provides guidance on the criteria under which RGU will
consider withdrawing material from OpenAIR. If you believe that this item is subject to any of these criteria, or for
any other reason should not be held on OpenAIR, then please contact
[email protected]
with the details of
the item and the nature of your complaint.
GREEN
AZIZ, N.F.A., RAHMAT, N.A., MUHAMMAD-SUKKI, F., RAHMAN, T.K.A., YASSIN, Z.M.,
WAHAB, N.A. and SALIM, N.A.
A new weak area identification method in power system based on voltage stability.
2017
AZIZ, N.F.A., RAHMAT, N.A., MUHAMMAD-SUKKI, F., RAHMAN, T.K.A., YASSIN, Z.M., WAHAB, N.A.
and SALIM, N.A. 2017. A new weak area identification method in power system based on voltage
stability. Presented at the Professional and Continuing Education Center (PACE) international
conference on science and technology 2017 (PICOST 2017), 25-27 July 2017, Penang, Malaysia.
AZIZ, N.F.A., RAHMAT, N.A., MUHAMMAD-SUKKI, F., RAHMAN, T.K.A., YASSIN, Z.M., WAHAB, N.A. and SALIM, N.A. 2017. A new weak area identification method in power system based on voltage stability. Presented at the Professional and Continuing Education Center (PACE) international conference on science and technology 2017 (PICOST 2017), 25-27 July 2017, Penang, Malaysia. Held on OpenAIR [online]. Available from: https://openair.rgu.ac.ukAUTHOR ACCEPTED
PACE (ORGANISERS)Professional and Continuing Education Center (PACE) international conference on science and technology 2017 (PICOST 2017), 25-27 July 2017, Penang, Malaysia.
BY-NC 4.0 https://creativecommons.org/licenses/by-nc/4.0
https://mirrors.creativecommons.org/presskit/buttons/88x31/png/by-nc.png[10/10/2017 09:37:50]
OpenAIR at RGUDigitally signed by OpenAIR at RGU DN: cn=OpenAIR at RGU, o=Robert Gordon University, ou=Library, [email protected], c=GB Date: 2018.01.16 12:50:58 Z
A New Weak Area Identification Method in Power
System Based on Voltage Stability
Nur Fadilah Ab Aziz
1, Nur Azammudin Rahmat
1, Firdaus Muhammad-Sukki
2, Titik Khawa Abdul Rahman
3, Zuhaila
Mat Yassin4
4, Norfishah A. Wahab
4, Nur Ashida Salim
41Institute of Power Engineering, Electrical Power Department, College of Engineering, Universiti Tenaga Nasional, Malaysia.
2 School of Engineering, Robert Gordon University, Scotland, United Kingdom.
3 King Abdul Aziz University, Saudi Arabia.
4 Universiti Teknologi Mara Shah Alam, Malaysia.
Abstract— Identification of voltage stability weak area in
power system plays an important role in preventing the occurrence of voltage collapse. A fast and accurate identification method helps power system operators to apply voltage stability control action on the weak area and thus avoids voltage collapse. This paper presents a new technique for weak area identification in a power system based on voltage stability named as Weak Area Indicator (WAI). WAI is derived from a newly developed voltage stability index, Voltage Stability Condition Indicator (VSCI). For verification purpose, the proposed WAI was tested with the existing method in the literature that used voltage stability variation method to detect weak area. Test results show that the proposed WAI is able to cluster weak areas correctly. All methods were tested on IEEE 30-bus and IEEE 118-bus test system.
Index Terms—Voltage Collapse, Voltage Stability, Voltage
Stability Index, Weak Area.
I. INTRODUCTION
Voltage collapse is the result of a series of voltage instability which can eventually lead to a power blackout [1]. It has been agreed that the voltage instability problems start locally at the weakest bus, spread to the neighboring buses, and progressively extend to the overall system [2, 3]. By considering a large power system network that can be grouped into a smaller sub network, weak area can be identified.
The weak area contains the weakest bus and the load buses that are strongly connected to it where these buses have similar voltage behavior patterns [2, 3]. These buses are prone to voltage instability at a certain operating condition of the power system. By having such information early, the system operators will be able to focus and take some preventive actions more efficiently to the area. These preventive actions include load shedding, reactive power compensation, and active or reactive power control [4]. As a result, the stability of the power system network can be sustained.
In additional, the computational speed of many applications on the power system is proportional to the size of the power system network. For that reason, identification of weak area may also reduce the computation burden since amounts of information that must be analysed in short time intervals have been reduced.
Several methods for weak area identification have been reported in the literature. In reference [3], weak area clustering is referred to as a network partitioning. In this reference, a network partitioning is proposed based on the voltage variations at the critical bus in relation to a load variation at the other load buses. The loads variation considered are both active and reactive power load. The weakest bus is first identified by using the determinant of the inverse Jacobian matrix of the load flow. The network partitioning is then conducted by using the determinant, Gil of the inverse matrix M. Matrix M is the reduced load flow Jacobian matrix of the critical bus that relates the phase angle and voltage level variation at the critical bus with a load variation at another load bus. If the value of the determinant, Gil is greater than a specified value k, bus i is considered to be strongly connected to the critical bus and hence belongs to the weak area. Different operating points may lead to a different network partitioning since each operating points may be associated to different value of k.
T. K. Abdul Rahman had proposed another weak area clustering method using the variation method [5]. The critical area is identified by using voltage stability variation where two sensitive indicators are created from the developed voltage stability index, L. The two sensitive indicators are the variation of the Index L at the critical bus i with respect to the active and reactive load variations at another bus j, ∂Li/∂Pj and ∂Li/∂Qj. The greater value between the two indicators is chosen to be normalised by using their respective change in the index L over change in active or reactive load at the critical bus, ∂Li/∂Pi and ∂Li/∂Qi. The normalised values are then ranked in descending order. The load buses with the sensitive index is larger than the cut-off value are clustered into the critical area. The different between this method and the previous method is that the voltage stability index variation is used instead of the voltage variation. The cut-off values for both methods are determined by the coherency in the change in voltage magnitude and phase angle of the load buses between the base case and the loaded condition. There are only two areas, stable and unstable areas.
Weak area clusters can also be formed by using line stability index. Musirin had developed a line stability index called FVSI [6], and introduced a method for weak area
clustering identification [7]. In this study, weak area clustering is developed based on the sensitive lines deduced from the voltage stability analysis that integrates the results from two separate methods. The first method is from the elimination of the weak lines. An automatic line outage contingency ranking is performed in order to identify the weak lines. FVSI values for each line outage are calculated in which the values are ranked in descending order. From the ranking, line clusters that contain weak lines are identified. The second method identifies the weak lines by applying voltage stability analysis by using FVSI. The severity of the lines is determined by calculating FVSI value. A cut-off value of FVSI is set as a threshold value to form the sensitive line clusters. The resemblances between the clusters developed by sensitive lines and critical line outages are realized in order to form resultant clusters which are the weak area clusters. This technique also has only two weak area clusters, stable and non-stable area.
In the literature, formation of voltage control area (VCA) is another method that produces few weak area groups for large-scale power systems. VCA presented in [8] uses the full Newton Raphson load flow Jacobian sensitivities along with voltage variations under several different contingencies. The proposed method studies the effect of P-V and Q-∂ coupling and changes in network topology. The elimination of weaker off-diagonal terms of the normalised Jacobian sub matrices is employed for weak areas clustering. To determine VCAs that valid for both the system intact and contingency cases, the formed bus clusters are modified by observing the voltage variations of the load buses due to occurrence of the contingencies. The coherency in the voltage variation is another indication exploited in this research to reform a new weak area cluster. In order to employ fast voltage stability assessment effectively, each of the voltage control areas developed by the proposed method is reduced to equivalent nodes by a network reduction technique, REI reduction technique. In reference [9], the author employs the electrical distance between nodes and the decision tree algorithm to obtain the VCA and the required reserves from a given system condition. Meanwhile in reference [10], clustering algorithm is used to determine the VCA.
On the other hand, Wan et al. has presented a neural network (ANN) based method for voltage weak area identification [11]. In this study, the application of Kohonen’s self-organizing neural network is introduced. From the Kohonen network, different buses can be efficiently grouped to the corresponding positions on the output neuron grid under different operating conditions. The unsupervised neural network is able to classify the weak region which consists of several buses for different operating condition. The accuracy of the feature extraction of the Kohonen network is ensured by employing sufficient information of voltage stability as the input data vector. The input data used in this study are the load and the ratio between the voltage difference of a load bus and the sum of the voltage difference for all load buses under a specific loading condition. A large number of operating conditions related to voltage stability are considered. The operating conditions cover variety range of the voltage stability from stable to unstable state. In order to analyse the properties of the developed clusters in the Kohonen output
map, singular value decomposition method is utilized. The weakest operating condition is classified at the right edge of the output and its nearby neurons. The drawback of this method is that it is not independent since the analysis from the singular value decomposition and power flow method are required to describe the properties of the clusters. In reference [12], ANN is used to predict the voltage stability index for weak area identification.
Besides that, there are also several researches on weak area identification in dynamic analysis [13-16]. In reference [13], weak area is identified based on the exposure to voltage sags. The approach takes into account the stochastic nature of power system operation, including load variation, uncertainty of fault clearing time by protection relays, fault rates of network components, and the variation/uncertainty in equipment sensitivity to voltage sags. A new index with respect to voltage sags (bus performance index) is developed to represent the overall bus performance with respect to voltage sags. The weak area is then identified based on the developed index.
Despite of the importance of identifying the weak area in a system, there are only few methods proposed in the literature in which most of them are based on conventional and complicated approaches. Therefore, a new method on identification of weak area named as Weak Area Indicator (WAI) is developed in this research. WAI is derived from a newly developed voltage stability index termed as Voltage Stability Condition Indicator (VSCI). The originality of this method compared to the methods that have been discussed in the literature is that the formulation of WAI is based on the acknowledgement of a critical bus, a bus that may lead the system to voltage collapse. In contrast to other existing methods, the application of WAI takes into account the impact of load increase on the critical bus. The variation in voltage and angle are used as the cut off value to determine the weak area cluster boundary.
II. VOLTAGE STABILITY INDEX
A newly developed voltage stability index named as Voltage Stability Condition Indicator (VSCI) is used to determine the voltage stability state of a system. VSCI is a new bus voltage stability index. It was derived from the current equation in a complex form of a simple 2-bus Thevenin equivalent system.
Looking at the load bus concerned, the equation of current,
I in complex form can be written as,
Th L Th Z V E I (1) Where, ThE = Thevenin voltage or the open circuit voltage at the
bus concerned,
Th
Z = Thevenin impedance or the total equivalent
impedance across the bus,
L
bus,
L
V = voltage at that bus concerned
and
,
,
,and are their corresponding phase angles.By using real and imaginary terms, a quadratic equation as shown below is then formulated:
) ( ) ) sin cos ( 2 ( 2 2 2 2 2 4 Q P Z V E Q P Z VL Th Th L Th (2)
Equation (2) above will only have real root if the discriminant is greater or equal to 0. Therefore, it can be simplified to 1 ) ) sin cos 2 ( ) ( 4 2 2 2 2 2 Th Th Th E Q Z Q P Z VSCI (3)
Where P and Q are the active and reactive load.
III. PROPOSED WEAK AREA IDENTIFICATION METHOD
WAI is formulated based on the concept of voltage stability index margin of the most critical load bus between a specified initial point and identified collapse point. This method studies the effect of the voltage stability at the critical bus when there is a load increase at other load buses. VSCI is used in WAI as the voltage stability condition indicator since it provides a direct relationship between voltage stability and the active and reactive power load and hence is able to deliver a reliable and fast indication of the proximity to voltage collapse. Similar approach was implemented as in reference [17], in which PTSI was used as the indicator of maximum permissible load of a load bus.
WAI is derived based on the effect of load increment at other load buses to the voltage stability condition at the most critical bus in a system. Load buses that give significant changes to the voltage stability condition of the most critical bus are considered to be in the weak area because voltage collapse might occur as a result of reactive power load increase at these load buses. In other words, load buses which resulted in high WAI value are considered to be closely related to the critical bus and included in the same weakest area. Besides that, it has also been confirmed that buses in a cluster behave in a coherent manner [2-3, 5] where the changes in voltage and angle at these buses are about the same for any control action or contingency [2, 3, 5]. Therefore, the changes in voltage and angle are used as a coherency indicator or the cut off value to determine the weak area cluster boundary. All generator buses connected to these buses are considered to belong to the clustered weak area.
To determine the weak area, a voltage stability analysis in a power system by using WAI is conducted. From the analysis, weak boundaries subjected to increase in reactive power loading are identified. In this method, WAI is used to indicate the relation of other load buses and the critical bus in the system as buses that are strongly connected are grouped into one cluster. The algorithm of the proposed method is outlined as follows:
Step 1: Obtain the value of Thevenin voltage magnitude
and angle for each load bus by running load flow with the load connected at the bus concerned removed subjected to a predetermined condition.
Step 2: Run load flow to compute the voltage profile and power flow in the system.
Step 3: Calculate VSCI value for each load bus. The load bus with the highest value of VSCI is identified as the most critical bus in the system.
Step 4: Increase load at every load buses other than the most critical bus identified in Step 3, until the system reaches its collapse point. This step is important in order to investigate the relationship between the other load buses and the most critical bus.
Step 5: Normalise WAI values for all load buses.
Step 6: Rank the normalised WAI values in descending order.
Step 7: Cluster the weak area by highlighting the bus system configuration graphically. Load buses which are included in the weak areas are identified based on the coherency in the change of voltage and phase angle of the load buses between the initial case and the final case. More than one cluster of weak area can be formed depending on the interconnection between these buses.
IV. VOLTAGE STABILITY VARIATION METHOD FOR WEAK
AREA IDENTIFICATION
For validation purpose, the performance of the proposed WAI is compared with the performance of weak area determination technique using Voltage Stability Variation Method. By considering the L-Index [18], two indicators to identify weak area were developed. The formulation of L-Index is as follow: 2 1 2 1 1 1 2( cos( ) cos( ) 4 i i i i i i i i V V V V L
(6)The changes in L at the critical bus, i with respect to
changes in active and reactive power demand at load bus j are
given by the partial derivatives as in the following equations:
j i j i j i j i j i V L P V L P P L (7) j i j i j i j i j i V L Q V L Q Q L (8)
Rephrasing equations (7) and (8) into matrix form,
j i j i j i j i j i j i j i j i V L L P V P V Q P Q L P L (9) Where
j i j i j i j i P V P V Q P
is the inverse Jacobian matrix (10)
By differentiating equation (6) with respect to θ and V,
2 0 0 0 0 )(2 cos( ) ) sin( 4 V V V V L i i i i j i (11) 2 0 0 2 0 0cos( ) (2 cos ( )) ( 4 V V V V L i i i j i (12)
Equations (11) and (12) are the two indicators developed to identify the weak area in this method. Both indicators are calculated for every load buses and the greater value among the two is chosen for the ranking. The normalised value of the chosen indicator is then ranked in descending order.
The normalised value is obtained by dividing
j i P L and j i Q L by i i P L and i i Q L respectively where i i P L
is the change in voltage stability with respect to
change in active power demand at the critical bus i.
i i Q L
is the change in voltage stability with respect to
change in reactive power demand at the critical bus i.
V. RESULTS AND DISCUSSIONS
MATLAB programming language was used to develop programmes for the simulations. In this paper, the performances of all methods were tested on IEEE 30 bus and IEEE 118 bus test system. The results from both methods were highlighted graphically on the bus system configuration.
A. Weak Area Identification of IEEE 30 Bus Test System
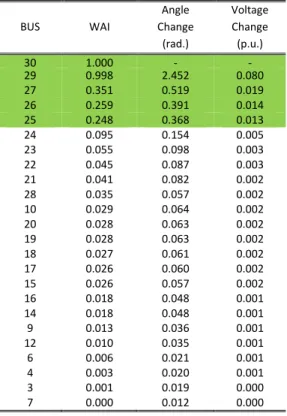
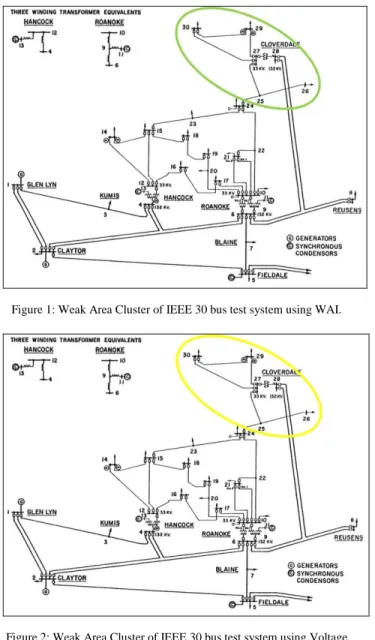
IEEE 30 bus test system has 1 swing bus, 5 generator buses and 24 load buses with 41 interconnected lines. Bus 30 was identified as the most critical bus in the system by using the method developed in [19]. Table 1 tabulates the results of the performance of WAI while Table 2 tabulates the results by voltage stability variation method. Based on the coherency in angle and voltage variation explained in Section III, the cut off value chosen for Table I is 0.248 while for Table II is 0.759. Figure 1 and Figure 2 illustrates weak area cluster highlighted on the bus system configuration of IEEE 30 bus system for both methods. Based on the tables and figures, both methods show similar results with bus 30, 29, 27, 26 and 25 are grouped in a cluster to form the weak area.
Table 1
The Performance of WAI of IEEE 30 Bus System
BUS WAI Angle Change (rad.) Voltage Change (p.u.) 30 1.000 - - 29 0.998 2.452 0.080 27 0.351 0.519 0.019 26 0.259 0.391 0.014 25 0.248 0.368 0.013 24 0.095 0.154 0.005 23 0.055 0.098 0.003 22 0.045 0.087 0.003 21 0.041 0.082 0.002 28 0.035 0.057 0.002 10 0.029 0.064 0.002 20 0.028 0.063 0.002 19 0.028 0.063 0.002 18 0.027 0.061 0.002 17 0.026 0.060 0.002 15 0.026 0.057 0.002 16 0.018 0.048 0.001 14 0.018 0.048 0.001 9 0.013 0.036 0.001 12 0.010 0.035 0.001 6 0.006 0.021 0.001 4 0.003 0.020 0.001 3 0.001 0.019 0.000 7 0.000 0.012 0.000 Table 2
The Performance of Voltage Stability Variation Method of IEEE 30 Bus System BUS dldpdq Angle Change (rad.) Voltage Change (p.u.) 30 1.000 2.452 0.080 27 1.000 0.151 0.011 29 0.909 1.174 0.066 25 0.829 0.007 0.009 26 0.759 0.256 0.016 24 0.377 0.033 0.004 23 0.260 0.057 0.004 22 0.243 0.013 0.002 21 0.191 0.012 0.002 20 0.166 0.046 0.003 10 0.164 0.000 0.002 18 0.155 0.058 0.004 28 0.152 0.008 0.001 19 0.146 0.054 0.004 17 0.143 0.017 0.002 15 0.136 0.024 0.002 16 0.115 0.034 0.003 14 0.109 0.069 0.003 9 0.083 0.001 0.001 12 0.067 0.001 0.001 3 0.041 0.010 0.001 6 0.040 0.002 0.000 4 0.038 0.005 0.001 7 0.000 0.013 0.001
Figure 1: Weak Area Cluster of IEEE 30 bus test system using WAI.
Figure 2: Weak Area Cluster of IEEE 30 bus test system using Voltage Stability Variation Method.
B. Weak Area Identification of IEEE 118 Bus Test System
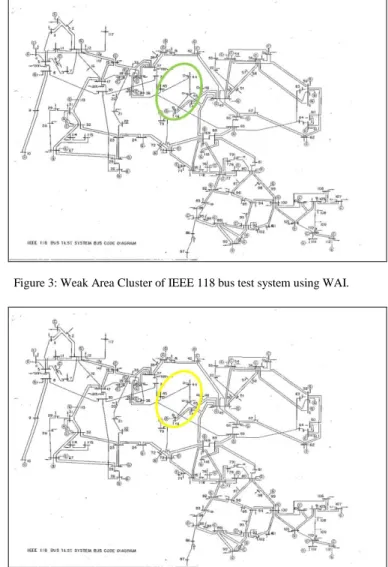
To expand the breadth of the study, another test is conducted on IEEE 118 bus test system. This system has 54 generator buses and 99 load buses with 186 interconnected lines. Bus 44 was identified as the weakest bus in the system subjected to a predetermined condition. Table 3 and 4 show the weak area identification performance of WAI and Voltage Stability Variation Method respectively. In Table 3, the cut off value of 0.604 is chosen since it is observed that there is coherency in the variations of voltage magnitudes and angles at the critical bus due to load changes at these buses and hence the weak area is formed by buses 44, 45 and 43. Likewise, from Table IV, bus 44, 45 and 43 are identified to form the weak area where the cut off value of dldpdq is chosen to be 0.971. The weak area formed highlighted on the bus system configuration of IEEE 118 bus test system for both methods are illustrated in Figure 2. Based on the tables and figures, once again WAI gives the similar result with Voltage Stability Variation Method with load bus 44, bus 45 and bus 43 are identified as the weak load buses, hence are grouped as the weak area cluster.
Table 3
The Performance of WAI of IEEE 118 Bus System
BUS WAI Angle Change (rad) Voltage Change (p.u) 44 1.000 1.498 0.044 45 0.712 1.937 0.054 43 0.604 1.498 0.044 47 0.006 0.052 0.000 38 0.005 0.034 0.000 21 0.003 0.026 0.000 22 0.003 0.024 0.000 20 0.002 0.018 0.000 33 0.002 0.016 0.000 37 0.002 0.015 0.000 117 0.002 0.015 0.000 30 0.002 0.012 0.000 13 0.002 0.012 0.000 39 0.002 0.012 0.000 52 0.002 0.014 0.000 48 0.001 0.011 0.000 53 0.001 0.011 0.000 51 0.001 0.009 0.000 16 0.001 0.007 0.000 58 0.001 0.008 0.000 41 0.001 0.006 0.000 28 0.001 0.006 0.000 81 0.001 0.006 0.000 2 0.001 0.005 0.000 68 0.001 0.005 0.000 57 0.001 0.005 0.000 14 0.001 0.004 0.000 35 0.001 0.004 0.000 29 0.001 0.004 0.000 50 0.001 0.004 0.000 11 0.000 0.004 0.000 115 0.000 0.003 0.000 3 0.000 0.003 0.000 114 0.000 0.003 0.000 75 0.000 0.003 0.000 23 0.000 0.003 0.000 17 0.000 0.002 0.000 118 0.000 0.002 0.000 95 0.000 0.002 0.000 67 0.000 0.002 0.000 63 0.000 0.002 0.000 101 0.000 0.002 0.000 93 0.000 0.002 0.000 64 0.000 0.002 0.000 84 0.000 0.002 0.000 106 0.000 0.001 0.000 94 0.000 0.001 0.000 109 0.000 0.001 0.000 71 0.000 0.001 0.000 108 0.000 0.001 0.000 7 0.000 0.001 0.000 102 0.000 0.001 0.000 98 0.000 0.001 0.000 86 0.000 0.001 0.000 97 0.000 0.001 0.000 88 0.000 0.001 0.000 60 0.000 0.001 0.000 96 0.000 0.001 0.000 83 0.000 0.001 0.000 82 0.000 0.000 0.000 79 0.000 0.000 0.000 9 0.000 0.000 0.000 78 0.000 0.000 0.000 5 0.000 0.000 0.000
Table 2
The Performance of Voltage Stability Variation Method of IEEE 118 Bus System
BUS dldpdq Angle Change (rad) Voltage Change (p.u) 44 1 25.003 0.314 43 1 13.644 0.143 45 0.971 14.217 0.181 50 0.001 6.033 0.007 48 0.001 6.93 0.015 51 0.001 5.798 0.004 52 0.001 5.74 0.003 57 0.001 5.664 0.003 53 0 5.551 0.001 58 0 5.62 0.002 47 0 6.36 0.019 67 0 4.432 0 60 0 4.175 0 63 0 4.118 0.001 64 0 3.929 0.001 38 0 6.043 0.009 23 -0.001 4.744 0.001 22 -0.001 5.167 0.005 30 -0.001 5.878 0.003 21 -0.001 5.45 0.007 114 -0.001 5.329 0 9 -0.001 5.933 0 5 -0.001 5.957 0 17 -0.001 5.939 0.001 115 -0.001 5.33 0 28 -0.001 5.408 0 20 -0.001 5.697 0.009 41 -0.001 7.093 0 29 -0.001 5.491 0 37 -0.001 7.162 0.01 14 -0.001 6.026 0 7 -0.001 5.975 0 2 -0.001 5.979 0 16 -0.001 5.969 0 33 -0.001 6.634 0.005 117 -0.002 5.983 0 13 -0.002 6.019 0 39 -0.002 7.175 0.004 3 -0.002 5.971 0 11 -0.002 5.98 0 35 -0.002 7.224 0.018 109 0 1.441 0 68 0 2.234 0 81 0 1.962 0 102 0 1.419 0 93 0 1.418 0 108 0 1.441 0 97 0 1.46 0 84 0 1.368 0 94 0 1.422 0 83 0 1.349 0 96 0 1.411 0 95 0 1.417 0 101 0 1.43 0 98 0 1.484 0 78 0 1.23 0 79 0 1.304 0 82 0 1.337 0 86 0 1.377 0 88 0 1.392 0 106 0 1.441 0 118 0 0.95 0 75 0 0.89 0
Figure 3: Weak Area Cluster of IEEE 118 bus test system using WAI.
Figure 4: Weak Area Cluster of IEEE 118 bus test system using Voltage Stability Variation Method.
VI. CONCLUSION
In this paper, a new method to detect weak areas in a power system based on voltage stability named as Weak Area Indicator (WAI) is presented. The proposed method uses a newly developed voltage stability index, VSCI to determine the voltage stability of the system. The formulation of WAI is based on the acknowledgement of the weakest bus, a bus that may lead the system to voltage collapse. In contrast to other existing methods, the application of WAI takes into account the impact of load increase at other load buses on the critical bus. The coherency of variation in voltage and angle are used as the cut off value to determine the weak area cluster boundary. For validation purpose, the proposed WAI performance was compared with the existing weak area identification method known as Voltage Stability Variation method. The tested results have shown that the proposed WAI is able to cluster weak areas correctly. The weak area cluster is observed to group the buses which are directly and closely connected to the most critical bus. WAI is simple and straight forward, yet able to identify weak area correctly when compared to a more complicated method. Therefore, WAI can be explored further in online application for a fast weak area
identification.
ACKNOWLEDGMENT
This paper is based on work supported by the Ministry of Higher Education (MOHE) of Malaysia under grant 20160104FRGS. Any opinions, findings and conclusion or recommendation expressed in this paper are those of the authors and do not necessarily reflect those of the Ministry of Higher Education (MOHE) of Malaysia.
REFERENCES
[1] 2003 Blackout in the United States and Canada Causes and Recommendations, U.S.-Canada Power System Outage Task Force, April 5, 2004.
[2] A. Nuhanovic, M. Glavic, and N. Prljaca, "Validation of a clustering algorithm for voltage stability analysis on the Bosnian electric power system," IEE Proceedings- Generation, Transmission and Distribution,
vol. 145, pp. 21-26, 1998.
[3] A. C. Zambroni de Souza and V. H. Quintana, "New technique of network partitioning for voltage collapse margin calculations,"
Generation, Transmission and Distribution, IEE Proceedings-, vol. 141,
pp. 630-636, 1994.
[4] S.K.S. Abdullah, M.K.N.M. Sarmin, N. Saadun, M.T. Azmi, I. Z. Abidin, I. Musirin, “New generator and shunt reactive power control based secondary voltage control approach,” International Review of
Automatic Control, Volume 9, Issue 4, 2016, Pages 192-206.
[5] T. K. A. Rahman, "A New Voltage Index and Its Application in Power System Control," University of Malaya, Malaysia, 1996.
[6] I. Musirin and T. K. Abdul Rahman, "Novel fast voltage stability index (FVSI) for voltage stability analysis in power transmission system," in
2002. SCOReD 2002. Student Conference on Research and
Development, , 2002, pp. 265-268.
[7] I. Musirin and T. K. A. Rahman, "Voltage stability based weak area clustering technique in power system," in PECon 2004. Proceedings.
National Power and Energy Conference, 2004, pp. 235-240.
[8] M. K. Verma and S. C. Srivastava, "Approach to determine voltage control areas considering impact of contingencies," IEE Proceedings-,
Generation, Transmission and Distribution, vol. 152, pp. 342-350, 2005.
[9] S.M. Hassan, J. Olamaei, V. Gholami, M. Jahangir, “Decision tree based onlineidentification of critical voltage control area,” Asia-Pac. Power Energy Engineering Conference, 2004, pp. 1–4.
[10] S. Satsangi, A. Saini, A. Saraswat, “Voltage control areas for reactive powermanagement using clustering approach in deregulated power system,” Proc.International Conference on Sustainable Energy and
Intelligence Systems, 2011, pp. 409–415.
[11] H. B. Wan, et al., "Identification of voltage weak buses/areas using neural network based classifier," in 8th MediterraneanElectrotechnical
Conference, 1996. MELECON '96., 1996, vol. 3, pp. 1482-1485.
[12] G. Shankar, V. Mukhrjee, S. Debneth, K. Gogoi, “Study of Different ANN Algorithms for Weak Area,” 1st International Conference on
Power and Energy in NERIST (ICPEN), 2013, pp. 1-4.
[13] Huilian Liao, Sami Abdelrahman, Yue Guo, and Jovica V, “Identification of Weak Areas of Network Based on Exposure to Voltage Sags—Part II: Assessment of Network Performance Using Sag Severity Index,” IEEE Transactions on power Delivery, vol 30, No. 6, December 2015.
[14] X. Hao, L. Yinhong, Y. Ruiji, D. Xianzhong, “A Rapid Identification Method of Weak Areas” in Power Grid Based on Commutation Failure Analysis in Multi-infeed HVDC Systems”, Proceeding of the CSEE, Vol 36, No. 7, 1781-1789, 2016.
[15] Q. Yu, A. Feng, Q. He and N. Cao, "Weak part identification in power grid based on self-organized criticality," 2016 China International
Conference on Electricity Distribution (CICED), Xi'an, 2016, pp. 1-6.
[16] H Hashim, Y R Omar, I Z Abidin, R A Zahidi, N Ahmad, A M Ali, “Weak area analysis based on the apparent impedance and voltage indices,” 2009 3rd International Conference on Energy and
Environment (ICEE), pp. 251-255.
[17] M. Nizam, A. Mohamed, A. Hussain, "Dynamic Voltage Collapse Prediction on a Practical Power System Using Power Transfer Stability Index," in 5th Student Conference on Research and Development, 2007.
SCOReD 2007. 2007, pp. 1-6.
[18] T. K. A. Rahman and G. B. Jasmon, "A new technique for voltage stability analysis in a power system and improved loadflow algorithm for distribution network," in Energy Management and Power Delivery,
1995. Proceedings of EMPD, 1995, vol. 2, pp. 714-719.
[19] NF. Ab. Aziz, T. K. Abdul Rahman and Z. Zakaria, "A New Voltage Stability Condition Indicator (VSCI) for Power System Analysis," in 8th Jordanian International Electrical and Electronics Engineering