Semar, Wolfgang: Development of a benchmark system for analyzing collaborative group
performance as part of an educational online knowledge management system. In: Arabnia,
Hamid; et al. (Hg.): Proceedings of the International Conference on Information and
Knowledge Engineering - IKE'05. Las Vegas: CSREA Press, 2005
Dieses Dokument wird unter folgender HCreative-CommonsH-Lizenz veröffentlicht: Hhttp://creativecommons.org/licenses/by-nc-nd/2.0/de/H
Development of a benchmark system for analyzing
collaborative group performance as part of an
educational online knowledge management system
Dr. Wolfgang Semar University of Konstanz Information Science Box 87 D – 78457 Konstanz (Germany) [email protected]
Abstract: Electronic communication forums in education in general and in particular do not work without proactive motivation of their users. Users need to know what their benefits are when sharing knowledge and contributing actively in such forums. Therefore the collaborative knowledge management system “K3” which is used in academic education of Information Engineering students at the university of Konstanz in Germany has been developed within a benchmark system to motivate users. This paper describes how the different benchmark means of quantifying work together in measuring and assessing users’ performance and thus stimulating their willing to cooperate in their collaborative work. Special attention is given to the “degree of collaboration” of group work. We suggest four criteria for measuring this degree: participation, interaction, synthesis, and independence.
Keywords: collaborative knowledge management; CSCW; incentive system; benchmark; motivation; measurement; assessment
1.0 Introduction
Currently, new ways of education are emerging. Collaborative and self-controlled learning by way of electronic media is a main issue. It has been shown that the participants in such electronic learning systems need to be proactively motivated and supported. Usually, this is done by personal addresses: A lecturer will ask the students for certain actions within the system. This forces performance in the learning environment, but it is more successful and sustainable to really motivate the students. That is where incentive and motivation systems come in [12, p. 23]. We want to introduce such a system: It consists of various visualized benchmarks for every single user. So they get individual assessment and are motivated to collaborate and to take part in generating knowledge.
This incentive system is part of the “K31” software which enables collaborative creation of conceptual knowledge from heterogeneous resources and through electronic communication forums. K3 is an open software system that supports collaborative and distributed production of conceptual knowledge in academic learning environments by using heterogeneous resources and moderated electronic communication forums. Further information competency is to be gained by embedding external information resources (from the WWW and the scientific community). This knowledge is strongly linked, structured by context and semantics as well as visualized to ensure comfortable navigation. A crediting/rating feature is integral part of the K3 system and is the basis of the incentive system. Every entry a student makes to the system – be it a comment on a current thread or a reference link – is registered and credited as individual performance or as part of collaborative work. These contributions also generate certain scores and there is a visualized output. This is a permanent feedback function showing the students how they are performing. By comparing individual performance with other students’ performance every participant can see their current standing within the community. Thus it is possible to have a dynamic and individual evaluation of learning success as well as an assessment of the group’s collaboration activities.
An incentive system with strong focus on reputational aspects has been established to support the whole process of generating knowledge. The participants are given a task which they have to solve by team work. Individual incentives are given to promote individual performance which then is evaluated with the benchmarks. The results of this evaluation affect the students’ motivation, so they will go on with their task until it is done successfully.
2.0 Developing a benchmark system for measuring collaborative team work
In education, especially motives of intrinsic nature are important [14]. Intrinsic rewards or incentives come from work itself. If the proper motives, e.g. striving for excellence, are given, intrinsic motivation comes immediately with acting, with personal success. It is the user's choice which kind of activity they want to take, therefore K3 has been built so that anybody can choose the activity that is most motivating. And with the help of the K3 benchmark system everyone and every group can check how successful their performance is. K3 is about collaborative knowledge management. With collaboration being a complex process it is different to tell, if a group is really collaborating or if it is just cooperating, and how successful and effective the collaboration is. There are some characteristics to define collaborative group work:
First, interdependence within a group [6]. Interdependence requires that each member actively contribute to the group discussion. At a superficial level, it requires simple participation by each member. Roughly equal participation at this level is a necessary but not a sufficient condition for interdependence. Once roughly equal participation has been established, however, we must dig deeper to see whether the discussants are genuinely interacting. How much the individuals contributed to solving the problem is indicated by the interaction in the group on the content of the problem [5, p. 225]. Interaction requires participation by all group members but is more than that. Group members have to respond and react to one another during the course of discussion, that is, they have to interact. Without these two issues (participation and interaction) there can be no collaboration in a team. Collaboration needs fairly equal activity by every team member. Interaction is more than just participation, it is about action – interacting with others and reacting to others. If there is no action, response or discourse, one can not talk of collaboration.
Second, the teams must have a mission and work up to a common aim which is the result of their discussions and that is the synthesis of all individual contributions. Collaboration requires that the
1
K3 is a system that is currently being developed at the university of Konstanz/chair of Information Science. It is a project funded by the German Ministry of Science and Education (BMBF, Project number: 08C5896). For further information see the project's website: www.k3forum.net
group generate a product that is distinct from the individual contributions of the group members. Collaboration is more than the exchange of information and ideas. It is the creation of new insights in the individuals of the group during the discussion. The individual resources combined make the result that is more than the sum of the parts. Thus, it is the synthesis of shared information and ideas that creates a product different from any that the individuals could have produced alone [7, 5].
Third, the team’s independence. This means on the one hand side independence as autonomous actions of students who do not refer questions and problems to the instructor, and on the other hand side that the instructor does not have to intervene with the group's work. The team must be able to collaborate with each other or seeking alternative sources to find a solution on their own and come to synthesis without the instructor’s help [9].
The concept “benchmark” has seen a long discussion which led to a commonly accepted understanding [11, p. 19]: Since the 1970’s, it is common understanding that benchmarks are to be seen as a concentrated form of complex, quantitative issues of the subject matter to which they are applied to [13, p. 3]. Being of informative character, their quantifiability, and their specific form are the characteristics of benchmarks. The benchmarks show facts and those facts’ interdependencies – this is their informative character. Quantifiability results form variables that bring facts into a numeric form and make them scalable. This metric display allows a concise view of complex structures and processes [11, p. 20]. The interpretation of single benchmarks without knowing their conceptual background should be avoided, because it may lead to wrong conclusions [11, p. 20]. It is advisable to supply quantitative benchmarks with qualitative information [15]. This can compensate a lack of information caused by looking at a single benchmark – preferrably, benchmarks from related backgrounds are being combined. They may be of mathematical or logical nature [10]. Generally, a benchmark system is “a compilation of quantitative variables with the single benchmarks in a useful relation, mutually complementing or explaining each other, and being directed to a greater common idea” [11, p. 23].
3.0 K3 benchmarks for measuring collaboration
Different grades and levels of activity to measure the readiness for interaction and communication in electronic communication forums are described by [8, p. 50]. We use them as a basis for further measures to rate the activities of K3 users. However, one must not use too many benchmarks for they may cause information overload. To avoid this, the benchmarks are compacted in a benchmark system and are visualized in a second step.
For setting up the incentive/motivational benchmark component in K3 it is not helpful to use a hierarchic method, for not all K3 benchmarks are mathematically related. The more useful approach is to have the measures in an order defined by subject and content criteria [4, p. 555]. Grob [2, p. 50] suggest a benchmark system for LMSs (learning management systems) from which we borrow the K3 benchmarks: coverage, relation, and time range that are registered on four levels: System level, course level, team level, and individual level.
Coverage is generated from measures like number of participants and entries and is given as absolute numbers (and sums). The combination of absolute numbers generates relation figures. They are shown as percentage or index numbers [13, p. 8]. Time range figures are derived from monitoring long-time user performance. By analyzing timelines then changes in benchmarks can be identified.
The underlying didactic idea of K3 is that of collaborative group work. A group is given a task by the instructor (on course level) and the group has to solve this task on their own (on team level). Each member of the group has to enrol to one of various given roles (i.e. presenter, researcher, moderator, summarizer) which they hold until the task is finished. The group decide on their own which role is taken by whom. This process of assigning roles (by being discussed in the system) has to be marked as entry type “organisational”. A corresponding field type is provided. To ensure collaborative
knowledge work every participant has to take part in the discussion besides their role function. Each entry needs to be typed by its contributor. K3 provides the entry types: Organisational, comment, question, hypothesis, agreement, rejection, argument continued, example, definition, summary, presentation, and reference. So every entry bears a special mark depending on its type and author, and it can be seen any time who made which entry.
In this paper, we will focus on the benchmarks on team and on individual level to define the degree of collaboration within a group. It is not easy to create a single decision rule that allows us to categorize groups definitively as collaborative or non-collaborative ones. Instead, there is a continuum for groups from highly collaborative to barely collaborative. On team level and on individual level there are some benchmarks of organisational nature, but particularly there are didactic figures, for they are important for enhancing motivation, especially when showing and comparing performance of the different groups in relation to each other. Also the changing of a group’s figures during time is important, because it shows the team’s development. And it is these benchmarks on team level that are the most interesting, because they indicate the actual collaborative knowledge management. We need ways to measure the relative amounts of synthesis, independence, interaction, and participation. For every team each of the four characteristics is taken and the “degree of collaboration” is set up. These “collaboration degree” will then allow us to compare groups for the amount of collaboration they exhibit.
The benchmark "synthesis" can only be found in a cognitive way. In K3, this is done by the team members. The member who writes the summary, has to make it available to the whole team before publication. Every participant of the group has to consent and to rate the summary with a voting tool. Summary does not become "synthesis" until each member's knowledge work has become part of it. If entries are missing or are not shown properly, the summary has to be re-done or it will be rated poorly. If all members agree with the summary and each individual entry has been respected, the “degree of synthesis” is 1; if it is close to 0, there has been no collaborative group work.
The benchmark “independence” is the ability of the group to work without the instructor. It is measured by analyzing the extent of instructors influence in both participation and interaction. A discussion in which few or no threads occur without instructor input is not independent, and hence not truly collaborative. It has to be considered that the instructor does not only make comments which are advice to the group, but which also support the group and encourages them to go on. These supportive contributions by the instructor should not influence the measurement. The K3 system recognizes such entries by a mark the instructor makes. The "degree of independence" of a group is the result from: "Degree of independence" = 1 - ("Number of corrective instructor's entries" / "Number of all entries" in the group (students' plus corrective instructor's entries)). If it is close to 0, there is little independence within the team; if close to 1, there is strong independence.
“Interaction” requires at least a comment and a response to the comment, thus it is partly determined by the length of the dialogue. The response must refer to a previous statement. Stand-alone comments are independent statements. They do not lead to further discussion, and they neither respond to a comment nor generate a response. Collaboration requires more than the exchange of information that occurs in a series of independent statements. Independent statements may contribute to the task, since they enable the group members to add information and learn from the group, but they are not true interaction and thus are not part of the collaborative effort [Ingram 2003, 228]. A great number of stand-alone entries may indicate cooperative group work, but not collaborative group work, because stand-alone entries are not of an interactive nature. A given thread A-B-C-A shows three different users making a contribution, with B and C reacting to A and the last comment made by A. So the “degree of interaction” of a group can be found by calculating the “number of stand-alone entries”. Entries of an organisational nature are not considered for they are not actually part of a discussion. The benchmark “degree of interaction” of a group is the result from: „Degree of interaction“ = 1 – (“Number of stand-alone entries” in a group / ”Number of entries by all students ”). If the result is close to 0, there is little team interaction; if it is close to 1, there is a lot of interaction.
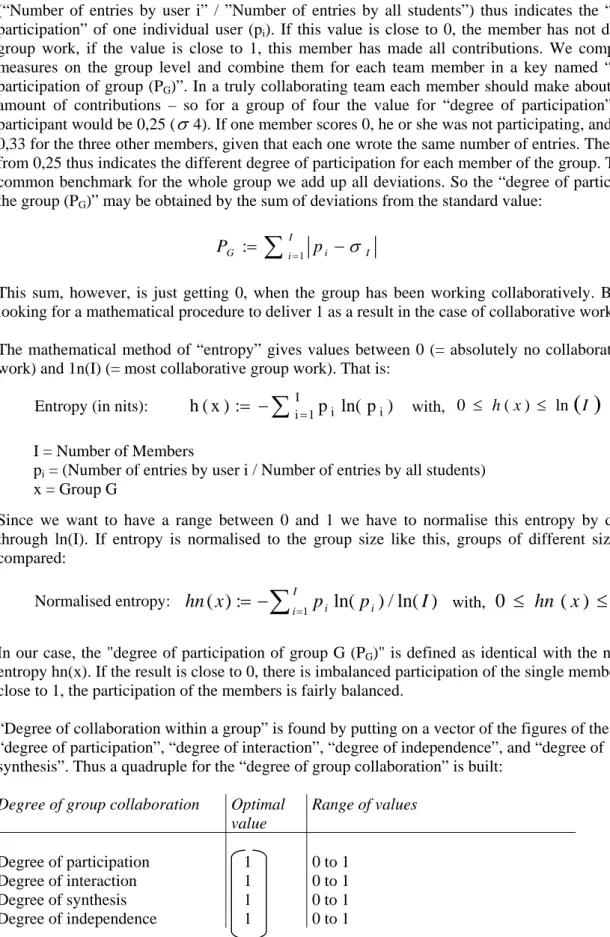
“Participation” forms the skeleton that supports interaction. For every user the measure “Participation i” is taken on the individual level by calculating the “number of entries by user i”. The ratio of (“Number of entries by user i” / ”Number of entries by all students”) thus indicates the “degree of participation” of one individual user (pi). If this value is close to 0, the member has not done much
group work, if the value is close to 1, this member has made all contributions. We compare these measures on the group level and combine them for each team member in a key named “degree of participation of group (PG)”. In a truly collaborating team each member should make about the same
amount of contributions – so for a group of four the value for “degree of participation” for each participant would be 0,25 (
σ
4). If one member scores 0, he or she was not participating, and there is a 0,33 for the three other members, given that each one wrote the same number of entries. The deviation from 0,25 thus indicates the different degree of participation for each member of the group. To get one common benchmark for the whole group we add up all deviations. So the “degree of participation of the group (PG)” may be obtained by the sum of deviations from the standard value:his sum, however, is just getting 0, when the group has been working collaboratively. But we are
he mathematical method of “entropy” gives values between 0 (= absolutely no collaborative group
ince ave a range between 0 and 1 we have to normalise this entropy by dividing it
our case, the "degree of participation of group G (PG)" is defined as identical with the normalised
Degree of collaboration within a group” is found by putting on a vector of the figures of the groups’
egree of group collaboration Optimal Range of values
I I i i G p P :=
∑
=1 −σ
Tlooking for a mathematical procedure to deliver 1 as a result in the case of collaborative working. T
work) and 1n(I) (= most collaborative group work). That is:
S we want to h
through ln(I). If entropy is normalised to the group size like this, groups of different sizes can be compared:
In
entropy hn(x). If the result is close to 0, there is imbalanced participation of the single members; if it is close to 1, the participation of the members is fairly balanced.
“
“degree of participation”, “degree of interaction”, “degree of independence”, and “degree of synthesis”. Thus a quadruple for the “degree of group collaboration” is built:
D value Degree of participation 1 0 to 1 Degree of interaction 1 0 to 1 Degree of synthesis 1 0 to 1 Degree of independence 1 0 to 1 Entropy (in nits):
1 i i
∑
=−
=
0 h(x) ≤ ln( )
ITab. 1 Quadruple “Degree of group collaboration”
)
p
ln(
p
:
)
x
(
h
I i with, ≤ I = Number of Memberspi = (Number of entries by user i / Number of entries by all students)
I x = Group G
)
ln(
/
)
ln(
:
)
(
1p
p
I
x
hn
i i i∑
=−
=
with,0
≤
hn
(
x
)
≤
1
Normalised entropy:This vector resp. the four degrees can be visualized in a spidergram. Due to the independence of the
ig. 1 Visualization of group collabo g the performance of two groups G1
hen comparing different groups to each other the most useful key for comparison is the “degree of
4.0 Summary
he benchmark system given here shows the finding of the measure "degree of group collaboration".
displaying benchmarks has positive impacts on the work and motivation of K3 users.
degrees the captions of the single axes need not to be in particular order, but for reasons of clarity it is preferable to maintain the order once chosen. The next figure shows the “degree of collaboration” between two different groups (G1 and G2). The visualization may be used as a diagnostic tool for analyzing groups, be it for comparing various groups or showing the development of a specific group during time.
Degree of synthesis Degree of participation
Degree of independence Degree of interaction
1.00 0.75 0.50 0.25
G1
G2
F ration – comparin (0.75/0.5/0.5/0.5) and G2 (1/1/1/1) Wgroup collaboration”. The instructor and the team members thus can learn how the different groups are performing. By timeline analysis it is shown how the “degree of group collaboration” within a group and in relation to the other groups has been changing during the whole course and while working on a task.
T
It can be used to analyze how successful a group of participants has solved their given task in collaboration. When designing the K3 software one issue was to allow the feature of additional benchmarks beside those presented in this paper, which are used for the didactic, organisational, technical, and motivational control of K3 participation. There are ideas of installing further benchmarks on the individual level to learn more details on single user performance, f. ex.: Who is fastest/slowest in reacting to a comment? What is the average number of reactions to an entry? How many replies are there in general? One aspect we are currently giving special attention is the visualization of the benchmarks: Is it better to have graphics or should the keys be displayed in tables? Furthermore, it is discussed which user may retrieve which key data from the system. Also it has to be examined in more detail whether the "degree of interaction" is rather found by the structure of discourse in a group than by the stand-alone statements. K3 in the current version is a basis to be extended step by step. An evaluation of the first release has shown that continuous assessment and
5.0 References
1] Betriebswirtschaftliches Institut f nd Automation: Kennzahlenbuch der Materialwirtschaft. Arbeitspapier 80-3. Köln: Universität Köln/BIFOA, 1980
n, Doris; Barrios,
[3]
Conferencing. The Najaden Papers; [proceedings of
[4]
Praxis. [5]
m S. (Hg.): Online Collaborative Learning: Theory and [6]
rencing. The Najaden Papers; [proceedings of the NATO Advanced
[8]
computer-mediated support h and Development, 46 (1), [10]
er (Hg.): Handbuch Anreizsysteme in Wirtschaft und Verwaltung. Stuttgart: Poeschel, [13]
0, (Hg): Lehrstuhl für Allg. BWL und Wirtschaftsinformatik, Johannes [14]
Acquiring Knowledge. In: Arabnia, Hamid et al. (Hg.):
[15]
[ uer Organisation u
[2] Grob, Heinz Lothar; Bensberg, Frank; Dewanto, Lofi; Düppe, Ingo: Controlling von Learning Management-Systemen – ein kennzahlenorientierter Ansatz. In: Carstense
Beate (Hg.): Campus 2004. Kommen die digitalen Medien an der Hochschule in die Jahre? Münster: Waxmann, 2004, S. 46 – 56
Henri, France: Computer conferencing and contend analysis. In: Kaye, Anthony R. (Hg.): Collaborative Learning Through Computer
the NATO Advanced Workshop on Collaborative Learning and Computer Conferencing, held in Copenhagen, Denmark, July 29 - August 3, 1991]. Berlin: Springer, 1992, S. 117 – 136
Hummel, Thomas: Quellen und Elemente von Informationssystemen des Controlling. In: Steinle, Claus; Bruch, Heike (Hg.): Controlling - Kompendium für Ausbildung und
Stuttgart: Schäffer Poeschel, 2003
Ingram, Albert L.; Hathorn, Lesley G.: Methods for Analysing Collaboration in Online Communications. In: Roberts, Ti
Praxice. Information Science Publishing: Hershey, 2003, S. 215 – 241
Johnson, David W.; Johnson Roger T; Smith, Karl A: Cooperative learning returns to college. In: Change, 30 (4), 26-35
[7] Kaye, Anthony R.: Learning together apart. In: Kaye, Anthony R. (Hg.): Collaborative Learning Through Computer Confe
Workshop on Collaborative Learning and Computer Conferencing, held in Copenhagen, Denmark, July 29 - August 3, 1991]. Berlin: Springer, 1992, S. 1-24
Kuhlen, Rainer: Mondlandung des Internet. Konstanz: UVK, 1998 [9] Laffey, James; Tupper, Thomas; Musser, Dale; Wedman, John: A
system for projekt-based learning. Educational Technology Researc 73 -86
Meyer, Claus: Betriebswirtschaftliche Kennzahlen und Kennzahlensysteme. Stuttgart: Poeschel, 1994.
[11] Reichmann, Thomas: Controling mit Kennzahlen und Managementberichten. München: Vahlen, 2001
[12] Schanz, Günther: Motivationale Grundlagen der Gestaltung von Anreizsystemen. In: Schanz, Günth
1991, S. 3 – 30
Schwickert, Axel C.; Wendt, Peter: Controlling-Kennzahlen für Web Sites. In: Arbeitspapiere WI, Nr. 8/200
Gutenberg-Universität: Mainz, 2000
Semar, Wolfgang: Incentive Systems in Knowledge Management to Support Cooperative Distributed Forms of Creating and
Proceedings of the International Conference on Information and Knowledge Engineering - IKE'04. Las Vegas: CSREA Press, 2004, S. 406 – 411
Staehle, Wolfgang H.: Kennzahlen und Kennzahlensysteme als Mittel der Organisation und Führung von Unternehmen. Wiesbaden: Gabler, 1969