August 2017
The crop system in Iowa County
J. A. Hopkins Jr.
Iowa State College
Follow this and additional works at:
http://lib.dr.iastate.edu/bulletin
Part of the
Agricultural Economics Commons
This Article is brought to you for free and open access by the Extension and Experiment Station Publications at Iowa State University Digital Repository. It has been accepted for inclusion in Bulletin by an authorized editor of Iowa State University Digital Repository. For more information, please [email protected].
Recommended Citation
Hopkins, J. A. Jr. (2017) "The crop system in Iowa County,"Bulletin: Vol. 22 : No. 261 , Article 1. Available at:http://lib.dr.iastate.edu/bulletin/vol22/iss261/1
.Bulletin 261 June, 1929
The Crop System in Iowa County
By J. A . Ho p k in s, Jr.
AGRICULTURAL EXPERIMENT STATION IOWA STATE COLLEGE OF AGRICULTURE
AND MECHANIC ARTS
C. F. Cu r t is s, Director
A G R IC U LTU R A L ECONOMICS SECTION
C O N T E N T S
Page
Introduction ... 279
Source of D a t a ... •... . . . ... 279
Iowa County Crop S y s te m ... 280
Types of Land and Relationship to Cropping System. . 281
Iowa County Crop Rotations . . ... •... 285
The Corn Crop ... 286
Requirements in Production ... . ... 287
How Efficient Farmers Reduced the Cost . . . ... 289
Seasonal Labor Requirements on C o r n ... 290
Costs of S ila g e ... , . ... .... ... 292
Methods of Harvesting ... 293
Oats ... .... 295
Requirements in the Production of Oats ... 296
Barley ... 298
W inter W heat ... 300
Mixed Clover and Timothy H a y ... 302
Timothy S e e d ... 304
A lfa lfa and Sweet C lo v e r ... ... ... 305
Modification of the Crop System ... 307
Some Modification W ould Im prove the Five-Year Rotation ... 309
Four-Year Rotations Possible on Many F arm s... 309
Rough Land Requires Longer Rotations or Special Treatment ... 313
The Crop System in Iowa County
By J. À . Ho p k in s, Jr.
This bulletin, the first of a series of four, summarizes a study of the organization and management of farms in Iowa County, which was made in an effort to discover systems which w ill yield larger farm incomes*. The central questions in such a study have to do with the use of the farm er’s resources, of which land and labor are the most important.
The farm operator w ill want to select the crop enterprises which, w ill give him the greatest returns from his land over a period of years. In selecting the crops to utilize the land it w ill be necessary to consider the type of the soil, the topography, the climatic conditions, the location of the area with regard to mar kets and transportation facilities, the requirements of livestock enterprises fo r feeds and the demands of other crops for labor at different seasons of the year.
SOURCE OF DATA
The data which serve as a basis for this publication were ob tained by detailed records kept on 28 Iowa County farms during the three years, 1925 to 1927. The study was carried on by the Agricultural Economics Section of the Iowa Agricultural E x periment Station and the Bureau of Agricultural Economics of the United States Department of Agriculture. Twenty-two rec ords were obtained in 1925 and 26, and 18 in 1927. Additional data on the acreages and yields of crops fo r 1928 were obtained by visiting the farms in that year.
Complete records were kept on the farms of the financial trans actions of the business, the disposition of each crop produced, and the quantities of each feed consumed by each class of live stock. Account was kept of all transfers of materials, such as straw or stover, from one enterprise to another and of the use of man and horse labor by each enterprise. These records were checked up by a field .man who spent his entire time at this work. They were then sent in to the office at Iowa State College, where they were posted and summarized.
*Because of the volume of data obtained it was derided to divide its publication into four separate publications. This is the first of the series, and deals' with the crop system. A se~ond takes up the requirements and the performance of the live stock enterprises as found in Iowa County and suggests the livestock systems which seem adapted to that section. The third examines the place and functions of horses and tractors as sources of power on the farms, and the types of farm equip ment thru which this power may be applied most effectively. A fourth bulletin proposed will deal with the problem of combining livestock and crop systems into well rounded and profitable farm organizations.
Ficre s 320 280 rt/SCELLANEOU5 I—I T/rfO TH Y SEED BBS TIH O TH Y H A Y f22 CLO V E R - Pill ALFA LFA B A R LEY WHEAT OATZ CO R N
The Iowa County Crop System
The farm er’s problem in planning his crop system is to get from his land the largest net returns either of salable crops or of feed crops needed by the livestock. A t the same time, the sys tem should conserve the soil fertility and obtain the greatest production over a series of years.
Various crops, such as oats and barley, compete for labor or equipment at the same time. From these the farmer must select that crop which promises to be most profitable. In Iowa corn is generally the most profitable, as shown in table I. But it is not desirable to plant the entire acreage to corn. I t is necessary to plant a certain acreage of oats or barley in order to use the labor when it is not needed by the corn, to provide needed feeds fo r complementary livestock enterprises, or to conserve soil fe r tility by permitting the seeding down of forage and soil-build ing crops.
According to the United States agricultural census of 1925, the farms of Iowa County averaged 160.5 acres, of which approxi mately 60 percent was in crops. The farms studied were some what larger, averaging 198 acres for the three years; of this, 329 acres, or about 65 percent, were in crops. Taking the county as a whole, corn accounted for 48 percent of the crop land in
281
TAB LE I. Y IE L D AND VALU E OF P R IN C IP A L IO W A COUNTY CROPS 1923-1927
1923 1924 1925 1926 1927 1923-27Ave.
Corn
Yield, ?bu. 41 28.5 50.6 45.1 ...3-7.... 40.4
Price, Dep. i ... .57 1.03 .55 .53 ■ .74 .68
Value per acre 23.37 29.36 27.83 23.90 ... 27,38 - 27.47
Oats
Yield, bu. 34 40 41 34 ‘ 36 37 0
Price, Sept. i ... .32 .40 i .33 .30 .40 35
Value
Barley. per acre 10.88 16.00 ' 13.53 10.20 14.40 12.95
Yield, bu: 26 27 28 31 35 29 6 Price, Value Wheat Sept. i . .... .50 ! .66 .64 .54 .66 60 per acre 13.00 17.82 17.92 16.74 23.10 17.76 Yield, bu; 22 16 25 ’• 23 19 Price, Sept. i ... .87 1.10 1.39 1.10 1.21 1 14
Value per acre 19.14 17.60 34.75 25.30 22 99 23.94
Timothy
Yield, seed,lbs. lb. 211 189 158 180 180
Price, Sept. 1 .... 6.25 6.00 6.40 4.86 3.10 5 32
Value per acre 13.19 11.34 10.11 8.75 5.89 9.79
1925. On the cost route farms 67 acres, or 51 percent, of the crop land were in corn.. Figure 1 and table I I show that while the proportion of the land in corn differed considerably' from farm to farm, the proportion did not vary’ greatly between d if ferent sizes of farms.
The next most important crop after corn is oats, followed by wheat and barley. Oats averaged 32 acres per farm on the cost route in 1925, but decreased to 22 acres in 1927. Wheat and bar ley largely took the place of oats on this land, increasing from 1 acre of wheat and 3.3 acres of barley in 1925 to 6.1 acres of wheat and 6.4 acres of barley per farm in 1927.
TYPES OF LAND AND RELATIONSHIP TO CROPPING SYSTEMS
The use to which the land on a particular farm is put depends largely on the type of its soil and topography. Iowa County is typical of the Mississippi Loess section o f east-central Iowa,
TABLE I I . USE OF LAND ON IO W A COUNTY COST ROUTE FARMS__ B Y SIZE GROUPS
Crop acres 40-79 80-119 120-159 160-199 200-239 240-279
Number of farms 5 9 5 2 1
Acres operated All crops, acres
Corn Oats Wheat Barley Alfalfa 86.7 55.4 29.0 12.9 2.9 1.0 165.3 94.1 47.9 21.6 1.5 2.7 .1 • 237.3 145.0 70.6 30.8 6.8 3.1. 239.5 185.7 93.7 37.7 '3.9 16.8 312.2 224.6 127.9 45.8 4.0 4.2 323.2 242.3 148.9 35.2. ' 20.7 3.7 15.4 13.2 5.3 49.4 31.5 46.1 Glover & timothy
Timothy seed Misc. crops Pasture Waste, lotr&misc. % farm land in corn % farm land in 4.8 4.7 .1 25.0 6.3 33.4 10.0 5 . 7 4.6 61.6 9.7 29.0 5.5 22.1 6.3 75.0 17.3 29.8 21.8 11.6 .1 40.4 13.3 29.1 14.9 21.4 6.5 73.8 13.8 41.0 small grains 18.2 15.6 .17.2 .24.4 . 17.3 17.3
282
TAB LE I I I . USE OF LAN D— AVERAGE FOR THREE YEARS | 1925-27 I 1925 | 1926 | 1927 197.8 201.8 197.1 193.6 129.4 133.1 130.1 123.9 67.4 73.1 68.5. 59.0 21.8 27.7 31.6 28.5 Wheat ... 3.5 .9 4.0 6.1 5.1 3.3 5.8 6.4 .3 .2 .4 .2 10.1 12.2 6.3 12.1 11.3 10.3 9.0 15.6 4.0 1.4 7.7 2.7 55.5 55.5 54.0 57.3
Waste, lots & misc...— 12.8 13.3 12.8 12.4 Percentage farm land in :
34.1 36.2 34.8 30.5
Ofi ts 14.0 15.7 14.5 11.3
Whfiat, 1.8 .4 2.0 3.2
2.6 1.6 2;9 3.3
Clover and timothy ... 5.1 6.0 3.2 6.2
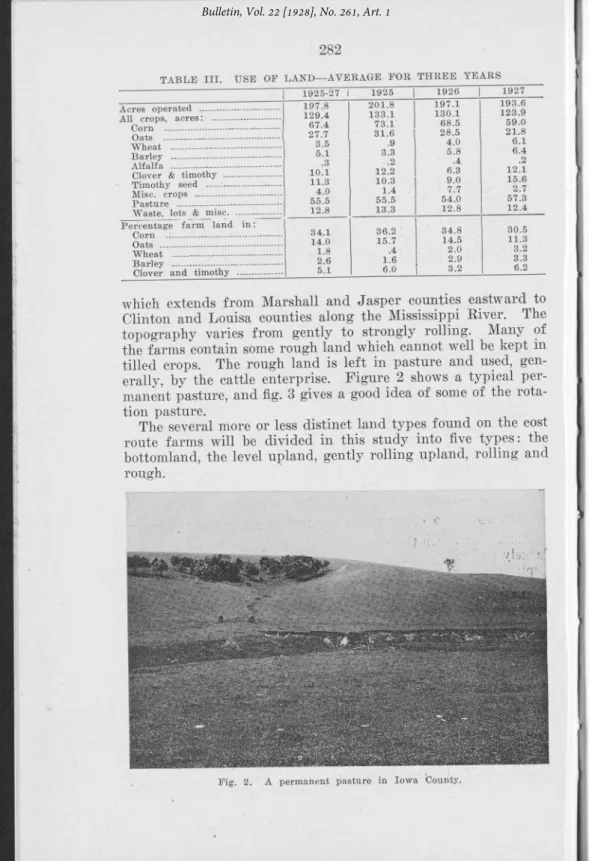
which extends from Marshall and Jasper counties eastward to Clinton and Louisa counties along the Mississippi River. The topography varies from gently to strongly rolling. Many of the farms contain some rough land which cannot well be kept in tilled crops. The rough land is left in pasture and used, gen erally, by the cattle enterprise. Figure 2 shows a typical per manent pasture, and fig. 3 gives a good idea of some of the rota
tion pasture. _
The several more or less distinct land types found on the cost route farms w ill be divided in this study into five typ es: the bottomland, the level upland, gently rolling upland, rolling and rough.
Fig. 3. Summer feeding New Mexico steers on an Iowa County rotation pasture.
About one-tenth of the land was bottomland of the Wabash silt loam type along the larger streams. Many of the fields are badly cut up by the streams, or are subject to floods. Conse quently nearly half are kept in permanent pasture. About one- third o f the land was in corn, 12 percent in small grains and 6 or 7 percent in rotation pasture.
I t is believed that this bottomland can stand continuous crop ping better than most other types. Table I V shows that about 60 percent of the land cropped is in corn, 20 percent in small grains and about 20 percent in hay or rotation pasture. This* corresponds to a five-year rotation with three years of corn. But some of the land was kept in corn for four years and some for only two.
On the Wabash loam the corn yield runs high in years of nor mal rainfall, but is seriously reduced in wet years as shown in table V I. Small grains also yield well, but are more likely to lodge than on most of the upland soils. I f the dry and wet years are taken together, as in table V, the average yield over several
TABLE IV . D IS T R IB U T IO N OF LAN D B Y TYPE S OF SOIL AND TOPOGRAPHY Percentage of total land acreage
Corn
Small
grain Hay
Timothy
seed Pasture Alfalfa
Bottomland 1 34 12 2 52 |
Level upland 46 27 7 11 7 2
Slightly rolling 38 22 1 9 • 4 ! 24 4
Rolling .40 22 12 3 23
Rough 22- 9 5 3 60
Percentage of land in çrops
Corn . Small grain
.. . ....
| Hay Timothy ■seed . Rotationpasture Alfalfa
Bottomland 60 22 5 .13 .
Level upland 46 28 7 11 6. 2
Slightly rolling 41 22 . 10 4 • 19 4 '
Rolling 43 23 12 3 19
284
TAB LE Y . CROP Y IE L D S PROM VAR IO U S TYPE S OF SOIL AND TOPO G R A P H Y— FOUR Y E A R AVERAGE, 1925-1928.
Corn Oats Wheat Barley Hay
Timothy seed
bu. hu. bu. bu. tons lbs.
Bottomland 53.0 48.7 27.0 24.0 1.1
Level upland 53.2 45.0 18.7 34.3 1.5 230
Slightly rolling 59.5 46.8 25.4 29.1 1.4 228
Rolling 60.3 49.1 20.9 37.8 1.0 219
Rough 53.7 37.4 28.1 .9' 237
years on this type, especially on fields not well drained, is likely to run lower than on the upland soils.
About one-tenth of the land was level upland of the Musca tine ""silt loam type. This soil is highly retentive of moisture. F o r the entire period from 1925-1928 the yields of the various crops on the Muscatine silt loam averaged about the same as on the bottoms, except from wheat and barley, which occurred in acreages too small to give a representative yield.
On the level upland there was a much smaller percentage of land in pasture than on the bottomland, and a larger proportion was in some sort of a cropping system. Forty-six percent was in corn, 28 percent in small grains, 7 percent in hay and 11 per cent in timothy for seed. This corresponds to a four-year rota tion with two years of corn on some of the farms and to a five- year rotation with two years of corn on the others.
About seven-tenths of the total land is of the Tama silt loam. In studying the influence of topography on cropping systems and yields this land was divided into two types, the gently roll ing and the rolling upland. The gently rolling comprised four- tenths, and the more strongly rolling about three-tenths of all the land.
Tables V and V I show that these two classes contain the most highly productive lanck of the area i f we average together wet years and dry. As an average of the four years the better drained Tama silt loam soils yielded about 6 bushels more than the two level types of bottomland and upland. W ith small grains and hay there was little noticeable difference in yields.
The crop acreages on the Tama silt loam correspond essen tially to a five-year rotation with two years of corn, one of small grain, one of hay and one of pasture. Slightly over 40 percent of the land was in corn, 22 or 23 percent in small grains, 10 or 12 percent in hay and about 19 percent in rotation pasture, besides 4 or 5 percent in permanent pasture.
About one-tenth of the land was classified as rough or sharply rolling. This was mostly o f the Clinton silt loam type. Forty percent of this land was kept in permanent pasture. O f the land included in the crop system 37 percent was in corn, 15
per-cent in small grains, 9 perper-cent in hay, 5 perper-cent in timothy for seed and 32 percent in rotation pasture.
The variation in the cropping systems found in 21 rough fields on nine farms reflected the difficulty of working them and in getting them back into a good stand of grass after they were plowed up. Twelve of the fields were in corn for two years but of five. Eight were in corn for only one year. Most were in small grains fo r one year and a crop of hay was cut from about half the fields before they were turned back into pasture. On about a quarter of the fields the grass failed to give a good stand and the field was put back in crops after one year.
IOWA COUNTY CROP ROTATIONS
Many rotations or sequences of crops were found. Some farms had more or less regular rotations. Several farms had more than one rotation. One had seven distinct sequences of crops in different fields. However, most of the cropping systems may be fitted into four fa irly distinct rotations. These are determined partly by the type of soil and topography, partly by the-relative value of the different crops, but with the exercise of consider able choice by the farmer.
The moste:intensive common system of cropping was found on the bottomland. A large part of this land was kept in corn for three successive years, followed by one year of small grain and then one year of hay or pasture. This system was also followed on about a quarter of the upland.
Most of the level upland was kept in corn for two years, fo l lowed by one year of small grain, one year of hay and one of pasture. This was the most common of all the rotations and was found on all the types of land. I t keeps 40 percent of the land in corn, in contrast with 60 percent in the intensive bottom land rotation.
Another rotation, found less often but on all the types of soil, consisted of two years in corn, one in small grain and one in hay or pasture. This system keeps 50 percent in corn and, conse quently, is more highly profitable than the second rotation dis cussed.
The fourth rotation was found chiefly on the rough land, which it was desired to keep in pasture a large part of the time' It. consists of two years of corn, one of small grain and three of hay and pasture.
O f the crops mentioned, corn fills the central place in the systems. I t is the crop of highest value per acre and provides the main source of feed! Oats and barley are used, for the most part, to supplement corn as a feed. The wheat, however, provides a crop prim arily for sale and, thereby, differs in its
chief function from the other crops, which lead to a cash income only indirectly thru the livestock. Even on the farms which pro duce only livestock fo r sale, the small grains form a necessary part of the rotation since they serve as a nurse crop for the hay and pasture.
The Corn Crop
Corn is the main crop of Iowa County, because of the large production per acre, both in quantity of feed and value. The average yields fo r the county fo r the years 1925 to 1927 were 51, 45 and 37 bushels. The yields on the cost route farms were 63.3, 55.8 and 50.7 bushels in the same years.
Table I shows that corn is a crop of high value as well as of high productivity in physical terms. W ith a yield of 40.4 bush els and an average price for the five years (1923 to 1927) of 68 cents, the' corn crop was worth on an average $27.47 per acre. Oats, yielding 37 bushels, were worth $12.95. per acre and bar ley, with an average yield of 29.6 bushels, was worth $17.76.
I t was found that the different soil and topographic types varied in their yields from year to year. The yield on the bottomland was reduced by flooding in 1927 and 1928. Table V I shows that there was much more uniformity in yield on the rolling upland than the bottomland or level upland.
Altho corn is the crop which ordinarily yields the greatest value per acre, the number of years a field can profitably be kept in this crop is limited. I t is commonly believed that con tinuous cropping results in reduced yields. A n attempt was made to study this influence from the records, with the results shown in table V I I . In the first column of this table are shown the average yields per acre on fields in corn one, two, three or four years. I t w ill be seen that the second year corn yielded about 2 bushels per acre less than the first year. The fields in com fo r a third year yielded about 5 bushels less than in the second. In the fourth year the yield was reduced by another 10 bushels.
However, the comparison of the yields on fields in corn one, two or more years does not give an altogether accurate compari son because different fields were included in different. groups. Consequently it was decided to compare the yields thruout the
TAB LE V I. V A R IA T IO N S IN CORN Y IE L D S ON D IFFER EN T TO PO G R APH Y TYPE S Year Bottom land Level upland Slightly
rolling ■Rolling. j Rough
bn. bu. bu. bu. bu.
1925 66.8 62.4 61.4 63.7 58.5 1
1926 57.3 54.4 58.7 ; . 56.3 49.5
1927 46.7 43.4 1 55.4 55.2 55.1
287
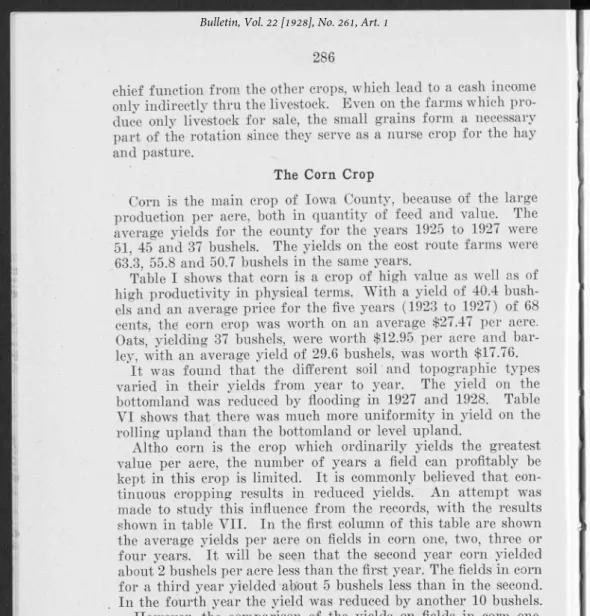
TABLE V II. D ECLINE IN CORN Y IE L D PROM CONTINUOUS CROPPING
Fields in corn three years
Fields in corn four years Av. yield by years Acres Variation from av. yield of year Acres Variation from av. yield of year First year
in corn 56.6 bu. 365 + 5 .3 bu. 90 + 7.2 bu.
Second year 55.0 365 +1 .5 90 + -1
Third year 50.2 346 — 4.3 81 — 1.3
Fourth year 40.1 81 — 10.0
period on just those fields which were in corn three or four years. The third and fifth columns in table V I I show how the yield in these fields compared with the average yield for the years in question.
On the fields in corn fo r three years, the yield in the first year was 5.3 bushels above the average on all farms fo r the year. In the second year it was 1.5 bushels above the average, and in the third year it was 4.3 bushels below the average. This makes a decline of 9.6 bushels in the three years. In the fields in com for four years, the yield declined 8.5 bushels in the first three years, and another 8.7 bushels in the fourth^ making a decline of 17 bushels in four years.
O f course these data do not warrant sweeping conclusions be cause of the small number of fields included. However, the re sults are remarkably consistent for all the different topographic types. The same trend is clearly evident in nearly every case. Since this is true, it seems a very doubtful policy to count on putting corn in the rotation fo r more than two consecutive years. According to these figures, a five-year rotation with three years of corn would produce only about 10 percent more grain than a four-year rotation with two years of corn. Besides this, there would be a smaller forage and pasture production.
REQUIREMENTS IN PRODUCTION
The average amounts of man labor, horse work and the other cost factors used per acre in producing corn on the cost route farms are shown in table V I I I . Since the yields on these farms are somewhat above the average, it is thought these figures may serve as reasonably good guides of performance fo r other farmers under equally favorable conditions.
Including the fa ll plowing,_an average of 10.9 hours of labor per acre was used in growing the corn up to the tim e.it was picked. On the bulk of the farms this was between 8 and 12 hours per acre. In picking the corn an average o f 7.8 hours was used and the bulk of the farms fe ll between 5 and 8.5 hours per acre.
288
The elements o f the costs of producing the corn other than the labor, horse labor and materials can be expressed in terms of value only. F or the three years of the study the man labor aver aged $5.46, which includes $3.15 in growing, i f we include the fa ll plowing, and $2.31 in picking the crop. The horse labor was valued at $3.46 in growing the crop and 2.00 in picking. The depreciation, interest and upkeep of the equipment amounted to $2.53. A n hour of tractor use cost 98 cents, and miscellaneous expenses amounted to $1.72. These expenses to gether amounted to $19.54, which may be called the total operat ing cost per acre.
The operating expense is one of the most significant indexes of efficiency that the records yield, since it represents the combina tion of all the expense factors together. Since these expense fac tors are largely controlled by the farmer, the total operating expense shows how successful he has been in operating econom ically. The operating expense ranged from $7.66 to $34.51 per acre, but over two-thirds were between $17.00 and $25.00. The operating expense is closely associated with the cost per bushel
TA B LE V I I I . CORN— P H Y S IC A L AND F IN A N C IA L COSTS P E R ACRE
Average ' Range— 1927
1925-27 1925 1926 1927 Low High
Cost per bu... SB $ -4 64 .409 .490 .525 .427 .607
Physical costs growing ... Labor hours ... 10.9 11.2 11.1 10.1 7.5 12.1 Horse hours ... 25.3 26.9 24.6 24.1 17.0 33.0 Tractor hours 1.0 1.1 1.0 .9 1.7 Manure tons ... .6 .4 .7 .6 .1 1.4 Pi kihg, 7.8 8.8 ■ 7.4 6.7 4.9 9.5 Horse hours -... 14.6 16.1 14.8 12.2 , 9.5 17.1 Financial costs1 Growing Seed, cost ...--- $ .49 .47 .54 .46 .32 .51 Labor cost ... $ 3.15 3.25 3.07 2.82 2.05 3.77 Horse cost ... $ 3.46 3.77 3.47 3.26 1.75 5.13 Equipment charge $ 1.59 1.74 1.67 1.29 .90 2.35 $ .93 .90 1.00 1.06 1.79 Manure cost ...— $ 2.56 .92 3.29 3.84 .29 6.12 Misc. costs $ 1.37 1.18 1.35 1.45 .57 2.59
Total cost growing $13.55 12.23 14.47 14.18 9.71 17.37
Total acres raised 71.1 76.1 ’ 70.3 65.9 32.9 99.4
Picking
Labor cost ... $ 2.31 2.77 2.08 1.96 1.43 2.85.
Horse cost ... I 2.00 1 2.20 2.07 1.63 1.07 2.90
Equipment charge $ .94 .98 1.00 .80 .48 1.52
Misc, costs ... $ .73 .70 .65 .68 .21 . 1.68
Total cost picking $ 5.99 6.63 5.81 5.07 3.75 8.80
Total operating cost $19.54 18.86 20.28 19.25 14.40 26.60
Building charge $ .74 .83 .68 .67 .27. 1.16 Land charge ... $ 7.17 692 7.14 7.55‘ 5.40 10.15 Gross , cost .... ... $27.45 26.61 28.10 27.47 20.18 36.43 Stalk credit ... $ .86 .92 .74 .91 .60 1.25 Net cost ... $26.59 25.69 27.36 26.56 19.17 35.11 Acres picked ... 52.3 56.9 50.8 48.7 15.0 86.0
289
of corn. Before finding the cost per bushel it is necessary to add the fixed charges, which consisted of the charge for the use of the land, averaging $7.17, and the charge fo r the use of buildings, which amounted to 74 cents. This gives the total expense from which the credits fo r stover or stalk pasture are deducted to find the net cost of the grain.
The cost per bushel is to be considered, not as the exact and absolute cost, but merely as an index fo r comparison o f different farms. Cost per bushel combines the operating expense with the fixed charges, as fo r land and building use, and is also influ enced by the yield.
During the three years of the study the cost per bushel varied from 27.6 to 93.4 cents.. The averages were 40.6 cents fo r 1925, 49.6 cents for 1926 and 52.5 cents fo r 1927. The greater part of this variation may be attributed to differences in the yields, which averaged 63.3 bu. in 1925, 55.8 in 1926 and 50.7 in 1927. These yields were 10 to 13 bushels higher than fo r the county as a whole, and are some indication of the superiority of the cost route farms. On about two-thirds of the farms the cost per bushel was within 5 cents of the average fo r the year. But even among this group of efficient farmers, some were producing their main crop at a fourth less cost per bushel than others. Bach year the corn on a few farms cost twice as much per bushel as on others.
HOW EFFICIENT FARMERS REDUCED THE COST
The costs were kept down in many ways on the more efficient farms. Choosing high yielding varieties and testing of the seed in order to make a good stand undoubtedly* had a notable influ encé, but the amount of their influence can hardly be measured. In raising the crop the right choice of equipment and sizes of teams reduced the labor and expense. This usually meant the use of large teams and large capacity machines, as w ill be dis cussed more at length in another bulletin on the use o f power on the crops. The two-row cultivator was found to save about three-quarters of an hour of man labor per acre each time the corn was cultivated. W ith three cultivations the saving in man and horse labor amounted to about 70 cents per acre. The corn pickers, on the two farms using them, did not save appreciable amounts of labor or expense. Improved types of machines may change this in the future, however.
Occasionally it was possible to save expense by avoiding un necessary. operations. In a few cases where it. was free from weeds, the corn was cultivated only twice. This was sometimes made possible by attempting to kill the weeds by extra work be fore the crop was planted. Commonly three cultivations Were
290
used and often even four. This involves a question of judgment in deciding on the needs of the crop and how fa r it w ill pay to go in meeting them. The same applies to the fitting of the seed bed However, the farms with the lowest corn cost did not al ways have the least labor per acre. Frequently the low cost was obtained by getting higher yields. These often seemed to come partly from doing the needed work at just the right time and m the most effective manner. In a good many cases the soil treat ment, dr the strain and virility of seed corn, which helped m getting the good stand, seemed the outstanding causes of the low costs. Effectiveness in the use of labor was only one of the con tributing causes. Among the six consistently low cost farms dur ing the three years, the differences in yield were responsible for slightly over half the difference in the cost of corn per bushel while the difference in the amount of labor and horse work ac- county for only about one-eighth.
SEASONAL LABOR REQUIREMENTS ON CORN
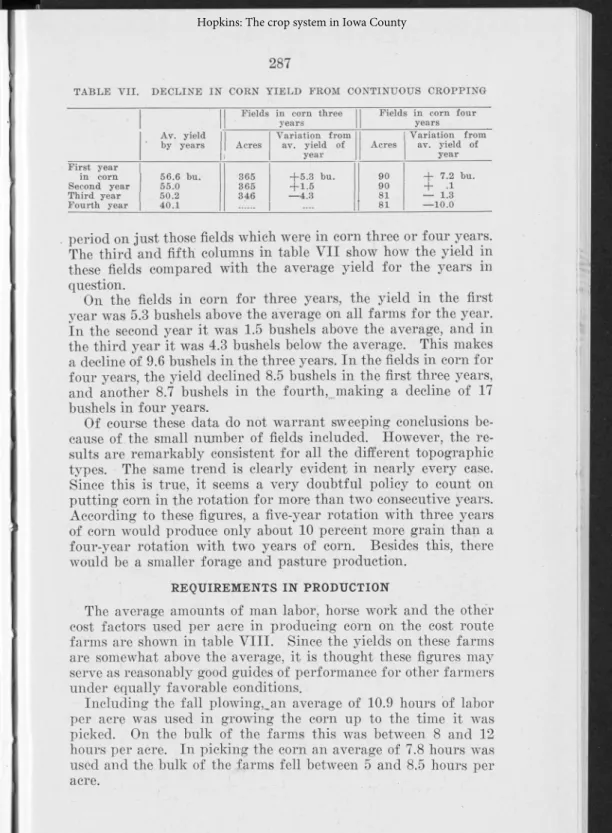
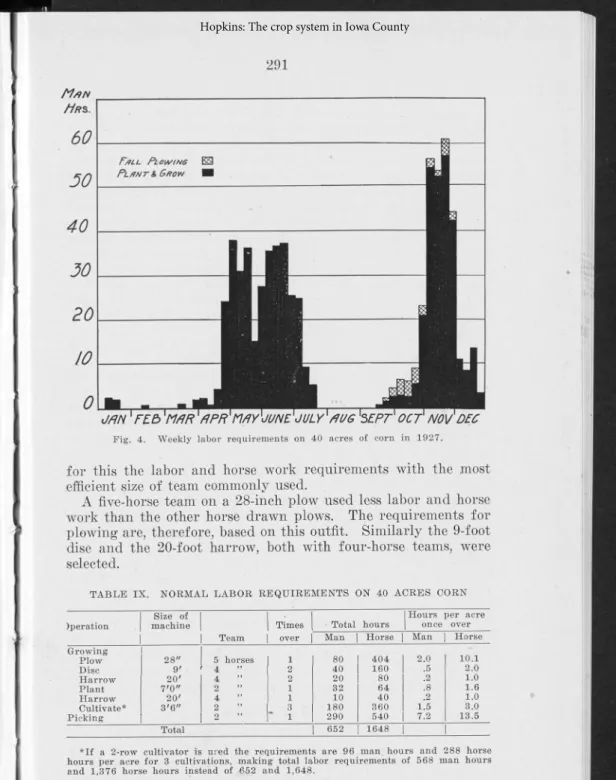
In planning for the crop it is necessary to consider the season when its 'demands fo r labor and horse work are heaviest. Figure 4 shows the labor required to grow a 40-acre field of corn on the typical farms of the cost route. I t w ill be observed that at two periods of the year the labor requirements are high. The first of these is from the early part of May to the middle of July. This covers the planting of the crop and its cultivation. For most of the period it runs up to almost 36 hours of man labor and between 100 and 120 hours of horse work per week. A t this time a heavy use was made of the tractor fo r plowing and disc ing in addition to the horses. . „
The second peak period of labor requirement on corn is from the first of November to the middle of December. From 20 to 60 hours per week were spent in picking the corn. A long with this about 100 hours of horse work were used per week.
One man with a five-horse team should be able, by spending all his time on the corn crop, to plant and take care of between 50 and 60 acres of corn. The demands of the other enterprises on a well balanced farm w ill prevent handling much more than this, as w ill be seen later on when the labor requirements of a crop system w ill be shown. I t should not be forgotten that there was a. wide range in the amounts of labor used on the different
farms. .
Table I X shows what may be considered normal requirements fo r labor in the production of a 40-acre field of corn. These have been computed /by, taking the most common number of times that each operation was performed, and then computing
291
M/)n
/ÍR%.
Fig. 4. Weekly labor requirements on 40 acres of corn in 192.7.
fo r this the labor and horse work requirements with the most efficient size of team commonly used.
A five-horse team on a 28-inch plow used less labor and horse work than the other horse drawn plows. The requirements for plowing are, therefore, based on this outfit. Similarly the 9-foot disc and the 20-foot harrow, both with four-horse teams, were selected.
TABLE IX . NORMAL LAB O R REQUIREM ENTS ON 40 ACRES CORN
Iperation machineSize of Times Total hours
Hours per acre once over
Team over Man Horse Man Horse
Growing Plow 28" 5 horses 1 80 404 2.0 10.1 Disc 9' 4 2 40 160 .5 2.0 Harrow 20' 4 2 20 80 .2 1.0 Plant 7'0" 2 1 32 64 .8 1.6 Harrow 20' 4 1 10 40 .2 1.0 Cultivate* 3'6" 2 ” - 3 - 180 360 1.5 3.0 Picking 2 r i ■ 290 540 7.2 13.5 Total 652 1648
* I f a 2-row cultivator is ured the requirements are 96 man_ hours and 288 horse hours per acre for 3 cultivations, making total labor requirements of 568 man hours and 1,376 horse hours instead of 652 and 1,648.
292
The most common number of times each operation was per formed was twice over with the disc, twice over with the harrow before and once after planting, and three cultivations.
Counting on an eight-hour day in the field, 10 days time for one man would be required to plow the 40 acres. F ive days would be needed to disc, two and a half to harrow, and three days to plant the corn. This makes 20% days, or about three and a half weeks, to fit and plant the seedbed.
A fte r planting, slightly over a day would be needed to har row the 40 acres before the corn comes up. I f a one-row culti vator is used, 21 days would be needed to cultivate three times. I f a two-row cultivator is used, 12 days would be sufficient.
In the fa ll a man and team would be kept busy about 35 days, or a month and a half, picking the corn. In all, the 40 acres of corn may be considered as taking, about 82 days of labor if cultivated with a one-row cultivator, or 72 days with a two-row. A tractor and three-bottom plow used instead of the four-horse 28-inch plow-would reduce, the requirements by about five days. A 10-foot disc pulled by a tractor may be expected to reduce the labor fo r discing by two days.
. On a farm with a tractor and six horses it would be possible for two men, one using the tractor and the other the horses, to raise 80 acres o f com with 68 days of labor for the two men, counting the day as eight hours in the field.
Manure is applied to a part of the corn acreage only. On the cost route farms, the manure applications averaged between 2% and 3 tons per acre for the whole corn acreage, or about 6 to 8 tons per acre on those acres covered. About two-thirds of this was applied to the crop preceding the corn, usually hay or pasture.
Manure should be applied to a greater acreage o f the corn land, and it is thought that by more care in the conservation and the handling of the manure some increase in application might be possible. Since there are usually two successive years of corn in the rotation, this same amount of manure applied at the rate of about 4 tons per acre to the sod preceding the first year; of com, or else in the first year o f the corn crop, would give the largest results. A n application of 6 or 7 tons over the entire field, however, would be much preferable.
COSTS OF SILAGE
On about half the farms in each of the three years, part of the corn crop was put into the silo. F or the three years this aver aged 16.9 acres per farm on the farms where silage was made. The yield averaged 8.2 tons per acre fo r the three years, but was 9.1 tons in 1925, 7.5 tons in 1926 and 8.1 tons in 1927. The
293
TAB LE X. COST OF SILAG E— 1925 TO 1927
| Average | j \ | Range— 1927
1925-27 1925 1926 1927 ■ Low High
Av. cost per ton ... $ 3.95 3.63 4.32 3.55 2.80 4.30
No. farms ...:... 29 9 11 9
Acres ... ... 16.9 14.6 14.1 17.1 5.9 32.0
Tons per acre ... ... 8.2 9.1 7.5 8.1 6.4 9.8
Bu. corn per ton ... 6.3 6.4 6.8 5.7 5.0 6.9
Cost growing per acre... $21.86 14.80 20.48 22.03 16.48 25.35 Physical costs Labor hrs... 15.2 17.0 16.0 12.4 10.4 16.6 Horse hrs... 23.8 27.4 . 23.0 20.4 16.4 21.8 Twine lbs. ... 3.4 3.7 2.7 3.8.. 2.1- 4.7 Financial costs . Labor cost ... $ 4.44 $ 5.17 $ 4.55 $ 3.-50 $ -2.21 $ 4.99 Horse cost ... 3.18 3.65 2.97 2.66 1.64 3.50 Equip, cost ... 1.34 1.58 1.26 1.00 .60 1.45 Machine charge ... .... 2.94 3.46 2.86 2.72 1.97 4.67 Twine cost ... .47 .51 .39 .49 .29 .59 Misc. exp... 1.64 1.64 .92 1.24 .70 1.66 Use of silo ... 1.43 2.05 1.37 1.17 .64 2.42 Gross cost ... $37.31 37.55 35.83 34.81 26.36 39.78 Credit— corn picked up .... 4.81 4.67 3.41 5.90 3.46 7.55 Net cost of silage per acre 32.50 32.88 32.42 ' 28.91 22.90 33.22 Cost of ensiling per ton... 1.70 1.77 1.86 1.43 1.21 1.89 Cost of ensiling per acre 14.01 16.01 12.95 11.61
total cost of the silage varied inversely with the yield. Table X shows that in 1925 the cost-per-ton index was $3.63. In 1926 it was $4.32 and in 1927 it was $3.55, with an -average fo r the three years of $3.95. On about three-fifths of the farms the yield varied from 7 to 10 tons per acre and the cost per ton from $3.25 to $5.00.
The average cost of growing corn was about $22.00 per acre. Where the yield was large and this $22.00 was divided among a large number of tons per acre, the cost per ton was less than with a smaller yield. The ensiling cost ayeraged about $14.00 per acre, or $1.70 per ton, varying from $1.14 to $2.44 per ton. I t required about 15 hours of man labor and 24 hours of horse work, costing an average of $4.44 and $3.18, respectively. In addition to these expenses it is necessary to count on using about 3.4 pounds of twine, costing about 50 cents. The machine cost an average of $2.94 per acre of corn or, 48 cents per ton. In addition to this* there was an expense of $1.34 for regular farm equipment used in silo filling, $1.43 fo r interest and deprecia tion on the silo, and about $1.64 for miscellaneous expense.
METHODS OF HARVESTING
Out of the 4,409 acres of com grown on the cost route in the three years of the records, 3,245 acres were picked for grain, 440 acres were cut fo r silage, 331 were cut fo r fodder and most of the rest was hogged-down.
I t is interesting to compare the labor used in these different methods of harvesting. W here the corn was picked an average
TABLE X I. FODDER SHREDDED— COSTS AND Y IE L D S P E R ACRE
Average | | | | Range— 1927
1925-27 1925 1926 1927 Low High
11 8 10
Acres ... 11.4 14.6 12.2 7.3 2.9 12.0 Cost growing per acre ---- $19.07 17.50 19.06 22.57 16.06 24.83 Physical costs
3.1 2.9 3.1 3.4 4.8
Labor hrs... 18.2 17.1 19.4 18.8 13.8 24.4 Horse hrs... 18.3 17.9 18.9 18.5 13.0 27.7 Expenses of cutting and
shredding Machine chg... $ 1.96 1.39 2.67 2.28 0 3.06 Fuel ... -... .37 .20 .71 .31 0 .86 Twine colt ... .41 .40 .41 .43 0 .58 Labor cost ... 5.16 5.06 5.11 5.48 3.83 7.21 Horse cost ... 2.66 2.69 2.54 2.74 1.85 3.99 Equipment ... |... 1.16 1.15 1.27 1.14 .95 1.39 Misc. exp... 1.84 1.70 1.49 2.60 1.07- 4.63 Total cost of shredding ... $13.59 12.58 14.21 14.98 11.22 19.42 Yield corn, bu... 51.3 49.0 49.8 52.1 44.0 66.7 Fodder, tons ... 1.6 1.5 1.6 1.8 1.5 2.0
of 7.8 hours of labor and 14.6 hours of horse labor was used per acre. The total cost of picking averaged $6.00 per acre, or IOV2
cents per bushel.
Most of the labor of hogging-down corn went for the con struction and moving of temporary fences. On 13 farms on which records were obtained on the hogging-down of corn in 1927, an average of one hour of labor and one-half hour o f horse labor was used per acre. The expense per acre, computed in the same manner as for corn picked, averaged 36 cents and in the extreme case was about 90 cents.
When the corn was cut and shredded fo r fodder an average of 18.2 hours of labor and 18.3 hours of horse labor was required during the three years for the whole operation, as is given in table X I.
The labor was valued at $5.16 and the horse labor at $2.66. The use of the machine and engine cost an average o f $1.96 per acre. Other items brought the total expense of cutting and shredding up to $13.59 per acre. More than twice as much labor was required as to pick the corn from the stalks. The added labor and expense, valued at $7.50, yielded 1.6 tons of shredded fodder.
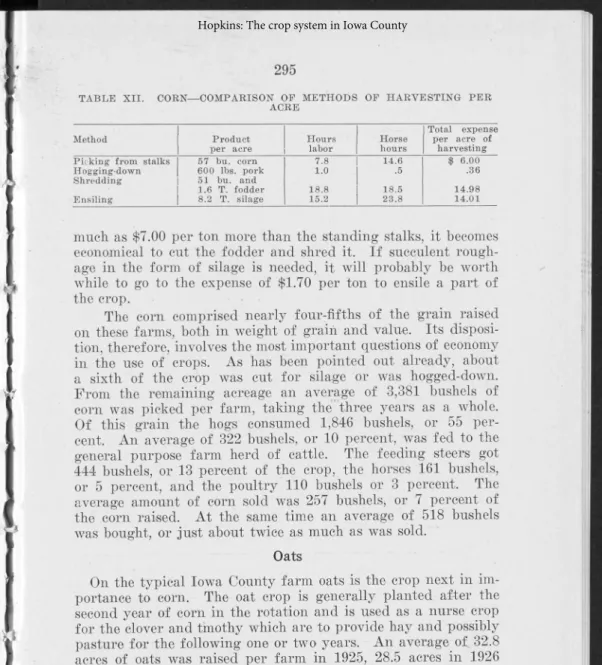
The costs and the results of the different methods of harvest ing the corn crop, taking the data of the three years together, are shown in table X I I .
A large saving occurred both in time and expense where the corn was harvested in the simpler ways of hogging-down or picking. But, of course, the preferable method in any particu lar case w ill depend on the purpose fo r which the corn is used. I f the roughage is needed and the fodder seems to be worth as
295
TABLE X II. CORN— COMPARISON OF METHODS OF H AR VE STIN G P E R ACRE Method Product per acre Hours labor Horse hours Total expense per acre of harvesting
Picking from stalks 57 bu. corn 7.8 14.6 $ 6.00
I I ogging-down 600 lbs. pork 1.0 .5 .36
Shredding 51 bu. and
1.6 T. fodder 18.8 18.5 14.98
Ensiling 8.2 T. silage 15.2 23.8 14.01
much as $7.00 per ton more than the standing stalks, it becomes economical to cut the fodder and shred it. I f succulent rough- age in the form of silage is needed, it w ill probably be worth while to go to the expense of $1.70 per ton to ensile a part of the crop.
The corn comprised nearly four-fifths of the grain raised on these farms, both in weight of grain and value. Its disposi tion, therefore, involves the most important questions of economy in the use of crops. As has been pointed out already, about a sixth of the crop was cut fo r silage or was hogged-down. From the remaining acreage an average of 3,381 bushels of com was picked per farm, taking the" three years as a whole. O f this grain the hogs consumed 1,846 bushels, or 55 per cent. A n average of 322 bushels, or 10 percent, was fed to the general purpose farm herd of cattle. The feeding steers got 444 bushels, or 13 percent of the crop, the horses 161 bushels, or 5 percent, and the poultry 110 bushels or 3 percent. The average amount of com sold was 257 bushels* or 7 percent of the corn raised. A t the same time an average of 518 bushels was bought, or just about twice as much as was sold.
Oats
On the typical Iowa County farm oats is the crop next in im portance to corn. The oat crop is generally planted after the second year of corn in the rotation and is used as a nurse crop for the clover and timothy which are to provide hay and possibly pasture for the following one or two years. A n average o£ 32.8 acres of oats was raised per farm in 1925, 28.5 acres in 1926 and 21.8 acres in 1927. Compare this with the average of 76 acres o f corn per farm. The yields averaged 46.1 bushels per acre in 1925, 42.7 in 1926 and 44 bushels in 1927. The average yields fo r the county fo r the same years were 41, 34 and 36 bushels. A t the prices prevailing in these years, the crop was worth $13.53 in 1925, $10.20 in 1926 and $14.40 in 1927. Corn in the same years averaged $27.83, $23.90 and $27.38. F or the five years, 1923 to 1927, the average value of the crop per acre at
296
prices on farms was $12.95 fo r oats, $17.76 for barley, $23.94 fo r wheat and $27.47 fo r corn.
REQUIREMENTS IN THE PRODUCTION OF OATS
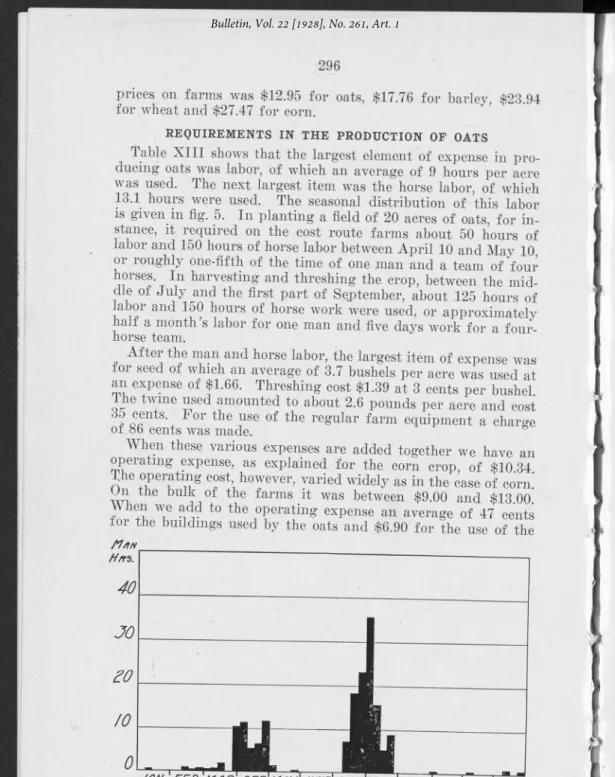
Table X I I I shows that the largest element of expense in pro ducing oats was labor, of which an average of 9 hours per acre was used. The next largest item was the horse labor, of which 13.1 hours were used. The seasonal distribution of this labor is given in fig. 5. In planting a field of 20 acres of oats, for in stance, it required on the cost route farms about 50 hours of labor and 150 hours of horse labor between A p ril 10 and May 10 or roughly one-fifth of the time o f one man and a team of four horses. In harvesting and threshing the crop, between the mid dle of July and the first part of September, about 125 hours o f labor and 150 hours of horse work were used, or approximately halt a month’s labor fo r one man and five days work for a four- horse team.
A fte r the man and horse labor, the largest item of expense was or seed of which an average of 3.7 bushels per acre was used at an .expense of $1.66. Threshing cost $1.39 at 3 cents per bushel The twine used amounted to about 2.6 pounds per acre and cost 35 cents. F or the use o f the regular farm equipment a charge ot ob cents was made.
When, these various expenses are added together we have an operating expense, as explained for the corn crop, of $10.34. The operating cost however, varied widely as in the case of corn! un tne bulk of the farms it was between $9.00 and $13.00.
K - to the operatillg expense an average of 47 cents fo r the buildings used by the oats and $6.90 for the use of the
f l / l N ///?$.
40
JO
J O / 0 0297
TABLE X III. OATS— P H Y S IC A L AND F IN A N C IA L COSTS P E R ACRE
Average Range— 1927
1925-27 1925 1926 1927 Low High
Cost per bu... $ .349 .342 .341 .383 .256 .613
Acres ... 28.2 32.6 30.2 19.8 4.7 42.4 Yield, bu... 44.1 46.1 42.7 44.0 29.4 70.5 Physical costs Seed bu... 3.7 3.7 3.6 3.7 2.9 5.3 Twine lbs... 2.6 2.5 2.5 3,i 1 2.5 3.8 Man hrs. ... 9.0 9.5 9.2 O ¿ 6.1 12.0 Horse hrs... . 13.1 13.4 13.1 12.8 10.4 19.3 Tractor hrs. ... .5 •7 .4 .3 0 1.7 Financial costs Seed cost ... $ 1.66 1.98 1.44 1.47 1.07 2.01 Labor - cost ... 2.57 2.75 2.52 2.31 1.74 3.84 Horse- cost ... 1.79 1.89 1.76 1.71 1.02 3.13 Equip. vchg... .86 .93 .86 .72 .36 1.70 Tractor cost ... .40 .46 .39 .29 0 2.19 Threshing ... 1.39 1.46 1.30 1.45 .88 2.10 Misc. exp... 1.67 1.25 1.56 2.83 .71 8.47
Gross opr. cost ... $10.34 10.69 9.83 10.79 7.49 16.28
Bldg, chg... .47 .53 .39 .52 0 1.73 Land chg... 6.90 6.80 6.79 7.89 5.33 10.15 Gross exp... $17.72 17.87 '17.01 19.20 14.88 25.64 Straw credit ... $ 2.04 1.70 2.33 . 2.48 1.64 3.66 Pasture credit ... .29 .51 .11 .09 0 .42 Net expense ... 15.39 15.78 14.57 16.63 13.04 22.67
land, we have a gross expense per acre of $17.72, which may be said to indicate the approximate portion of the expenses on the farms in question which may be attributed to the oats. A fte r deducting credit fo r the straw, the gross expense is about 35 cents per bushel of oats.
These figures of expense should be considered prim arily as in dexes comparable with the corresponding figures on other farms. They may fa irly be compared to the corresponding expenses on other alternative small grain crops, especially spring crops. But they do not represent an absolute cost, nor can they be compared to the costs per acre or per bushel on corn or other crops.
Figures 6 and 7 show the distribution o f labor on the barley and wheat during the three years of the cost study.
Table X I V shows the labor and horse use requirements which we might expect on a reasonably efficient farm in raising a 20- acre field of oats, barley or wheat. The records show that the m ajority o f the fields were disced twice fo r small grain crops and harrowed once. The 9-foot disc, 11-foot grain drill, 20-foot
TAB LE X IV . NORMAL REQUIREM ENTS IN R A IS IN G 20 ACRES OATS
W H E A T OR B A R L E Y _ ’
Operation machineSize of Team Timesover hoursMan ■ Horse hours
Disc ... 9' . 4 horses 2 r 20 80 Harrow ... . 20' 4 ” : l' 5 Plant ... Cutting ...1... -11' .. 8' 44 l 1 ■ 1216 50 Shocking ... 30 Threshing ... 82 84 Total ________ ' ________ • '• • ________ j , 165 | 298
298
harrow and 8-foot binder were the most efficient of the com monly used implements, and the four-horse team seemed in gen eral, the most efficient and easily managed. Where an endgate seeder was used in planting, however, the labor requirement was only about half as much as with the grain drill.
I t may be considered that with the teams and machines named it would ordinarily take five eight-hour days to disc the land, one day to harrow it and three days to sow. Three men would be required for four days to cut and shock. Threshing may be expected to take just half the labor of producing the crop, re quiring a crew of about nine men and five teams for between a day and a half and a day and three-quarters. Figures 6 and 7 show the weekly distribution of labor in 1927 on the fields of oats and barley ^
Barley is a crop competing directly with oats in its labor re quirements and in the time of year during which it uses the land. In each of the three years of the cost study, some barley was grown on from a third to a half of the farms on the route. In 1925 the average size of the fields o f barley on the route farms was 9.9 acres. In 1926 it was 17.3 acres. In 1927 the fields averaged 12 acres. In 1928 it appeared from observation that the typical field had been increased considerably and it was quite clear that barley was being grown on many more farms than in the earlier years.
Generally the barley crop in Iowa County has yielded more pounds of feed per acre than has the oat crop. Thus the aver age yield of oats fo r the county for the five years, 1923 to 1927,
///5W Barley
40
m
JO
m
o
| T--- — ---1---<JF?N Fl o n n n f ir t r n //y uunl oi/l x ffU6 SEP/ OCT NOV DEC
n » N tin s
299
M E L P ftE P fifflfT /O M
H *ttv£sr t Thresh
JfiNX
f £ 3
1 / W
/¡PF?
may'JUNE 'jULY'fiUG '
dept'
octtnovydecFig. 7. Average weekly distribution of labor on 20 acres wheat in 1927.
was 37 bushels, while the average barley yield was 29.6 bushels. A t this rate the oat crop weighed an average of 1,184 pounds and barley, 1,420 pounds. On the cost'route farms the average yield of oats fo r the three years, 1925 to 1927, was 44.3 bushels, or 1,418 pounds of grain; of barley, 33 bushels, or 1,584 pounds of grain.
Because of its higher yield it is worth suggesting seriously the possibility of replacing a part of the oat acreage with barley fo r feed. In some years, however, particularly 1928, many
TABLE XY. B A R L E Y — P H Y S IC A L AND F IN A N C IA L COSTS P E R ACRE I Average | ' f ~ ~ T ' | Range— 1927
1925-27 1925 1926 1927 Low High
Cost per bu... $ .51 .59 .50 .. .49 .43 .63
Acres ... 13.0 9.9 17.3 . 12.0 2.0 20.0 Yield, bu... 33.4 31.9 35.6 31.6 27.1 37.9 Physical costs Seed, bu... .... 2.4 2.5 2.3 2.5 2.0 3.0 Twine, lbs... 2.7 2.7 2.8 . 2.6 2.4 3.3 -Man, hrs... 9.0 11.1 9.0 7.6 6.0 12.4 Horse, hrs... 14.1 16.0 13.7 13.1 12.6 16.4 Tractor, hrs... .4 .2 .6 .3 0 1.1 Financial costs Seed cost ... $ 1.90 2.83 1.69 1.49 1.32 2.28 Labor cost ... 2.55 3.46 2.51 1.96 1.44 3.11 Horse cost ... 2.05 2.90 1.76 1.81 1.39 2.32 Equip, cost ... .81 1.01 .77 .71 .54 .84 Threshing ... 1.42 1.53 1.42 1.34 1.21 1.50 Misc. exp... 2.50 2.25, 2.73 3.01 .71 7.17
Total opr. cost...
Bldg, chg... 11.23.14 13.14-.20 10.87.22 10.32 9.88 10.78-Land chg. ... 7.94 7.56 8.32 7.75 5.74 8.33 Gross expense ... 119.31 20.89 19.41 18.07 15.40 19.11 Pasture credit ... .36 .29 .24 .57 0 1.07 Straw credit ... 1.90 1.73 1.89 2.03 1.30 2.74 Net expense ... 17.05 18.87 17.28 15.47 13.43 16.98
ers had trouble in feeding barley because of a fungus with which it was affected.
Some small grain was sold to provide a source of cash on most of the farms. Because of the low price of oats in the past few years, either barley or wheat would have brought in more money per acre than oats, as table I discloses.
The cost of producing barley was nearly the same as for oats except fo r two or three items which were slightly higher as shown m table X V . A n average of 2.4 bushels of seed was used at a cost of $1.90, as compared to $1.66 fo r oats. The total operat ing cost of the barley averaged $11.23 an acre as against $10.34 for oats. This was probably due largely to the fact that many of the fields of barley were decidedly smaller than the fields of oats. The land on which the barley was grown was somewhat better than the oats land and the charge fo r rent averaged $7.94 as com pared to $6.90 fo r oats. This brought the gross expense on the barley up to $19.31 per acre, or $1.60 more than for oats. The average index of cost per bushel for barley averaged 51 cents compared to 35 cents fo r oats.
W inter Wheat
In each of the three years of the study five or six of the farms raised some wheat. On these farms the wheat fields averaged 14.3 acres in 1925, 15.5 acres in 1926 and 26.9 acres in 1927. Like barley, there was a tendency fo r the wheat to displace a part of the acreage of oats. This was furthered by the low price of oats and the reasonably satisfactory price of wheat during
301
these years. I t may be seen from table I that the average yield of wheat in the county for the five years, 1923 to 1927, was 21 bushels, which at an average price of $1.14 made the wheat crop worth nearly $24.00 per acre— next in value to corn.
The expenses in the production of wheat, as shown in table X Y I , were usually somewhat higher than for oats. A n average of 1.8 bushels of wheat was planted at an expense of $2.35, or about 70 cents more per acre than for the seed oats. In prepar ing the seedbed and planting an average of 3.3 hours of man labor and 9.7 hours of horse work were used. In harvesting, 8.4 hours of man labor and 8.5 hours of horse labor were used. This makes a total of 11.7 hours of man labor and 18.2 hours of horse labor as compared to a total of 9.0 and 13.1 hours on the oats. The difference is chiefly in the fact that the land was plowed for the wheat on about a third of the farms. Where the crop was seeded after discing and without plowing, the labor requirements were but little higher than fo r oats or barley.
The total operating expense on the wheat averaged $15.38 per acre as compared to $10.34 for the oats. The gross expense
TAB LE X V I. W H EA T— P H Y S IC A L AND F IN A N C IA L COSTS P E R ACRE
1 Average | 1925-27 | 1 1925 | 1 1926 | | Range-- 1927 | Low | -1927 High
Cost per bu. —... $ .86 .68 .90 .91 .80 1.70
18.1 14.3 15.5 26.9 5.9 42.2 Yield - bu... 22.6 26.8 22.4 21.3 11.9 20.0 Fall seeding Physical costs Labor hrs. —... 3.3 3.4 3.2 1.9 6.2 Horse hrs. .... 9.7 8.9 10.1 4.0 10.2 Tractor hrs... .6 .7 .6 0 .9 Seed bus. J-... 1.8 1.8 1.7 1.5 1.9 Financial corts Labor cost ... .92 1.00 .88 .56 1.73 Horse cost ... 1.14 1.18 1.12 .47 1.41 Equip, „chg... .47 .46 .50 .14 .99 Seed cost ... 2.35 2.74 2.15 2.03 2.53 Misc. exp... .70 .99 .54 .06 1.38
Total seeding cost 5.59 5.62* 6.38 5.20 4.11 7.51
Harvesting Physical costs Twine lbs. ,.... 3.1 2.6 3.5 3.0 1.9 3.1 j Labor hrs... 8.4 9.0 8.8 7.9 5.3 7.8 Horse hrs. ... 8.5 8.9 8.1 8.6 7.9 9.1 Tractor hrs... .1 .2 .1 .01 Financial cor ts Labor cost ... $ 2.42 2.80 2.57 2.21 1.47 2.54 Horse cost ___ 1.11 1.21 1.15 1.06 .72 1.31 Equip, chg... .56 .87 .63 .41 .25 .55 Threshing ... 1.26 1.30 1.58 1.07 .83 .98 Misc. exp... 4.43 1.96, 1.68 5.59 .56 6.01
Total opr. cost .... 15.38 13.42 15.89 15.53 11.24 14.31
Bldg, chg... - .05 .06 .06 .03
Land chg. ... 6.99 6.59 7.10 7.07 5.33 7.99
Gross expense —. $22.42 20.05 23.05 22.63 16.02 23.18
Straw credit ... 2.90 1.94 2.75 -3.30 ' 1.70 3.99
Net expense ... 19.52 18.61 20.30 19.32 14.67 20.85
Return on land &
bldgs... 15.40 | 28.71 12.42 12.87 . 2.72 14,32 ‘ Records do not cover .period prior to Jan. 1, 1925, consequently seeding costs were estimated for this year.
302
on the wheat averaged $22.42 as compared to $17.72 fo r oats. The wheat provided a crop worth nearly $32 per acre on the cost route farms as compared to $19 fo r the oats. The purpose served by the two crops in the farm ing system differs somewhat. The oat crop at sowing time tends to compete with the prepara tion of the soil fo r corn. One of the main difficulties in the way of a larger acreage of wheat is that it is difficult to clear the ground of corn in the fa ll in time to prepare the seedbed and plant the crop, which is generally done in September or early October. Where corn is cut for silage or fodder, this problem is solved as fa r as that acreage is concerned.
The purpose of corn and oats is prim arily to produce feed. The purpose of wheat is primarily the production of a crop that can be sold fo r cash. A n average of 242 bushels of outs was sold per farm out of an average crop of 1,120 bushels and an average of 137 bushels was bought. Between 80 and 90 percent of the wheat crop was either sold or held at the end of the year, await ing sale. The higher price of wheat indicates that i f some small grain is to be sold, wheat has a decided advantage over oats for this purpose. On the other hand, oat straw has more feeding value than that of barley or wheat when the straw is wanted fo r roughage.
Mixed Clover and Timothy H ay
Mixed clover and timothy hay provides the chief roughage on the typical Iowa County farm. The census of 1925 showed 50,- 000 acres in Iowa County in hay crops, of which 46,000 were in clover or timothy. This is about 19 percent of the total of 215,000 crop acres. The cost route farms averaged 16.1 acres in clover and timothy in a total of 38 fields in the three years. A somewhat larger acreage was cut fo r timothy seed so that about 22 percent of the crop was in clover or timothy for hay or seed . The percentage of the crop used for hay varied from year to year. I f the hay crop promised to be heavy so that the fa rm ’s needs fo r roughage could be satisfied from a small num ber of acres, a larger part than usual would generally be cut for seed. I t should be borne in mind in examining the data given here that the type and quality of these hay crops were quite vari able. Both timothy and clover were seeded in the small grain crops. In the first year there was usually considerable clover in the hay. In the second year the clover had often largely or wholly disappeared and the hay was mostly timothy. On the fields summarized in table X V I I the average yield was 1.2 tons per acre in 1925, 1.1 tons in 1926 and 1.4 in 1927.
In seeding the timothy and clover in the small grain the seed and extra labor cost an average of $1.90 in the two years for
303
TABLE X V II. M IXED H A Y — Y IE L D S AND COSTS P E R ACRE
| Average | I I I Range——1927
1925-27 1925 1926 1927 Low High
Costs per ton ... $11.84 9.72 13.76 12.03 9.23 18.27
16.1 14.9 17.3 16.1 ' 5.3 31.6
Yield per acre, tons 1.2 1.2 1.1 1.4 .9 1.9
Physical costs 5.7 5.8 5.5 5.8 3.9 10.2 Horse hrs... . 8.4 9.0 8,5 7.7 5.2 15.2 Financial costs 1.71 .95 2.74 $ 1.61 1.66 1.48 1.18 1.25 1.18 1.10 .52 1.76 Equip, chg... .54 .59 .56 .46 .27 .7*1 2.40 1.47 2.01 3.79 .32 7.64 Other exp... 2.62 .83 2.81 2.28 .48 3.23
Total opr. exp... 8.34 5.79 8.04 9.33 4.64 14.30
Land & bldg. chg. 7.78 7.54 7.83 7.97 6.81 10.24 16.12 13.33 15.87 17.30 13.51 23.08 $ 1.01 1.21 1.28 .49 13.51 1.33 Net cost ... 15.11 12.12 14.59 16.81 22.64
which complete records are available. In harvesting an average of 5.7 hours of labor and 8.4 hours of horse labor was required per acre. The seasonal distribution of this labor is shown in fig. 9. These cost $1.61 and $1.18, respectively, fo r man and horse labor. A charge of $2.40 was made fo r manure and 54 cents fo r the use of equipment. The total expense of seeding and cutting the crop averaged $8.34, and the charges for the use of land and buildings brought the total expense up to $16.12 per acre. A fte r deducting credits fo r the use of pasture, this amounted to $11.84 per ton fo r the hay.
Lim ing the land in order to get larger yields of clover should reduce the costs materially, and either increase the capacity of
Man Hfts.
40
30
304
TAB LE X V III. T IM O T H Y SEED Average 1925-27 1925 1926 1927 Range-Low —1927 High Cost per cwt... f 5.19 5.47 5.07 5.19 3.28 13.53 No. of acres ... . 20.3 21.7 17.1 22.1 6.1 33.6 Yield, lbs... 225 176 248 244 125 390
Seeding pre. year .... .77 .76 .78 2.68
Physical cocts Labor hrs... 6.1 5.5 5.9 6.7 3.1 9.0 Horse hrs... 5.6 5.8 5.5 2.6 9.6 Twine lbs... 2.0 1.9 1.8 2.3 1.6 3.7 Financial costs Labor cost ... $ 1.64 1.56 1.62 1.73 .86 3.25 Horse cost ... .82 j .80 .78 .86 .37 1.70 Equip, chg. ... .41 .38 .42 .4 2 .13 .80 Tractor cost ... .22 .20 .34 .16 .36 Manure ... 1.89 1.51 1.89 2.16 4.60 Threshing ... 1.43 1.45 1.33 1.49 .98 2.64 Misc. exp... 1.13 . -7 8 1.49 1.14 .51 2.08
Total opr. cost .... 7.95 6.68 8.62 8.74 5.11 13.69
Land chg. .... 7.62 7.12 7.76 7.90 6.75 10.15
Groes expense ... 15.57 13.79 16.38 16.64 13.26 21.96
Straw credit ... 2.58 2.07 2.79 2.80 2.25 3.73
Pasture credit ... .77 1.10 .44 .70 3 41
Clover seed credit .. .54 .74 .54 .47 2.85
Total credit ... $ 3.89 3.91 3.78 3.97 2.25 7.86
Net expense .. 11.68 9.89 12.59 12.67 10.11 16.89
the farm for livestock, or else reduce the number of acres neces sary to provide forage and so release more land for corn or wheat.
Timothy Seed
Reference has already been made to the timothy seed crop as being closely related to the timothy hay. On some farms an acreage of timothy is grown prim arily fo r the seed, but on a larger number the seed is partly an element of elasticity in the forage system. That is, the amount of timothy to be cut fo r seed is decided after it is seen how much of the timothy acreage is needed fo r hay.
Timothy seed was raised on 9 farms in 1925, on 11 in 1926 and 12 in 1927. The average yields were 176 pounds of seed per acre in 1925, 248 in 1926 and 244 in 1927. The yields, how ever, varied widely in each of the three years. F or the whole period a variation of from 150 to 300 pounds per acre would-be typical of the bulk of the farms. The expenses of seeding and raising the timothy up to the time it is harvested would not, of course, differ from the expenses on the crop cut for hay.
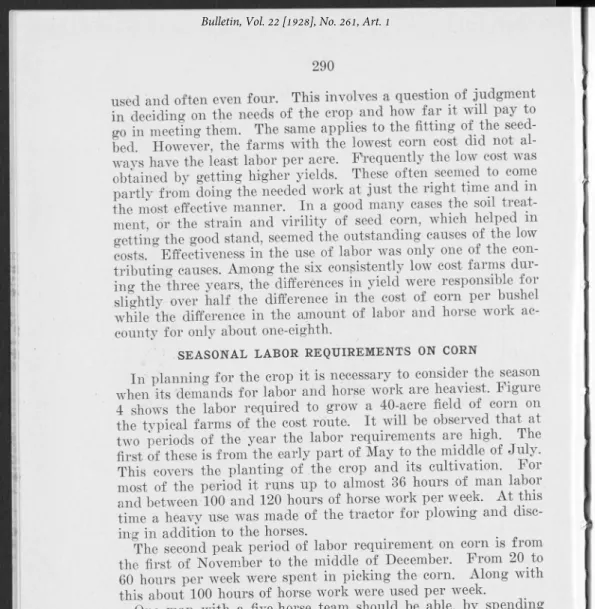
Figure 10 shows that the labor requirements on timothy seed occur almost, entirely in late July and August when other farm work is not pressing.
In harvesting and threshing the main expenses were fo r la bor. A n average of 6.1 hours of labor and 5.6 hours of horse work was used per acre. These were valued at $1.64 and 82 cents, respectively. The charge fo r manure averaged $1.89 and that fo r threshing $1.43. The total operating expense
aver-305
Fig. 10. Weekly distribution of labor on 20 acres timothy seed.
aged $7.95. A fte r the land charge of $7.62 was added this gave a gross expense of $15.57. Credits for.«pasture of the stubble, for clover seed separated from the timothy and for the straw after the seed had been threshed out o f it totalled $3.89 per acre.
The price of timothy seed has not been sufficient in the last few years to give a very high return on the use of the land and buildings after deduction o f the expenses.
The farmers raising timothy seed would, with few exceptions, have done much better to raise com or wheat instead. The re placement of this low yielding crop by a more profitable one seems pretty clearly to lie one of the most promising opportuni ties to increase the returns from the crop system in this farm ing area.
A lfa lfa and Sweet Clover
In the effort to obtain heavier yields of hay of greater feed ing value, both alfalfa and sweet clover have been tried on sev eral of the Iowa County cost route farms. Several unsatisfactory stands were obtained mostly because o f acidity of the soil. Where the soil has been limed thoroly and the crop did not win ter kill, good yields were obtained. Table X I X shows that the yields o f alfalfa were about twice as high as on the timothy and
clover. . .
Three of the fields of alfalfa were patches of under four acres, this would cause the labor requirements to run somewhat higher per acre than on the larger fields of timothy and clover. But the i-creason that the labor requirements were twice as high on alfalfa as on the mixed hay was that it was necessary to cut the
306
TAB LE X IX . EXPENSES AND Y IE LD S ON FOUR FIE LD S OF A L F A L F A
Field A B o D
Cost per ton ...:... $ 7.26 $10.72 $14.23 $22.55
Acres ... 3.7 1.6 3.8 31.2
Yield, tons per acre ... 2.7 3.4 2.2 1.9
Previous cost of seeding .... 6.0 8.12
Labor hours ... 12.6 15.3 21.4 8.1 Labor cost ... 3.40 4.61 5.41 2.34 Horse hours ... 21.1 21.2 25.7 13.6 Horse cost ... 3.74 3.22 3.96 1.95 Equip, charge ... 1.62 2.52 2.08 .68 Manure ... 10.00 1.60 19.60 Tractor expense ... 7.21 Misc. expense ... 5.03 1.65 4.06 2.17
Total operating cost ... 13.79 29.21 23.11 34.86
Land charge ... 5.84 7.63 8.30 7.99
Total expense ... 19.63 36.84 31.41 42.85
alfalfa three times per year. The greater care in preparing the seedbed and the heavier applications o f manure also contributed to heavier expense.
Altho sweet clover has proven itself useful for pasturage and, in some cases, fo r hay, one of its most valuable uses is as a soil building crop. Like alfalfa, sweet clover w ill not do well on acid soil, and the need of most of the Iowa County soil fo r lime has been the chief factor lim iting its production. The yields of sweet clover hay on the three fields covered by the records were higher than was typical of the mixed hay, as is shown by table X X . Consequently, the cost per ton on two of the three fields was lower than the average o f the timothy and clover.
The most successful use of the sweet clover was in fields A and B, where it was seeded in the spring in the oats or barley. A crop of hay was then cut after the oats had been removed. In one of those cases the sweet clover was kept for pasture in the