Available Online at www.ijpret.com 53
INTERNATIONAL JOURNAL OF PURE AND
APPLIED RESEARCH IN ENGINEERING AND
TECHNOLOGY
A PATH FOR HORIZING YOUR INNOVATIVE WORK
USING SPATIAL INTERPOLATION TECHNIQUES (IDW) - A CASE STUDY OF MAN
RIVER BASIN AKOLA BULDHANA DISTRICT OF INDIA
KHADRI S. F. R, KANAK N. MOHARIR
Department of Geology, Sant Gadge Baba Amravati University, Amravati, India Accepted Date: 05/03/2015; Published Date: 01/05/2015
\
Abstract: Spatial variations in ground water quality of Man River basin in the Akola and Buldhana district of Maharashtra India have been studied using geographic information system (GIS) technique. Groundwater is one of the most important natural resources. Groundwater has become a necessary resource over the past decades due to the increase in its usage for drinking, water supply, irrigation and industrial uses etc. Groundwater resources are now facing threats due to anthropogenic activities. The groundwater quality is equally important as that of quantity. Mapping of spatial variability of groundwater quality is of vital importance and it is particularly significant where groundwater is primary source of potable water. Geographical Information System (GIS) is used for the spatial analysis and it is a powerful tool for representation and analysis of spatial information related to water resources. The major water quality parameters such as pH, Electrical Conductivity (EC), Total Dissolved Solids have been analysed. The spatial variation maps of these groundwater quality parameters were derived and integrated through GIS. The final integrated map shows three priority classes such as High, Medium and Low groundwater quality zones of the study area and provides a guideline for the suitability of groundwater for domestic purposes.
Keywords: GIS, Groundwater, drinking-water, physicochemical parameters, spatial interpolation (IDW).
Corresponding Author: MR.KHADRI S. F. R.
Access Online On:
www.ijpret.com
How to Cite This Article:
Available Online at www.ijpret.com 54 INTRODUCTION
The continuous circulation of water between ocean, atmosphere, and land is called the hydrologic cycle. The hydrologic cycle can be viewed as a major machine on the planet, controlling distribution of water on the earth. Groundwater is one of the major links in the hydrologic cycle. Groundwater forms the invisible, subsurface part of natural hydrological cycle. Inflow to the hydrologic system arrives as precipitation, in the form of rainfall or snowmelt. Outflow takes place as stream flow or runoff and as evapotranspiration, a combination of evaporation from bodies of water, evaporation from soil surfaces, and transpiration is delivered to streams both on the land surface, as overland flow tributary channels; and by subsurface flow routes, as inter flow and base flow following infiltration into the soil (Freeze & Cherry, 1979). Excluding the freshwater that is locked up in the form of polar ice caps and glaciers, about 97 percent of the worlds freshwater exist in aquifers.
The present study has been carried out in district Akola and Buldhana of Maharashtra state. In the present study the available physio-chemical data of 45 locations, the data was obtained from Central ground water authorities of concerned districts. The physio-chemical data contained the information about various water quality determining factors. The data was digitized and put up in ArcGIS Software for Spatial Interpolation and based on previous experience most commonly used interpolation methods viz; Inverse Distance Weighted (IDW) and nearest Neighbor were applied to the above data for generation of continuous raster surface for studying the influence of each interpolation technique and best judging which interpolation technique is best. Through this study it is hoped that basic Interpolation method needed to study the water quality of this area further in future has been generated.
1. Study Area
The Man river basin is situated in Akola and Buldhana Districts of Maharashtra which is located between 20°54′59” N latitude and 76° 41’23’’ E longitude covered by survey of India Top sheets no. 55 D/7, 55 D/9, 55 D/11, 55 D/13, 55 D/14 and 55 D/15 on 1:50,000 scale. It can be approached from Amravati about 110 Km. the study area is occupied by alluvium and Deccan basalts which are horizontally disposed and is traversed by well-developed sets of joints.
Available Online at www.ijpret.com 55 Fig.1 Location map of Man River basin.
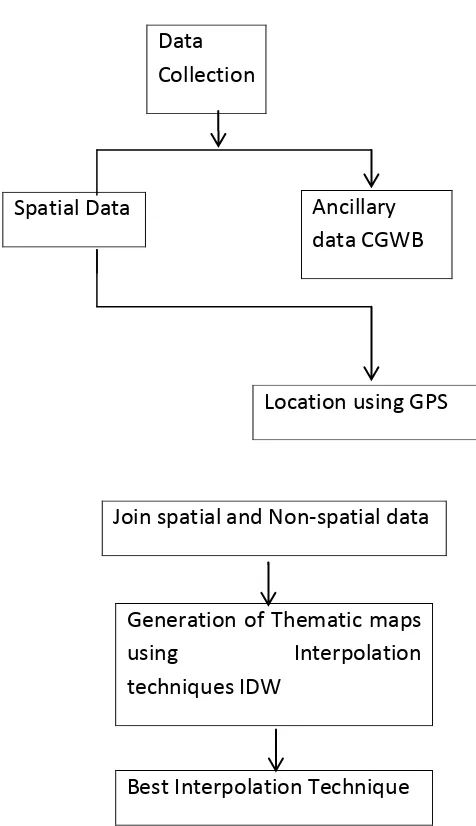
2. Methodology
Available Online at www.ijpret.com 56 representation of a raster dataset represents height, concentration, or magnitude for example, elevation, pollution, or noise. Interpolation makes predictions from sample measurements for all locations in a raster dataset whether or
Fig. 2 Overall Methodology Adopted
Not a measurement has been taken at the location. In the present data analysis we used IDW (Inverse distance weighted) interpolation technique and nearest neighbor.
Data Collection
Spatial Data Ancillary data CGWB
Location using GPS
Join spatial and Non-spatial data
Generation of Thematic maps using Interpolation techniques IDW
Available Online at www.ijpret.com 57 3. RESULTS & DISCUSSIONS
One interpolation methods were implemented in this study Inverse Distance Weighted (IDW). These interpolation techniques were compared to get the best interpolation techniques i.e., to see which of the interpolation technique gives the result which is more acceptable. The results are given with the ranges of values for two interpolation techniques. From the table it is apparent that some parameters show increase in value and some show decrease. The values are inferred using Bureau of Indian standards as Desirable, Permissible Limit and Non-potable. In addition to this various thematic layers of interpolation have been generated using the above parameters as input to ArcGIS spatial analyst module for interpolation. The interpolation maps generated shows the influence of each water quality factor in the study district. Water quality interpolation results are generated for various layers like pH, EC, TDS etc. The interpolation maps generated have been shown from Figure
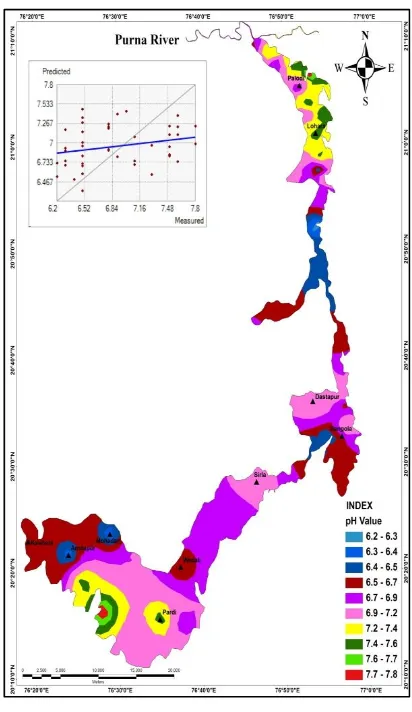
3-I. pH
The pH of the solution can be defined as the negative logarithm to the base 10 of the hydrogen ion concentration in moles per liter the pH scale has a range from 0 to 14. Neutral water has a pH of 7.0 indicating equal number of H+ and OH- ions; and alkaline water has pH > 7.0 implying a preponderance of OH ion and acidic water with a pH < 7.0 indicate a dominance of H+ ions. Each stream organism is adapted to a specific pH range. The pH in most rivers unaffected by humans ranges from 6.5 to 8. The pH range of survivability of most freshwater organisms ranges from about 4.5 to 9. Western soils, which are typically alkaline, are a natural contributor to elevated pH conditions. Humans contribute to elevated pH primarily in the form of nutrient runoff (most commonly fertilizer), which leads to algae growth and higher pH. Low pH can be especially harmful to aquatic organisms. Low pH affects (physiological, biological) functions of aquatic life through reduction of enzyme activity and effectiveness stream miles. Low pH results when atmospheric
Available Online at www.ijpret.com 58 Fig. 3 pH map of study area
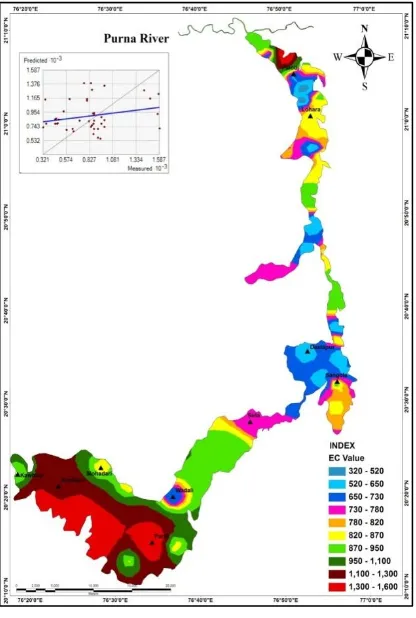
II. Electrical Conductivity (EC)
Available Online at www.ijpret.com 59 The spatial distribution of electrical conductivity (EC) for groundwater during pre-monsoon period for 2014 is shown in Fig. Generally the electrical conductivity of groundwater in alluvial unconfined aquifer. Higher EC is found particularly on north–western part of the area, due to the presence of good basaltic aquifer, which recharge quite regularly by rainfall as compared to alluvium. Conductivity indicates the presence of ions within the water, usually due to in majority, saline water and in part, leaching. It can also indicate industrial discharges. The removal of vegetation and conversion into monoculture may cause run-off to flow out immediate thus decrease recharge during drier period. Hence, saline intrusion may go upstream and this can be indicated by higher conductivity.
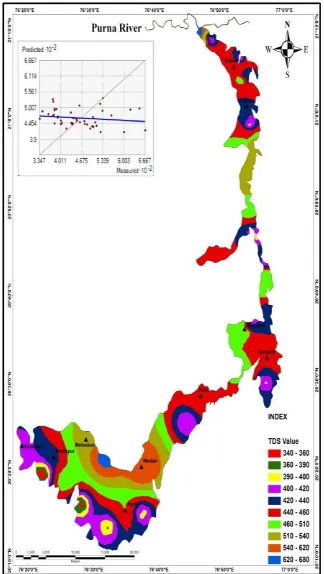
Available Online at www.ijpret.com 60 III. Total Dissolved Solids
Total dissolved solids (TDS) are a measure, in milligrams per liter (mg/l), of the amount of dissolved materials in the water. Ions such as potassium, sodium, chloride, carbonate, sulphate, calcium, and magnesium all contribute to the dissolved solids in the water. In many instances resource agencies use the terms TDS and salinity interchangeably, since these ions are typically in the form of salts. Measuring total dissolved solids is a way to estimate the suitability of water for irrigation and drinking. This is an important parameter for drinking water because high TDS values may result in a ‘salty’ taste to the water. Groundwater often has higher levels of dissolved solids than surface water because of its contact with aquifer geologic material and more time to dissolve rock and mineral materials. When stream flow is at base flow conditions, most of the source water is from groundwater, and dissolved solids concentrations are high. When stream flows are high from rain or snowmelt, dissolved solids measurements typically are low.
It is the concentration of non-volatile substances present in the water in molecular dispersed and colloidal state. Due to surface & subsurface movement of water, it contains a wide variety of dissolved inorganic chemical constituent in various amounts. The concentration (in ppm.) of TDS classified water as,
Fundamentally, it is based on concentration of NaCl, which in turn determine the conductivity which has a bearing on TDS. Conversion between TDS and conductivity in micro Siemens or micromho’s/cm. at 250, TDS in ppm. And varies between 0.55 – 0.75.A value of 0.90 has been arrived at gave a relation that for groundwater in the range of 100 – 5000 micromoho’s/cm at 250c. 1 ppm. TDS = 1.56 EC x 106.TDS in the study area ranges between 340 to 680 for pre monsoon2014 (Fig.5).
Table. 1 Results showing TDS and water quality values
T D S Water Quality
< 1000 Fresh
1000-10000 Brackish
10,000 – 1,00,000 Saline
Available Online at www.ijpret.com 61 Fig. 5 TDS map of study area
4. CONCLUSION
From the current study it has been found that Inverse distance weighted interpolation technique is the best way of determining the water quality, As in this technique the chances of error are minimized to a great extent and chances of deviation of original value are extremely low.
5. ACKNOWLEDGMENT
Available Online at www.ijpret.com 62 7. REFERENCES
1. Stefanoni LH, Hernandez RP, Mapping the spatial variability of plant diversity in a tropical forest: Comparison of spatial interpolation methods‖, Environmental Monitoring and Assessment Vol. 117, pp. 307-334, 2006.
2. R. Anis, F. Saeed, R. Aslam. Comparison of different interpolation methods for temperature mapping of Pakistan‖. Water resource and arid environment, 2006.
3. W. Luo, M. C. Taylor and S. R. Parker, A comparison of spatial interpolation methods to estimate continuous wind speed surfaces using irregularly distributed data from England and Wales, International Journal of Climatology, Vol. 28, pp. 947–959, 2008.
4. Weekly Rainfall Probability for Selected Stations of India, IMD (Division of Agricultural Meteorology, Pune), Vol. 2, Edition- I, 1995.
5. McCuen, R.H. Hydrologic Analysis and Design‖, N.J Prentice Hall, 1998.
6. Ducci D, GIS techniques for mapping groundwater contamination risk‖, Natural Hazards, Vol. 20 pp. 279-294, 1999.
7. Busuioc A, Chen D, Hellström C, Performance of statistical downscaling models in GCM validation and regional climate change estimates: application for Swedish precipitation, International Journal of Climatology, Vol. 21, pp. 557–578, 2001.
8. Gupta MD, Purohit A, Datta KMJ, Assessment of drinking water quality of river Brahmani, Indian Journal of Environmental Protection Vol 8, Edition 3, pp. 285-291, 2001.
9. Chatterjee R, Tarafder G, Paul S, Groundwater quality assessment of Dhanbad district, Jharkhand, India‖, Bulletin of Engineering Geology and Environment, Vol. 69, Edition 1, pp. 137-141, 2010.
10.Yammani S, Groundwater quality suitable zones identification: application of GIS, Chittoor area, Andhra Pradesh, India‖, Environmental Geology Vol. 53, Edition 1, pp. 201–210, 2007.
11.Babiker IS, Mohamed AM, Hiyama T, Assessing groundwater quality using GIS‖, Water Resource Management, Vol. 21, Edition 4, pp. 699 –715, 2007.
Available Online at www.ijpret.com 63 13.Ducci D, GIS techniques for mapping groundwater contamination risk, Natural Hazards Vol. 20, pp. 279-294, 1999.
14.Isaaks EH, Srivastava RM, an Introduction to Applied Geostatistics‖, Oxford University Press, 1989.
15.Shomar B, Fakher S. A, Yahya1 Assessment of Groundwater Quality in the Gaza Strip, Palestine Using GIS Mapping. Journal Water Resource and Protection Vol. 2, pp. 93-104, 2010.
16.Lam NS, Spatial Interpolation Methods: A Review‖, the American Cartographer Vol. 10, pp. 129-149, 1983.
17.Gyananath G, Islam SR, Shewdikar SV, Assessment of Environmental Parameter on ground water quality. Indian Journal of Environmental Protection Vol. 21, pp. 289-294, 2001
18.Taesombat Wisuwat, Sriwongsitanon Nutchanart, Thailand Areal rainfall estimation using spatial interpolation techniques. Science Asia, pp. 268–275, 2009.
19.Hong Yan, Nix A. Henry, Hutchinson F. Mike and Booth H. Trevor., Spatial interpolation of monthly mean climate data for china‖. International Journal of Climatology Vol. 25, pp. 1369-1379, 2005.
20.Jantakat Yaowaret and Ongsomwang Suwit, Assessing the effect of incorporating topographical data with geostatistical interpolation for monthly rainfall and temperature in ping basin, Thailand‖, Strategic Integration of Surveying Services, pp.13-17, 2009.