Available Online at www.ijpret.com 646
INTERNATIONAL JOURNAL OF PURE AND
APPLIED RESEARCH IN ENGINEERING
AND TECHNOLOGY
A PATH FOR HORIZING YOUR INNOVATIVE WORK
STUDY OF THE BASICS OF SPECTRUM ANALYZER AND PERSPECTIVES
MONALI CHAUDHARI1, VAISHALI KULKARNI2
1. PG Student, SKN Collage of Engineering, Pune. 2. Assistant Prof. SKN Collage of Engineering, Pune.
Accepted Date: 15/03/2016; Published Date: 01/05/2016
\
Abstract- Over the last couple of decades, different types of spectrum analyzer were developed for numerous applications in various fields, such as, measurement of spectral purity of multiplex signals, percentage of modulation of AM signals, and modulation characteristics of FM and pulse-modulated signals. The spectrum analyzer is also used to interpret the displayed spectra of pulsed RF emitted from a radar transmitter. A spectrum analyzer is the primary tool for studying the spectral composition of many electrical, acoustic or optical waveforms. The present day’s spectrum analyzer is a vital portion of the engineer's toolbox. Which is used for the demonstrations of a power spectrum over a given frequency range, changing the display as the properties of the signal change. Here, we present the basic idea around how the spectrum analyser works in a different environment, how it is efficient as compared to other type of measuring instruments and all other aspects of the spectrum analyzer. In the presence of many signals, monitoring is very complicated to determine the performance of a system or device. The major components of spectrum analyser and how it is used during analysing the performance of devices.
Keywords: Signal, Spectrum, periodogram
Corresponding Author: MS. MONALI CHAUDHARI
Access Online On:
www.ijpret.com
How to Cite This Article:
Monali Chaudhari, IJPRET, 2016; Volume 4 (9): 646-650
Available Online at www.ijpret.com 647
INTRODUCTION
Spectrum analyser is an instrument which is used to measure the amplitude of a signal with respect to frequency [1]. The input signal which applies to the spectrum analyser is electrical, optical, vibration or acoustic signals generated from different source undergoes analysis for measuring the performance of the respective device. Spectrum analyser generally used for high frequency measurements and testing purpose [2]. Spectrum analyser covers the frequency range of up to 40 GHz and beyond [3]. It is generally used in all wired and wireless applications for development, installation, production and maintenance [4].
In case of microwave receivers, the signal strength is weaker than the noise and of having a lower frequency cannot measure such signal by using spectrum analyser in normal mode. It has a facility to convert a signal having very low or very high strength is converted into decibel (dB). In spectrum analyser, lower frequency signals are modulated to convert it into higher frequency components in the range of the analyser. We can also analyse the performance of the device or system by understanding the characteristics of noise and its types by comparing it with other signals [4].
2. CORRELATION BETWEEN TIME AND FREQUENCY DOMAINS
The electrical signal can be represented in both, time domain as well as frequency domain as shown in fig. 1.
Fig.1 - Representation of signal
The two representations are linked together by using Fourier transform [5], where each signal in frequency domain having its time domain representation also.
Here,
Xf(f)=F{x(t)} =∫ x(t). e−i2πft
∞
−∞ . 𝑑𝑡
Or, x(t)=F-1{X
f(f)} =∫ 𝑒𝑖2𝜋𝑓𝑡
∞
−∞ . Xf(f).df
Available Online at www.ijpret.com 648 Where,
Xf(f) is complex signal in the frequency domain,
x(t) is signal in the time domain, F{x(t)} is Fourier transform x(t), F-1{X
f(f)} inverse Fourier transform of Xf(f).
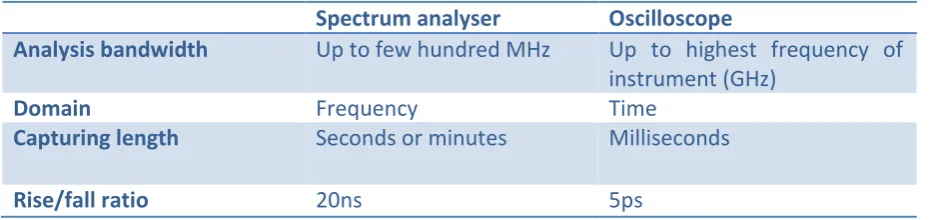
3. Difference between spectrum anlyzer and oscilloscope
Spectrum analyser Oscilloscope
Analysis bandwidth Up to few hundred MHz Up to highest frequency of instrument (GHz)
Domain Frequency Time
Capturing length Seconds or minutes Milliseconds
Rise/fall ratio 20ns 5ps
3.1. BLOCK DIAGRAM
The fig. 2 represents the different modules which are the main parts of the spectrum analyzer. In general, the signal under the analysis process undergoes the following processes [4].
3.1.1 Bandwidth adaptation 3.1.2 Modified periodogram
3.1.3 Periodogram analysis and SDW generation.
The internal operations performed on a signal are explained as below.
Fig. 2 - Block diagram of Spectrum analyzer
3.1.1 Bandwidth adaptation -
In the bandwidth adaptation, the real and imaginary part of a signal undergoes filtering process by using the anti-aliasing FIR filters to reduce aliasing and noise in the input signal. The input frequency converted into a range of frequency of spectrum analyzer which is going to analyse the signal.
3.1.2 Modified periodogram:
At modified periodogram stage, after filtering the signal is undergoing for FFT computation for fast analysis. Followed by window selection, one of the most important measures for
Band width
Adaptation
-on
Periodo-gram
Analysis
and SDW
Generation Modified
Available Online at www.ijpret.com 649 FFT computation for the necessity of the process. Then, the periodogram generated by squaring a magnitude of FFT.
3.1.3 Periodogram analysis and SDW generation -
At this stage, detection, estimation and generation of the signal is performed. The periodogram algorithm is used to detect and estimate the signal. Along with available data signal description word (SDW) is generated.
3.2. TYPES OF SPECTRUM ANALYZER
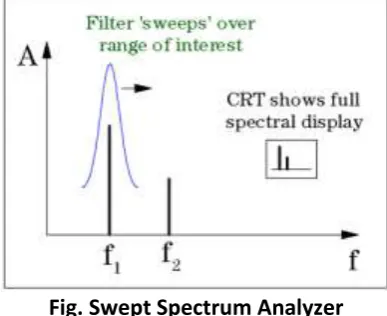
3.2.1 Swept spectrum analyzer:
Basically, it swept all the frequency components present over the available frequency range, which is under the consideration for analysis. Swept spectrum analyser provides information about the magnitude of the signal, but unable to detect phase information of any particular signals. It can have used for wide frequency range measurements for large dynamic range and frequency range of up to 30 Hz to 325 GHz [5]. This type of instrument is used for mobile communications, cable TV and broadcast equipment, microwave communication, component testing and signal surveillance, EMI diagnostic testing, telecommunications equipment, manufacture and maintenance of radar.
Fig. Swept Spectrum Analyzer
3.2.2 FFT spectrum analyzer
Here, by using digital signal processing, the input signal is sampled and converted it into a frequency domain signal. The conversion of signals is performed using FFT computation [2]. Because of using FFT, it can extract more information from input the signal like amplitude, phase and many more of individual frequency component [5].
Available Online at www.ijpret.com 650 Basically, FFT analyser takes an input signal in time domain, digitizes the input using digital sampling and then performing a mathematics to convert it into the frequency domain and then display the spectrum. It can be able to capture periodic, random and transient events as well. FFT analyser are having more speed of analysing as compared to the swept spectrum analyser. These analysers are having significant performance improvement, but are expensive compared to other traditional analysers. It gives a better frequency resolution, amplitude accuracy and improvements in speed. But its relative frequency is not as good as swept spectrum analyser.
3.2.3 Real time spectrum analyzer
It captures input signals from memory and then analyse the signals using fast Fourier transform technology to make it quick i.e. real time. In this type of spectrum analyzer the transient effects that are not visible in other types of spectrum analyzer can be easy to capture.
4. CONCLUSION
We have presented the basic study for the implementation of spectrum analyzer. From the several techniques most efficient, suitable and cost effective signal processing techniques has been presented. After completion of this research it will help student, engineers and researchers in a designing the comparative study of spectrum analyser and its various types.
REFERENCES
1. Morris Engelson, “Modern spectrum analyzer: theory and applications”, Artech House (1984).
2. A. A. Abidi, “High-frequency noise measurements on FET's with small dimensions” Electron Devices, IEEE Transactions, Vol. 33, Issue 11 (1986).
3. Mark Pelusi1, Feng Luan, Trung D. Vo, Michael R. E. Lamont, Steven J. Madden, Douglas A. Bulla, Duk-Yong Choi, Barry Luther-Davies and Benjamin J. Eggleton, “Spectrum analyzer covers frequency range of up to 40 GHz and beyond. It is generally used in all wired and wireless applications for development, installation, production and maintenance, Nature Photonics 3, pp. 139 - 143 (2009).
4. S. Thomas, N. S. Haider, “A Study on BASICS OF A SPECTRUM ANALYZER”, IJAREEIE, Vol. 2, Issue 6 (2013).
5. Frequency Domain and Fourier Transforms