Documenting production process and the ranking factors causing
yield gap in rice fields in Sari, Iran
M. Yousefian1, A. Soltani2, S. Dastan3*, H. Ajamnoroozi1
1
Department of Agronomy, Gorgan Branch, Islamic Azad University, Gorgan, I. R. Iran
2
Department of Agronomy, Gorgan University of Agricultural Sciences and Natural Resources, Gorgan, I. R. Iran
3
Agricultural Biotechnology Research Institute of Iran (ABRII), Karaj, I. R. Iran
* Corresponding Author: [email protected] DOI:10.22099/iar.2019.5316
ARTICLE INFO ABSTRACT- The documentation process is very important for identifying yield
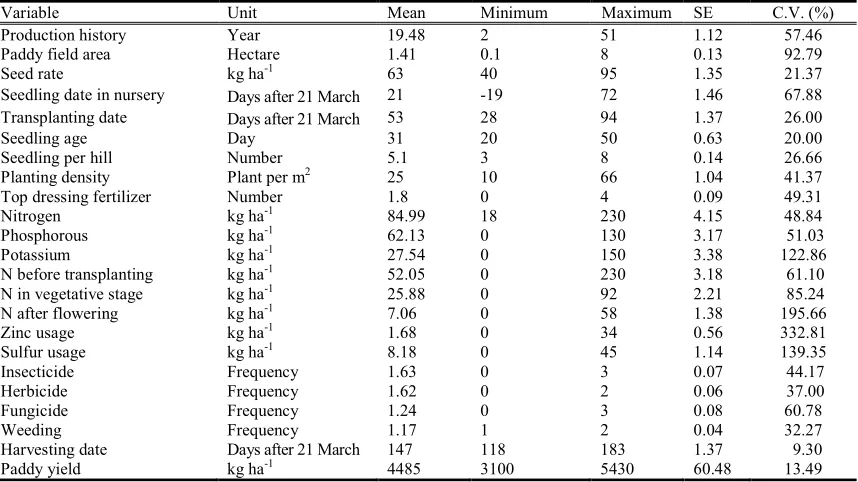
constraint factors and yield gap. For this purpose, all managing practices were recorded by monitoring paddy rice fields in Sari region, Iran from 2015 to 2016. Field identifications were undertaken in such a way that they included all the main production procedures with variations in management viewpoints. Results revealed that seed consumption varied from 40 to 95 kg ha-1 and the range of seedling age varied from 20 to 50 days. Planting density was 10 to 66 plants per m2. Nitrogen application by 30% of the
farmers ranged from 46 to 83 kg ha-1, and 40% of the farmers applied 83 to 138 kg of nitrogen per hectare. In 73% of the fields, nitrogen was not used after the flowering stage. The range of yield varied from 3100 to 5430 kg ha-1, and in 60% of the studied fields, the paddy yield varied from 4205 to 5200 kg ha-1. In the comparative performance analysis (CPA) model, the actual yield and the yield potential were estimated to be 4495 and 6337 kg ha-1, respectively, and the yield gap was 1841 kg ha-1. Among the five variables entered in the model, the effects of potassium application and biological fight were remarkable so that the paddy yield increase by these variables was 709 and 806 kg ha-1, respectively, that was equal to 39% and 44% of the total yield variation. Therefore,
since the calculated potential yield was achieved through actual data in each paddy field, it seems this yield potential is attainable.
Article history:
Received 12 February 2019 Accepted 26 August 2019 Available online 20 October 2019
Keywords: Actual yield Attainable yield CPA model Management factors Potential yield
INTRODUCTION
Rice (Oryza sativa L.) is the staple food of more than half of the world population, and has an obvious effect on feeding, income generation, and job creation for people around the world, especially in Iran (Pishgar-Komleh et al., 2011). The area of rice cultivation in the world has increased from 145 million hectares to 167.2 million hectares during recent years (FAO, 2019). Iran, with 571.6 thousand hectares of paddy fields and two million tons of white rice production, accounted for a 0.4% of rice production and cultivation area in the world, and most of these fields (about 40%) were located in Mazandaran province (Ministry of Jihad-e-Agriculture of Iran, 2016). The paddy field area in Sari city was about 23,000 hectares, accounting for 10% of the total paddy field area in Mazandaran province (Ministry of Jihad-e-Agriculture of Iran, 2016).
One of the major problems in crop production in Iran is a large disparity between the farmers’ actual yield and attainable yield. In the recent years, owing to concerns over food security issues, yield gap analysis was vastly investigated into world-wide level (van Ittersum et al., 2013; Wang et al., 2015) as well as in
Iran (Soltani et al., 2016). It is necessary to use appropriate statistical methods to estimate the yield gap and its causes, or to identify the possible limitations to achieving the potential yield (Soltani et al., 2016). In this regard, there are various methods to analyze the yield gap. One of these methods, which focuses on the ability to estimate potential yield and the reason for a yield gap, is comparative performance analysis (CPA). In fact, the analysis of a yield gap provides a quantitative estimation of the potential for increasing production capacity, which is an important component for designing food security strategies at the regional, national, and global levels (van Wart et al., 2013). Yield gap is defined as the difference between the potential yield and the actual farm yield under optimal management conditions (van Ittersum et al., 2013).
The majority of extent research has focused on the yield of the three main crops, wheat, rice, and maize that make up a large portion of human food supplies (Beza et al., 2017). Some important studies pertaining to the rice yield gap have globally used the CPA method to analyze the yield gap (Kayiranga, 2006). Other studies on rice yield have analyzed the yield gap in
102 conventional and organic systems in the Mediterranean
(Delmottea et al., 2011), determined the factors affecting the diversification of flooding rice in southern-central Benin (Tanaka et al., 2013), determined the constraint factors on rice yield in the floodplain systems in Senegal River Valley (Tanaka et al., 2015), analyzed the yield gap of rice systems in America (Epse et al., 2016 a,b), simulated the yield gap of rice in the world (Mueller et al., 2012), determined the flooding rice yield gap in China (Xu et al., 2016), analyzed the yield gap of rice in the Philippines by using a model (Silva et al., 2017), and analyzed crop planting systems to increase sustainability by reviewing the research conducted worldwide (Reidsma and Jeuffroy, 2017). Other studies conducted in Iran estimated the quantity of rice yield gap and input utilization (Gorjizad et al., 2019 a, b; Habibi et al., 2019 a, b; Halalkhpr et al., 2018; Rezvantalab et al., 2019) and estimated canola yield gap (Nezamzadeh et al., 2019) using CPA and boundary-line anslysis (BLA), or in other words, detected the restricting parameters of potential yield. Therefore, rice yield gap measures are necessary to understand the possibility of achieving higher yields and for proper planning as well. Thus, the aim of this research was to estimate the rice yield gap related to crop management by local rice cultivars at the Sari region of Mazandaran province located in northern Iran.
MATERIALS AND METHODS
Description of the Site and Climate
The present research was undertaken in 100 paddy fields located between the Alborz mountains range and the Caspian Sea in 2016. Sari city is located in Mazandaran province in northern Iran. The experimental region is geographically situated at 36°, 4’ N latitude and 53°, 5’ E longitude. The weather data were collected daily from the nearest synoptic meteorological station to the paddy fields (Table 1).
Srad_calc and PP_calc programs can also be
downloaded from
“https://sites.google.com/site/CropModeling”.
Data Collection
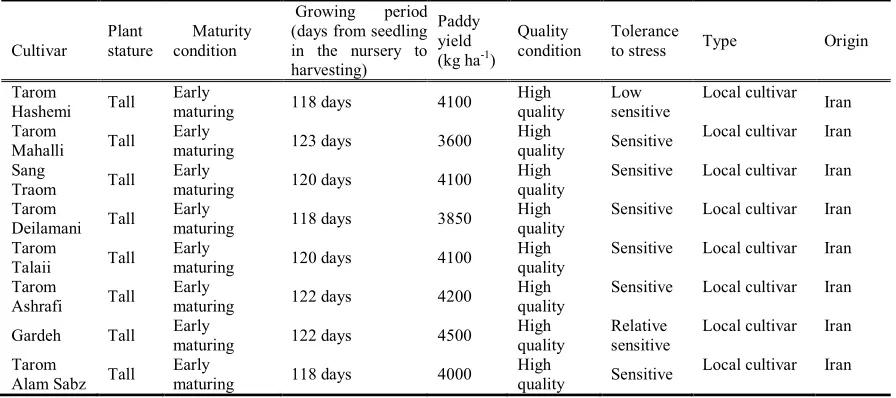
All the managerial operations from nursery preparation to harvesting stages were recorded through field studies. To estimate the yield gap, 100 paddy fields in the Sari region were recorded through monitoring. All the farm cases pertained to local cultivars. The profile of the cultivars is shown in Table 2.
The method of each managerial operation in the paddy fields was determined during each of the phases of soil preparing, planting, cultivating, and harvesting. All the data about agricultural management, including soil preparation (plough frequency, disk frequency, etc.), transplanting time, fertilizer (amount and time of the applied fertilizer), pests, diseases and weed control, irrigation frequency, and harvesting issues (harvest time and yield) were collected. This information was gathered and complemented using questionnaires as well as face-to-face interviews with the farmers.
At the end of the growing season, the actual harvested yield is registered by farmers. For the purpose of this research, first, 100 farmers in the region were identified and chosen randomly. The farms were identified in such a manner as to cover all the main production methods in the specific region and the different management viewpoint as well. Then, information pertaining to farm management was collected. For collecting the information about paddy field management, all the agricultural functions were first separated. Next, from the start of each operation, data regarding temperature fluctuations, diversity in production methods, and different inputs quantities by the farmers in the region, and for providing broader information, typical information pertaining to agricultural operations, such as the data for starting operations and the entry quantities at each implementation stage (cultivation to harvest) in the paddy fields were collected and registered.
Estimation of the Yield gap by CPA Method
In order to determine the yield model (production model), the relationships between all the variables were measured, and the yield was evaluated by using the regression method (Soltani et al., 2016). The final model was obtained through a controlled trial and error method to quantify the effect of yield constraints. The average paddy yield was calculated by placing the observed average variables (Xs) in the fields under study in the yield model. Thereafter, by placing the best observed values of the variables in the yield model, the maximum obtainable yield was calculated. The difference between these two values was considered as the yield gap. The difference between the multiplication of the average observed value for each variable by its coefficient and the multiplication of the best observed value for the same variable by the coefficient of the same variable revealed the value of the yield gap for that variable. The ratio of the yield gap for each variable to the total yield gap showed its share in creating the yield gap, and was represented in percentage. Different procedures of the software SAS version 9.1 were used for the analysis.
RESULTS AND DISCUSSION
Documentation of the Production Process
103
Table 1. Description of climatic parameters in the survey period (2015-2016) and in the long term period (2001-2016) in Sari region
Month
Average min. temp. (°C)
Average max. temp. (°C)
Evaporation (mm/month)
Rain (mm/month)
Mean relative humidity (%)
Mean sunshine hours
Solar radiation (MJ m-2 d-1) 2015 2016 2015 2016 2015 2016 2015 2016 2015 2016 2015 2016 2015 2016
Apr.-May 9.5 10.8 19.5 18.6 71.8 63.2 98.7 99.3 76 77 157.7 123.6 14.7 13.5 May
-Jun 15.8 16.4 25.2 24.8 115.9 85.9 27.0 41.4 77 78 168.8 140.9 17.0 15.9
Jun.-Jul. 19.2 19.9 28.6 27.8 154.4 121.8 23.7 24.6 76 80 252.2 232.8 22.2 21.1
Jul.-Aug. 22.2 22.3 31.4 30.7 169.4 130.2 59.4 39.6 75 79 238.0 203.0 21.3 19.7
Aug.-Sep. 22.6 22.5 33.5 33.1 193.9 142.3 6.7 11.4 73 76 269.5 232.5 21.9 20.2
Sep.-Nov. 21.2 21.6 32.0 31.0 156.6 113.9 99.3 88.5 71 65 240.5 193.0 18.6 16.5 Mean
15 years
18.3 18.5 25.2 25.2 147.6 147.6 89.0 89.0 73.5 73.5 208.8 208.8 19.5 19.5
Table 2. Description of name, origin and other characteristics of rice cultivars in the experiment
Cultivar
Plant stature
Maturity condition
Growing period (days from seedling in the nursery to harvesting)
Paddy yield (kg ha-1)
Quality condition
Tolerance
to stress Type Origin
Tarom
Hashemi Tall
Early
maturing 118 days 4100
High quality
Low sensitive
Local cultivar Iran
Tarom
Mahalli Tall
Early
maturing 123 days 3600
High
quality Sensitive
Local cultivar Iran
Sang
Traom Tall
Early
maturing 120 days 4100
High quality
Sensitive Local cultivar Iran
Tarom
Deilamani Tall
Early
maturing 118 days 3850
High quality
Sensitive Local cultivar Iran
Tarom
Talaii Tall
Early
maturing 120 days 4100
High quality
Sensitive Local cultivar Iran
Tarom
Ashrafi Tall
Early
maturing 122 days 4200
High quality
Sensitive Local cultivar Iran
Gardeh Tall Early
maturing 122 days 4500
High quality
Relative sensitive
Local cultivar Iran
Tarom
Alam Sabz Tall
Early
maturing 118 days 4000
High
quality Sensitive
Local cultivar Iran
The data analysis of seeding date in the nursery showed that it started from March 11 and carried on till June 21 in the Sari region. Approximately, 70% of the farmers had completed seeding in the nursery in April; 34% of them doing it in the first half of April and 35% in the second half of April (Table 3). About 77% of the farmers had completed transplantation in May and 22 farmers did it in June. According to the findings, 30% of the farmers undertook transplantation in the first half of May and about 44% of the farmers started transplanting from mid-May (Table 3).
In terms of seedling frequency per plant, 100 fields varied (three to eight seedlings); three seedlings per hill were used in 11 paddy fields. In 28 fields, four seedlings per hill were used and in 23 fields, five seedlings per hill were used. Also, in 30 fields, farmers used six seedlings per hill (Table 3). The data analysis of the seedling age variable revealed that it ranged between 20 and 50 days. About 48% of the farmers used seedlings less than 30 days old. But, 42% of the studied fields were transplanted with old seedling from 30 to 40 days
104 In terms of phosphorus usage, 100 studied fields
varied from 0 to 130 kg ha-1. In 20 fields, phosphorus usage was reported as 38 kg ha-1; in 50% of the fields, phosphorus was used at 38 to 80 kg per hectare; in 20% phosphorus used was reported as 80 to 100 kg ha-1 (Table 3). Data analysis for potassium usage revealed that potassium usage varied from 0 to 150 kg ha-1. Also, in 45% of the fields non potassium usage was reported; in 30% potassium usage was less than 45 kg ha-1. In terms of nitrogen usage before transplanting, the 100 studied paddy fields varied from 0 to 230 kg ha-1. In 60% of the fields, nitrogen consumed was less than 49 kg ha
-1
before transplanting. In 30% of the fields, nitrogen usage before transplanting varied from 49 to 87 kg ha-1. Data evaluation showed that nitrogen application in vegetative stage was from 0 to 92 kg ha-1. Of the surveyed fields, 23 fields reported no consumption of nitrogen in the vegetative stage. In about 43% of the studied fields, nitrogen usage in the vegetative growing stage was less than 30 kg ha-1 (Table 3). The application of nitrogen after the flowering stage ranged from 0 to 58 kg ha-1. In 73% of the fields, no nitrogen usage was reported at this stage. These results indicated that farmers in the region do not appreciate the importance of fertilizer splitting and the significant share of nitrogen consumed at the flowering stage, and need to promote scientific findings. The data evaluation showed that zinc consumption in the 100 paddy fields varied from 0 to 34 kg ha-1. In 89% of the fields, zinc fertilizer application was not reported. In 11% of the remaining fields, the application of zinc fertilizer was reported as 3.4 to 34 kg ha-1. Moreover, sulfur consumption varied from 0 to 45 kg ha-1 in the 100 studied fields. In 55% of
the fields, sulfur application was not reported. In 20% of the fields, sulfur application was reported as 15 to 34 kg ha-1 and in 30% of the surveyed fields, sulfur consumption varied from 15 to 45 kg ha-1 (Table 3).
The frequency of insecticide usage in the 100 paddy fields varied from zero to three times. Insecticide was not used in five fields. In 36 fields, insecticide was used once, and in 50 fields, they were used twice to control pest (Table 3). Herbicide usage varied from zero to two times. There was no application of herbicide in six fields while they were used once in 26 fields and twice in 68 fields for weeds control. Moreover, in 83 fields, one-step weeding was done and it was undertaken twice for weed control in 17 fields. The frequency of fungicide application in the studied fields varied from zero to three stages. Out of these, there was no consumption of fungicide in 12 fields, one-step fungicide usage was reported in 59 fields, and fungicide was applied twice in 22 fields. In seven fields, the farmers applied fungicide in three stages (Table 3).
The data analysis shows that harvesting was carried out from 118 to 183 days after March 21 (beginning of spring). About 20% of the fields were harvested 132 days after March 21. In 50% of the fields, harvesting was undertaken 132 to 153 days after March 21 (Table 3). The range of paddy yields varied from 3100 to 5430 kg ha-1 in the 100 fields. In 10% of the fields, paddy yield was less than 3500 kg ha-1. The paddy yields in 20% of the fields varied from 3500 to 4205 kg ha-1. Also, in 60% of the studied fields, the paddy yields ranged from 4205 to 5200 kg ha-1 (Table 3).
Table 3. Mean, minimum, maximum, standard error (SE) and coefficient of variation (C. V.) for investigated variables in 100 paddy fields in Sari region
Variable Unit Mean Minimum Maximum SE C.V. (%)
Production history Year 19.48 2 51 1.12 57.46
Paddy field area Hectare 1.41 0.1 8 0.13 92.79
Seed rate kg ha-1 63 40 95 1.35 21.37
Seedling date in nursery Days after 21 March 21 -19 72 1.46 67.88
Transplanting date Days after 21 March 53 28 94 1.37 26.00
Seedling age Day 31 20 50 0.63 20.00
Seedling per hill Number 5.1 3 8 0.14 26.66
Planting density Plant per m2 25 10 66 1.04 41.37
Top dressing fertilizer Number 1.8 0 4 0.09 49.31
Nitrogen kg ha-1 84.99 18 230 4.15 48.84
Phosphorous kg ha-1 62.13 0 130 3.17 51.03
Potassium kg ha-1 27.54 0 150 3.38 122.86
N before transplanting kg ha-1 52.05 0 230 3.18 61.10
N in vegetative stage kg ha-1 25.88 0 92 2.21 85.24
N after flowering kg ha-1 7.06 0 58 1.38 195.66
Zinc usage kg ha-1 1.68 0 34 0.56 332.81
Sulfur usage kg ha-1 8.18 0 45 1.14 139.35
Insecticide Frequency 1.63 0 3 0.07 44.17
Herbicide Frequency 1.62 0 2 0.06 37.00
Fungicide Frequency 1.24 0 3 0.08 60.78
Weeding Frequency 1.17 1 2 0.04 32.27
Harvesting date Days after 21 March 147 118 183 1.37 9.30
105
Yield Gap Estimation by Comparative Performance Analysis (CPA Method)
Production Model
Results of the step-by-step regression to determine the most important management variables that affected the yield and production model are presented in Table 1. In this regression model, the paddy yield per unit area was considered as a dependent variable. The other variables such as Tarom Hashemi cultivar, potassium fertilizer, biological control by Trichogrammatidae bees, manual harvesting, and pest problem were considered as independent variables, and the result was presented in the final equation. Finally, using this production equation, the actual farm yield, the attainable yield, and the share of each variable on yield reduction were determined. Therefore, from about 150 studied variables, the model (final regression equation) was selected with five independent variables (Table 4). The final yield equation is as follows:
Y (kg h-1) = 4399 + 246 X1 + 6 X2 + 823 X3 - 2X4 – 182
X5
Where Y is the paddy yield in kilogram per hectare, X1 is the Tarom Hashemi cultivar, X2 is potassium
application, X3 is the biological control by
Trichogrammatidae bees, X4 is manual harvesting, and
X5 represents the pest problem, and these continue for
the evaluation of each of the factors that influenced the paddy yield.
Paddy yield limiting factors and yield gap estimation
Table 2 presented the variables applied in the production equation with the mean, minimum and maximum values observed in the paddy fields. The characteristics of the variables applied in the model as the average, minimum, maximum, and best values that could be applied in the yield regression model are presented in Table 4. To derive the best condition for the variables including Tarom Hashemi cultivar, potassium consumption, and Trichogrammatidae bees with positive effect, their maximum values were
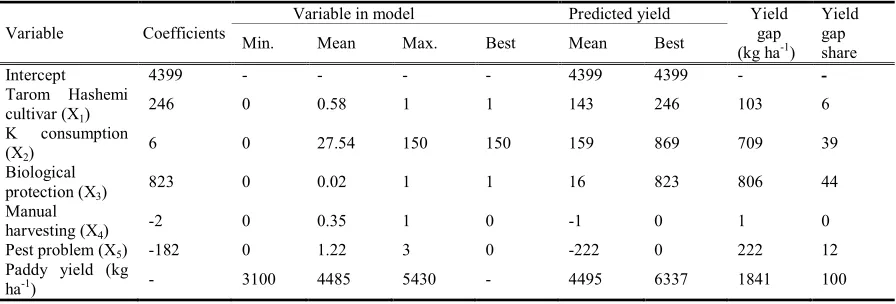
selected. Hand harvesting and pest problem variables were negative variables and were selected in small amounts; therefore, the optimal value was equivalent to the minimum of these two variables. The increase in paddy yield caused by the difference between the best and the medium state of hand harvesting and pest problem variables was equal to 0 and 12% of the total paddy yield increase of 1 and 222 kg ha-1, respectively. The paddy yield increase related to the effect of potassium consumption and biological control by Trichogrammatidae bees was 709 and 806 kg ha-1, respectively, and equal to 39 and 44% of the total changes in yield (Table 4).
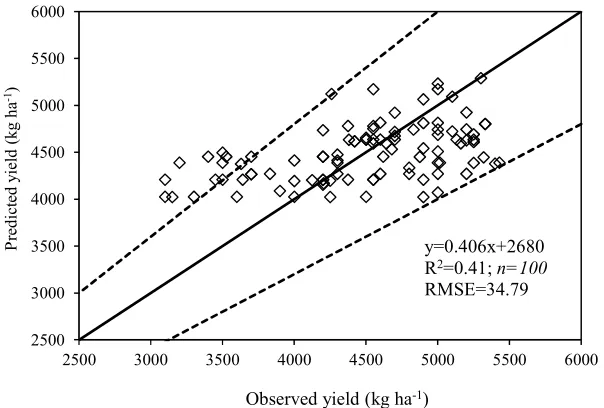
Among the five variables entered in the model, the effects of potassium consumption and biological fight were remarkable, which compensated for a significant part of the yield gap in the fields with the farmers managing potassium consumption and using integrative pest control method. The results listed in Table 4 show the total yield and the share of each factor limiting the production relative to it. In the production model, the average and the maximum yields were estimated to be 4495 and 6337 kg ha-1, respectively, which is comparable to the average and maximum yields (4485 and 5430 kg ha-1). The total yield gap estimated was equal to 1841 kg ha-1. This means that there was a gap between the actual yields of the farmers and what they could have potentially harvested with 1841 kg ha-1, which could be eliminated or reduced with better management (Table 4). The results in Fig. 1. illustrate the contribution of each variable to the yield gap along with the actual and the potential yields. Therefore, the actual yield and the potential yield were estimated to be 4495 and 6337 kg ha-1, respectively, and the yield gap was 1841 kg ha-1. This result suggests that this yield gap could be compensated (Fig. 1). The findings in Fig. 2 show the relationship between the actual yield (observed yield) and the predicted yield (simulated yield). These statistics show that the accuracy of the model (production equation) is appropriate, and it can be used to estimate the yield gap and to determine the contribution of each production-limiting variable.
Table 4. Quantifying the rice yield gap and the contribution of each variable entered in the production equation
Variable Coefficients
Variable in model Predicted yield Yield gap (kg ha-1)
Yield gap share
Min. Mean Max. Best Mean Best
Intercept 4399 - - - - 4399 4399 -
-Tarom Hashemi cultivar (X1)
246 0 0.58 1 1 143 246 103 6
K consumption (X2)
6 0 27.54 150 150 159 869 709 39
Biological protection (X3)
823 0 0.02 1 1 16 823 806 44
Manual
harvesting (X4) -2 0 0.35 1 0 -1 0 1 0
Pest problem (X5) -182 0 1.22 3 0 -222 0 222 12
Paddy yield (kg
106
Fig.1. The amount of the main yield gap constraints in the 100 monitored paddy fields.
Fig. 2. The relationship between observed vs. predicted yields. Twenty percent of the differences between predicted and observed yields are shown by dashed lines.
The conventional cultivation faces many problems due to lack of understanding of the requirements of the rice crop (Dastan et al., 2015b). The excessive consumption of water, fertilizers and chemical pesticides not only leads to increased production costs, but also reduces yield and destroys resources and the environment in the long term (Dastan et al., 2016; Dastan et al., 2015a). Performing the related practices during the rice growing season will result in increase of the yield. Fertilization, irrigation and combating weeds and diseases are important in crop operations and are considered by most farmers during the growing season (Yadi et al., 2017). Crop management of important rice diseases includes: planting pests and disease-tolerant cultivars, deep plowing of plant remains after harvest, adherence to correct principles of rice farming such as planting distance, planting time (early planting to avoid
blast disease), irrigation suitable optimum use of fertilizers, especially the use of nitrogen fertilizer splitting, eliminating weed host interfaces, observing crop rotation between local and high yielding cultivars, appropriate drainage of paddy field and crop health. Despite the fact that the use of chemical pesticides was not completely eliminated by farmers, it was significantly reduced as compared to the biological control (Dastan et al., 2018).
The goal of many researchers is to increase yield to a reasonable level for maintaining food prices to the extent that it is both affordable to the consumers and the product price can cover the costs for the farmers as well. It seems that a yield equivalent to 80% of the potential yield is economically desirable under most planting systems (Lobell et al., 2009). Huang et al. (2008) investigated the effect of management parameters, but 0
1000 2000 3000 4000 5000 6000
Pests problem
Manual harvesting
Biological protection
Potassium usage
Tarom Hashemi cultivar
Actual yield
2500 3000 3500 4000 4500 5000 5500 6000
2500 3000 3500 4000 4500 5000 5500 6000
P
re
d
ic
te
d
y
ie
ld
(
k
g
h
a
-1)
Observed yield (kg ha-1)
y=0.406x+2680 R2=0.41;n=100
107 the purpose of their probe was not to find the best
management method. Rather, they investigated the effects of four treatment management methods on the relationship between precipitation and yield by using the boundary line analysis. Pradhan (2004) also investigated effective factors in maize yield gap, and perceived that soil with light texture, farm area, the number of cultivated seeds per hill, and non-carrying out of thinning operations were 27, 30, 30, and 13% effective, respectively, and they were the most important factors for yield reduction in corn. A global simulation study of the main crops corn, wheat, and rice found that the rice yield gap was internationally about 29%, but the calculated yield gap in this research was estimated to be 11.07-14.73% (Mueller et al., 2012). By considering the fact that the calculated potential yield was derived from actual data in each paddy field, the yield potential was related to the region, and could be achieved. In reality, multi-zone trace researches are restricted by cultivation and harvest data, and different climate and soil conditions (van Ittersum et al., 2013) whereas the potential yield obtained at a research station or calculated via simulation with a planting model does not have these constraints. Nalley et al. (2016) estimated that herbicide tolerant cultivars and hybrid ones had higher yields than local cultivars. Other researchers have reported that the use of improved cultivars of rice, soil fertility management, weed management, and irrigation had a big share in increasing the obtainable yield in China in past decades (Huang et al., 2011). Achieving a yield beyond 80% of the potential yield, although possible, may not be economically feasible for farmers in the region, given the cost of machinery, fertilizers, pesticides, as well as overlapping planting seasons. In addition, empirical observations showed that the most important gap problem for the high yield of
crops in Iran was due to inefficient management practices in the fields by the farmers.
CONCLUSIONS
According to the findings, the high rate of yield gap and the contribution of each factor affecting yield gap showed that with proper management, a significant part of this potential yield gap could be compensated. It is rate to achieve the actual potential yield of crops, and in practice, only part of it is taken as real crop from the field. Although the purpose of this research was to estimate the rice yield gap in Mazandaran province, the reasons for this yield gap were studied further, and the most likely solution to increase yields and reduce the yield gap was found to be improved crop management by the farmers. Hence, among the five variables entered in the model, the effects of potassium application and biological fight were remarkable, which the paddy yield increase by these variables was 709 and 806 kg ha-1, respectively, and equal to 39% and 44% of the total yield variation. In the production model, the average and the maximum yields were estimated to be 4495 and 6337 kg ha-1, respectively, the total yield gap estimated was equal to 1841 kg ha-1. Therefore, a significant part of the yield gap in the fields could be compensated with the farmers managing five variables entered in the model especially potassium application and using integrative pest control method.
CONFLICTS OF INTEREST
The authors have no financial conflicts of interest to declare.
REFERENCES
Beza, E., Silva, J. V., Kooistra, L., & Reidsma, P. (2017). Review of yield gap explaining factors and opportunities for alternative data collection approaches. European Journal of Agronomy, 82, 206-222.
Dastan, S., Nurmohamadi, G., Madani, H., & Soltani, A. (2015a). Analysis of energy indices in rice production systems in the Neka region. Environmental Science, 13(1), 53-66. (in Persian).
Dastan, S., Soltani, A., & Alimagham, M. (2018). Documenting the process of local rice cultivars production in two conventional and semi-mechanized planting methods in Mazandaran province. Cereal Research, 7(4), 485-502. (in Persian).
Dastan, S., Soltani, A., Nurmohamadi, G., & Madani, H. (2015b). CO2 emission and GWP of energy usage in paddy
field production systems. Journal of Agroecology, 6(4), 823-835. (in Persian).
Dastan, S., Soltani, A., Nurmohamadi, G., & Madani, H. (2016). Estimation of the carbon footprint and GWP in rice production systems. Environmental Science, 4(1), 19-22. (in Persian).
Delmottea, S., Tittonell, P., Moureta, J. C., Hammonda, R., & Lopez-Ridaura, S. (2011). On farm assessment of rice yield variability and productivity gaps between organic and conventional cropping systems under Mediterranean climate. European Journal of Agronomy, 35, 223-236. Espe, M. B., Cassman, K. G., Yang, H., Guilpart, N., Grassini,
P., van Wart, J., Anders, M., Beighley, D., Harrell, D., Linscombe, S., McKenzie, K., Mutters, R., Wilson, L. T., & Linquist, B. A. (2016b). Yield gap analysis of US rice production systems shows opportunities for improvement. Field Crops Research, 196, 276-283.
Espe, M. B., Yang, H., Cassman, K. G., Guilpart, N., Sharifi, H., & Linquist, B. A. (2016a). Estimating yield potential in temperate high- yielding, direct-seeded US rice production systems. Field Crops Research, 193, 123-132.
FAO. (2019). FAO rice market monitor (RMM). Retrieved from: http://www.fao.org/economic/est/publications/rice-publications/rice-market-monitor-rmm/en/.
Yousefian et al. / Iran Agricultural Research (2019) 38(1)101-109
108
CPA method in Neka region. Agroecology Journal, 11(1), 277-294. (In Persian).
Gorjizad, A., Dastan, S., Soltani, A., & Ajam Norouzi, H. (2019b). Large scale assessment of the production process and rice yield gap analysis by comparative performance analysis and boundary-line analysis methods. Italian Journal of Agronomy, 14(1174), 123-131.
Habibi, E., Niknejad, Y., Fallah, H., Dastan, S., & Barari, D. (2019a). Estimation of yield gap of rice by comparative performance analysis (CPA) in the Amol and Rasht regions. Journal of Plant Production, 42(3), In Press (In Persian). Habibi, E., Niknejad, Y., Fallah, H., Dastan, S., & Barari, D.
(2019b). Life cycle assessment of rice production systems in different paddy field size levels in north of Iran. Environmental Monitoring and Assessment, 191,202. DOI: 10.1007/s10661-019-7344-0
Halalkhor, S., Dastan, S., Soltani, A., & Ajam Norouzi, H. (2018). Documenting the process of rice production and yield gap associated with crop management in local cultivars of rice production (Case study: Mazandaran Province, Babol Region). Journal of Crops Improvement, 20(2), 397-418. (In Persian).
Huang, M., Zou, Y. B., Jiang, P., Xia, B., Md, I., & Ao, H. J. (2011). Relationship between grain yield and yield components in super hybrid rice. Agricultural Science in China, 10, 1537-1544.
Huang, X., Wang, L., Yang, L., & Kravchenko, A. N. (2008). Management effects on relationships of crop yields with topography represented by wetness index and precipitation. Agronomy Journal, 100, 1463-1471.
Kayiranga, D. (2006). The effects of land factors and management practices on rice yields. International Institute for Geo-Information Science and Earth Observation Enschede (ITC). The Netherlands, 72 p.
Lobell, D. B., Cassman, K. G., & Field, C. B. (2009). Crop yield gaps: Their importance, magnitudes, and causes. Annual Review of Environment and Resources, 34, 179-204.
Ministry of Jihad-e-Agriculture of Iran. (2016). Annual Agricultural Statics. Retrieved from: www.maj.ir
Mueller, N. D., Gerber, J. S., Johnston, M. Ray, D. K., Ramankutty, N., & Foley, J. A. (2012). Closing yield gaps through nutrient and water management. Nature, 490, 254-257.
Nalley, L., Tack, J., Barkley, A., Jagadish, K., & Brye, K. (2016). Quantifying the agronomic and economic performance of hybrid and conventional rice varieties. Agronomy Journal, 108(4), 1514-1523.
Nezamzadeh, E., Dastan, S., Soltani, A., & Ajam Norouzi, H. (2019). Evaluation of yield gap associated with crop management in rapeseed production using comparative performance analysis (CPA) and boundary- line analysis (BLA) methods in Neka region. Applied Field Crops Research, In Press. (In Persian).
Pishgar- Komleh, S. H., Sedeedpari, P., & Rafiee, S. (2011). Energy and economic analysis of rice production under different farm levels in Guilan province of Iran. Energy, 36, 5824-5831.
Pradhan, R. (2004). The effect of land and management aspects on maize yield. International Institute for Geo-Information Science and Earth Observation Enschede (ITC). The Netherlands, 52 p.
Reidsma, P., & Jeuffroy, M. H. (2017). Farming systems analysis and design for sustainable intensification: New methods and assessments. European Journal of Agronomy, 82, 203-205.
Rezvntalab, N., Dastan, S., & Soltani, A. (2019). Identification of yield constraints and yield gap monitoring of local rice (Oryza sativa L.) cultivars in Mazandaran province. Iranian Journal of Crop Sciences, 21(2), In Press (In Persian).
Silva, J. V., Reidsma, P., Laborte, A. G., & van Ittersum, M. K. (2017). Explaining rice yields and yield gaps in Central Luzon, Philippines: An application of stochastic frontier analysis and crop modeling. European Journal of Agronomy, 82, 223-241.
Soltani, A., Hajjarpoor, A., & Vadez, V. (2016). Analysis of chickpea yield gap and water-limited potential yield in Iran. Field Crops Research, 185, 21-30.
Tanaka, A., Diagneb, M., & Saito, K. (2015). Causes of yield stagnation in irrigated lowland rice systems in the Senegal River Valley: Application of dichotomous decision tree analysis. Field Crops Research, 176, 99-107.
Tanaka, A., Saitob, K., Azomab, K., & Kobayashi, K. (2013). Factors affecting variation in farm yields of irrigated lowland rice in southern-central Benin. European Journal of Agronomy, 44, 46-53.
van Ittersum, M. K., Cassman, K. G., Grassini, P., Wolf, J., Tittonell, P., & Hochman, Z. (2013). Yield gap analysis with local to global relevance-A review. Field Crops Research, 143, 4-17.
van Wart, J., Kersebaum, K. C., Peng, S., Milner, M., & Cassman, K. G. (2013). Estimating crop yield potential at regional to national scales. Field Crops Research, 143, 34-43.
Xu, X., He, P., Zhao, S., Qiu, S., Johnston, A. M., & Zhou, W. (2016). Quantification of yield gap and nutrient use efficiency of irrigated rice in China. Field Crops Research, 186, 58-65.
109
! " #$
% .'" ! ' ( ) ) " %*+ ) , - ./ ) ) 01 . )! 2 % ( 3) 4
5 " .6 ( 1394 1395 % ), < =#1 . - '>? - % (
. ! . @ % - A 1
! )B C D % E F1 0 #1 . ( E F1 ) %*+ ) .# . )! 2 40
. 95
H# ) # ( ) A I F1 " % .
20 . 50 , 1 '- K . ! ) 10
. 66 %
M" EN # 1 C D . H# O # ) 30
! E !) F ! P) 46
. 83 ) # ( ) A I
M" 40 E !) F ! P) 83
. 138 ) # ( ) A I ) .
73 % ), ! P) C D 3 (
S # - % . F1 T) ,I .( I % U ! EN # 1
3100 . 5430 ) A I
) # ( )
60 % ), ! P)
S # - 3% + ) (
4205 . 5200 A I
) ) %$ * T ) ) . H# ) # ( )
CPA
$1 #W . X 3(
4495 6337 - ) ) # ( ) A I 1841
0 W ! . ) # ( ) A I
% %4U X 2 .#$ ! 5 # K " #W ) ? 3 % ) - ) H# % Z , [ 709
806 5 ) # ( ) A I 39
44 . 1 E F1 ) P)
\ 6 ! - %>" $1 #W % % %] 3 3 - P U % ), ( . X (
. .'" 5 DU X $1 #W % '^I E
:
:' ) ` ) 23
/ 11 / 1397
:T BW ` ) 4
/ 6 / 1398
` ) :." #" 27 / 7 / 98
:
. X
'" . #
5
CPA
.#
$1 #W
) E !) F 2 * * 1398
( 38 ) 1 ( 101 -109
!"# $ % &'
(" ) * + ( , -
.
/ " 0
% ( 12".
/ 3% . 4
1
62 7 % 8 9# 0
2
&%( / ) % 0
/
3 *
0
<, 8 '=
$
2
1
1
3' )! I 3 !) F F1
3E I I 3E I I U 3. " ! cF1 .d
E .
2
3' )! I E I I . >6 O !) F A cF1
3 3E I I .d E .
3
d 3E !) F N cF( eW
3 .d E .
*
5 f$ $ 1