Tribology in Industry
www.tribology.rsSimulation of Contact Area and Pressure
Dependence of Initial Surface Roughness for
Cermet-Coated Discs Used in Disc Brakes
G. Riva
a, G. Perricone
a, J. Wahlström
baBrembo S.p.A., Stezzano (BG), Italy,
bKTH Royal Institute of Technology, Stockholm, Sweden.
Keywords:
Disc brakes Wear
Cellular automaton Contact plateaus Contact area Surface topography
A B S T R A C T
Friction, wear, and emission performance strongly depend on the contact pressure and area at the interface of the pad and disc. The contact situation at the pad-to-disc interface can be explained by the formation and destruction of mesoscopic sized contact plateaus on the pad surface. Experimental studies report that the initial surface roughness of cermet-coated discs strongly affects friction, wear and emission performance. This is explained by the formation of secondary plateaus on the disc surface. The aim of this work is to extend an existing cellular automaton approach to include the formation of secondary plateaus on the disc surface in order to explain experimental results reported in the literature. First, to investigate the validity of the novel simulation approach, a cermet-coated cast iron disc is tested against a low-met pad material with a pin-on-disc tribometer. The same conditions are used as input in a simulation. Then, the initial disc roughness influence on contact pressure and area of the same cermet-coated disc is compared with results reported in the literature. The topographies of the measured and simulated disc surfaces are qualitatively in line. An initial rougher disc surface results in a considerably lower contact area than does a smother surface.
© 2019 Published by Faculty of Engineering
Corresponding author:
Gabriele Riva
Brembo S.p.A., viale Europa 2 Stezzano (BG) 24040, Italy. E-mail: [email protected]
1. INTRODUCTION
Non-exhaust emission is a problem for the air quality of several European cities [1]. One important source of non-exhaust emission from the transportation sector is disc brakes [2]. Disc brakes are used in vehicles (e.g. cars, motorbikes, and trains) to reduce the vehicle speed. A disc brake consists of a calliper with one or more pistons, two brake pads, and a disc.
Pressure is applied inside the calliper when the driver brakes and the piston(s) push the pads against the rotating disc, which is fixed to the wheel. The frictional force between the pads and disc reduces the vehicle speed. The brake emissions originate from the wear of the sliding contact surfaces of the pads and disc.
The pad friction material used in passenger cars is a composite material. It can be divided into
R
ES
EA
R
four groups [2]: a binder, reinforcing fibres, fillers, and frictional additives. The binder holds the components of the brake pad together and is usually made of polymer-based resin. The reinforcing fibres (e.g. brass, steel, copper, ceramic) give mechanical strength to the pad and carry most of the load. Fillers are used to reduce the cost and to modify some pad properties. Frictional additives are used to control the friction and wear.
Two main groups of discs are used for passenger cars: cast iron and carbon ceramic material. Carbon ceramic discs are wear-resistant but are relatively expensive. Cast iron discs are therefore used in most vehicles. It has been reported in the literature that unconventional high velocity oxygen-fuel (HVOF) cermet-coated discs [4,5] and AlSiC MMC discs [6] have demonstrated a significant decrease in wear and emission.
The coating treatment is important because it influences the roughness of the disc surface. Federici et al. [5] showed that the effect of initial surface roughness of the HVOF cermet-coated surfaces has an important role for the tribology. Federici et al. [7] also studied the effect of the surface roughness and skewness of a HVOF coated disc on the running-in with a pin-on-disc tribometer. This study shows that the initial disc topography is important for both the run-in time and the steady state level. A higher coefficient of friction and a lower specific wear rate were measured with a relatively lower initial roughness and skewness of the disc surface.
The tribology (friction and wear) and emission performance strongly depend on the contact pressure and area at the interface of the pad and disc. In general, the pad-to-disc transient contact situation can be explained on different size scales. The macroscopic wear behaviour can be explained by the creation and destruction of mesoscopic-sized contact plateaus [9–11] and the friction can be explained by a nanocrystalline third body tribofilm formed on the contact surfaces [12– 14]. In the former, the wear debris from the pad and disc surfaces are transported by the disc rotation at the interface between the pads and the disc. Some of these wear particles pile up against the reinforcing fibres of the pads (primary plateaus) and form secondary plateaus. Experimental studies [4,5] show that
secondary plateaus are created in the lowlands of HVOF cermet-coated discs and that the highlands act as primary plateaus.
Experiments can be used to study the contact surfaces before and after testing, but it is hard to study what is happening at the contact interface during braking. There are some studies in the literature [15,16] that have used a glass disc to video-record the creation of secondary plateaus on the pad surface. It is not possible to use this technique to study the disc surface influence on the contact situation. Simulations could help to better understand the transient situation of the pad-to-disc contact.
The literature reports different simulation approaches to investigate the tribology (e.g. [17]-[20]), heat transfer (e.g. [22]-[28]), and airborne particle emission ([29],[30]) from disc brake systems. Finite element analysis (FEA) approaches are the most commonly used to simulate the macroscopic tribology performance of disc brakes. A conventional FEA approach is not enough to resolve the contact plateaus since their size is typically between 50 – 500 µm [8]. With the typical size of contact plateaus in mind, some authors [31–35] have used cellular automaton (CA) approaches to simulate creation and destruction of secondary plateaus on the pad surface. Recently, Ostermeyer et al. [35] expanded the standard CA approach into an abstract cellular automaton approach combining the classical grid-base CA with the multi-body techniques. This approach can consider complex dissipation phenomena on the entire brake pad surface. No studies have focused on simulation of the creation of secondary contact plateaus on the disc surface and how it affects the contact pressure and area.
disc surface topography changes during braking which results in that the pad-to-disc contact situation changes in terms of contact pressure and contact area. To evaluate this, disc surfaces with different initial surface roughness found in literature [6] are used as simulation input.
2. SIMULATION APPROACH
Figure 1 shows an overview of the simulation routine as presented by Riva et al. [36]. This is an extension of the work presented by Wahlström et al. [32–34] to include the formation and destruction of secondary plateaus on the disc surface. The friction and contact temperature are not considered in the present work to reduce the computational time. The idea of this approach is to consider how the surface
topography changes due to wear and plateau formation, and how these changes influence the contact pressure and area.
First, the pre-process operations are done: discretizing space and time, setting material properties, and selecting the test conditions. A Winkler’s type elastic foundation model [37] is used to calculate the local contact pressure. A generalization ([38],[39]) of Archard’s wear law [40] is used to determine the wear of the contact surfaces. Thereafter, the plateau dynamics are simulated by using logical rules. In the present paper, novel formation and destruction rules of secondary plateaus on both the pin and disc surfaces are introduced. The simulation results consist of surface topographies, plateau dynamics, contact pressure distribution, and contact area. Each of the steps in the simulation algorithm are explained below.
2.1. Pre-process
The simulated area of the pad and the disc surfaces are discretized with 2D-meshes. The coordinate system is cylindrical with θ and r as the angular and the radial coordinates. The mesh is represented in Fig. 1 box 1. The disc and pad surfaces have the same mesh size.
The temporal discretization requires defining the total physical simulation time (tsim) and the
time step (Δt). The total physical time is chosen according to the simulated test. The physical time step is defined by the ratio between the angle between two nodes θi and the disc angular
velocity ω:
i
t
(1)
After spatial and time discretization, it is necessary to assign material properties and initial cell plateau status to every cell. Disc material and pad fibres correspond to the status primary plateaus, pad resin corresponds to the status none, and secondary plateaus on the pad and disc correspond to the same status of secondary plateaus. Finally, the pad normal load (FN) and the disc angular velocity (ω) are set.
2.2. Contact modelling
The model used to calculate the local contact pressure between disc and pad surfaces is a Winkler-type elastic foundation model [37]. The contact is modelled as a set of elastic bars deformed independently by a rigid indenter (see Fig. 1 box 2). Only normal forces are considered in this work. The rigid indenter is defined as the gap (zr) between the pad (zd) and disc (zp) surfaces
before the load is applied as [37]:
r d p
z z z (2)
The foundation deformation (ũz) is equal to the
difference between the indenter displacement (δz) and its geometry (zr) if the displacement is
bigger than zr [37]:
0 z r z r z z r z z u z (3)
The contact pressure (p) is defined according to the linear law of elasticity [37]:
z
E
p u
h
(4)
where h is the foundation height, and E is the combined Young’s modulus. E can be computed as a function of the Young’s modulus (υ) and the Poisson’s ratio of pads and disc [37]:
1
2 2
1 p 1 d
p d E E E
(5)
2.3. Wear modelling
A generalization [38,39] of Archard’s wear law [40], as suggested by Podra and Andersson [41], is used to determine the pad and disc wear. In this approach, the derivative of the surface depth (h) is a function of the contact pressure (p), the specific wear rate (k), and the radial coordinate (r) [40]:
dh kpr
d (6)
The wear depth is estimated by numerical integration of Eq. (6) during a small rotation (Δθ). The wear of the resin is set to be instantaneous when it is in contact. A parameter
hm is chosen for this purpose. Therefore, the
incremental wear depth (Δhi) of a cell can be
estimated as [40]:
0, plateau cell 0, resin cell
i i
m
k pr p
h h p (7)
where ki is the specific wear rate of the cell in
contact. If there is no contact, the pressure is equal to zero and the cell does not wear.
2.4. Plateau dynamics modelling
Logical rules are defined to describe the secondary plateau dynamics on pad and disc surfaces. These are empirical rules coming from observation of plateau formation on a pad run against a glass disc [15,16] and analysis of contact surfaces after tests (e.g. [7–13]). The rules are subdivided into two categories: formation and destructions rules.
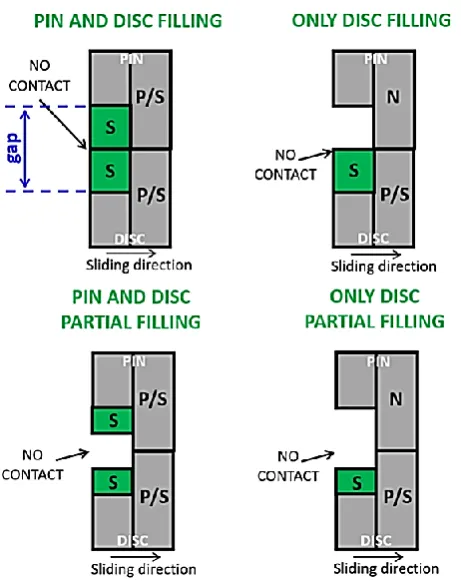
of wear is enough to totally fill the gap; the second case occurs when the amount of wear can a portion of the gap. A secondary plateau cell is formed if the following occur: there is a gap, the wear is more than zero, and the neighbour cell in the sliding direction is a plateau (secondary or primary). If the neighbour cell is a plateau on both pad and disc surfaces, the secondary plateau is formed on both pad and disc contact surfaces (Fig. 2: case 1 and 3). If the neighbour cell in the sliding direction is a none-status cell on the pad surface, a secondary plateau is formed on the disc surface (Fig. 2: case 2 and 4). Note that on the disc surface only primary or secondary plateau status are possible. The amount of wear used to create the secondary plateau is removed from the total amount of wear to respect mass conservation.
Fig. 2. Secondary plateau creation rules S=Secondary plateau, P=Primary plateau, and N=None status).
The creation process of secondary plateaus in a lowland of the disc surface is illustrated in Fig. 3. The number of a green brick indicates the formation order of the secondary plateau in the lowland of the disc surface. Note that the addition of secondary plateaus represents just a change in the cell height property.
Fig. 3. An illustration of the secondary plateau formation order in a lowland on the disc surface.
Fig. 4. Secondary plateau destruction rules (S=Secondary plateau, P=Primary plateau, and N=None status).
3. INPUT PARAMETERS
Federici et al. [6] used a pin-on-disc tribometer to study the effect of different surface roughness of cermet-coated cast iron discs sliding against low-metallic pins on friction and wear. A test with the same type of materials was run with a tribometer [4] to investigate the validity of the novel plateau formation rules. The simulation and test conditions (see Table 1) are the same as those used in [4][6]. The test time is 7200 s while the simulation time has been reduced to 3000 s to decrease the computational time. Note that a standard downhill test used by the industry is usually not longer than 3000 s. The parameters used in the present study are shown in Table 2.
Table 1. Test conditions used in the pin-on-disc tribometer tests as presented by Federici et al [6].
Disc Pin Rotational speed, ω [rpm] 850 - Normal force, Fn [N] - 47
Middle radius of wear track,
rm [mm] 22 -
Pin radius, rp [mm] - 5
Test time, tend [s] 7200
Table 2. Input parameters used in the simulations. Disc Pin Sliding speed, v [m/s] 2 - External radius simulated,
re [mm] 24 24
Internal radius simulated,
ri [mm] 20 24
No. of nodes in r direction 80 80 No. of nodes in θ direction 2764 161 Radial distance between
nodes, Δr [μm] 50 50
Time step, Δt [μs] 25.4
Specific wear rate, ki [Pa-1] 0
5·10-14 patch materials 5·10-6 resin Wear height of resin
material, hm [μm] - 5
Young’s modulus, Ei [Pa] 1011
109 primary plateaus 105 resin Poisson’s ratio, υi 0.27 0.27 Height of foundation, h [μm] 50 Simulation time, tsim [s] 3000
3.1. Initial surfaces
The disc surface (8 mm square) was measured with a Taylor/Hobson Form TalySurf PGI 800 before and after the test. The disc sample was marked to be able to measure the same area region after the test. The measured surface was used as the initial disc surface in the simulation after the left part of the Abbot graph was removed from the surface with a cut-off height of 3 μm. The measured surface was repeated around the circumference to have a full disc ring. The initial disc surface height was divided by 10 and by 100 to have similar surface roughness cases as studied by Federici et al. [6]. The initial generated disc surface is shown in Fig. 5.
Fig. 5. Initial generated disc surface profile used in the simulations.
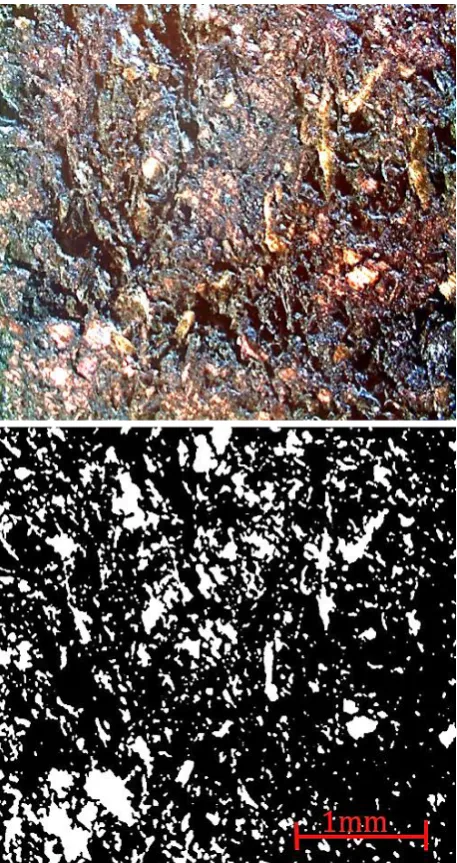
Fig. 6. Original picture from optical microscope (upper) and the corresponding generated input surface (lower) of the pin surface.
Fig. 7. Initial generated pad surface profile used as input in the simulations.
4. RESULTS AND DISCUSSION
4.1. Experimental vs. simulation results
The initial and final disc surfaces for both the experimental and simulation results are shown in Fig. 8. The final measured disc surface has been repeated along the circumference in the same way as the initial surface. This repetition results in a symmetrical distribution of the presented results. The simulation disc surface is partially filled with a higher filling toward the internal radius (Fig. 8: lower-left). It is possible to see how the lowlands of the disc surface are almost filled by secondary plateaus after 2 hours of testing (Fig. 8: lower-right). Only a few holes cannot be filled by the wear debris. By comparing the measured (Fig. 8: lower-right) and the simulated disc surface (Fig. 8: lower-left), it is possible to see that the same lowlands are still not covered on both the surfaces.
Moreover, the lowlands on the inner radius seem to be partially filled in both cases. The above mention differences between the measured and simulated surfaces could be explained by the difference in the time used in the test and simulation. Wahlström et al. [4] tested the same kind of materials with a pin-on-disc tribometer and presented SEM images of the secondary plateaus created on a cermet-coated disc surface. Federici et al. [42] investigated cermet-coated discs at room temperature and at 300 °C and presented SEM images of the disc surfaces. The shape, size, and amount of simulated secondary plateaus are in line with the above mention experimental results which suggest that the proposed simulation approach may be used to simulate secondary plateau formation on disc surfaces.
4.2. Simulation results: different disc roughness comparison
Figure 9 shows the simulated disc surface topography after 3000 s. The three pictures represent the same surface topography divided by 10 and 100. The results show that the surface divided by 100 is almost filled, the surface divided by 10 is about 90 % filled, and the baseline is about 70 % filled after the simulations. This means that the wear debris coming from the pin are enough to fill all the lowlands on the disc surface divided by 100, but the wear coming from the pin it is not enough to fill the surfaces with a higher roughness.
The cell status of the disc surface is presented in Fig. 10. It is possible to see that a lower initial
roughness results in a higher creation of secondary plateaus. This behaviour cannot be explained by partial filling since the Fig.10 only represents the disc cell status. One explanation is that the higher the contact area, the more uniform the wear is, and, therefore, the more uniform the plateau formation on the disc surface is.
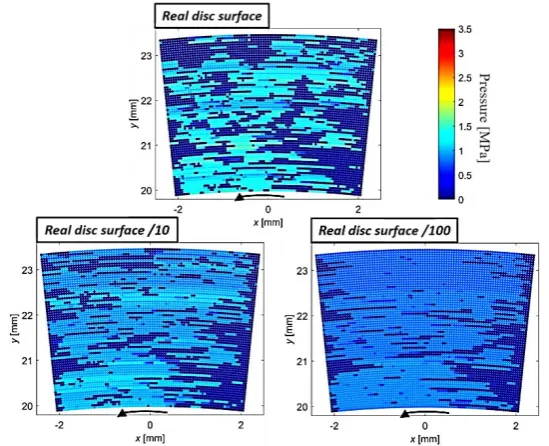
The different initial disc surface also causes some effects on the pad surface. By observing the pad surface height (Fig. 11), it is possible to recognize that a smoother disc surface coupled with the pin will result in a smoother pin surface at the end of the simulation. This can be explained by the lower presence of highlands on the disc surface that causes a non-uniform contact and, therefore, a non-uniform wear of the pin. Moreover, as on the disc surface, the secondary plateau formation (Fig. 12) is higher on the smoother pins. It is important to note that the pin surface can also wear. One hypothesis can be that the wear does not destroy the secondary plateau that piles up on the pin surface. This could be caused by the larger contact area and therefore the smoother contact pressure (Fig. 13). In fact, the contact pressure maps show that pins coupled with relatively lower disc roughness results in a more uniform pressure distribution.
The different pressure distributions (Fig. 13) are a consequence of the different contact areas.Fig. 14 shows the total contact area as a function of time. A higher roughness of the disc surface leads to a longer run-in time. Neither the real surface nor the real surface divided by 10 reach the steady state condition.
Fig. 10. Simulated disc cell status after 3000 s. Upper: real disc surface profile as input. Lower-left: the surface profile of the real surface divided by 10. Lower-right: the surface profile of the real surface divided by 100.
Fig. 11. Simulated pad surface profile after 3000 s. Upper: real disc surface profile as input. Lower-left: the surface profile of the real surface divided by 10. Lower-right: the surface profile of the real surface divided by 100.
Fig. 13. Simulated contact pressure distribution after 3000 s. Upper: real disc surface profile as input. Lower-left: the surface profile of the real surface divided by 10. Lower-right: the surface profile of the real surface divided by 100.
The coefficient of friction can be explained by a nano-sized thick tribofilm created on both contact surfaces [12]. In this model, the coefficient of friction decreases with increasing contact pressure, since the nano-sized thick tribofilm will be thicker and easier to shear as discussed by Österle et al. [13]. In the present work, this means that the coefficient of friction is higher for the relatively smoother surfaces than the relatively rougher surfaces. This is in line with Federici et al. [6], who tested four different surface roughness (Ra = 0.04 – 5 µm) of
cermet-coated discs using a pin-on-disc tribometer. They concluded that the measured coefficient of friction increases with decreasing roughness.
Fig. 14. Simulated contact area. Black: real disc surface profile as input. Blue: the surface profile of the real surface divided by 10. Red: the surface profile of the real surface divided by 100.
Different initial disc surface roughness results in a different run-in time as can be seen in Fig. 14. This could be explained by that there are more lowlands to fill for a relatively rougher disc surface. On the other hand, it seems that the lowlands are not filled for the relatively rougher disc surfaces even if they were run for a longer time since the steady state levels in the contact area differ. This could indirectly explain the differences in the coefficient of friction observed in experiments by Federici et al. [6]-[7]. This means that different initial roughness conditions result in different steady states, not only in a different run-in time.
5. CONCLUSIONS
A numerical approach based on cellular automaton to simulate contact plateau formation on the sliding contact surfaces of disc brakes has been further developed. This development includes the formation of secondary plateaus on the disc surface. A pin-on-disc tribometer test using the measured surfaces of the disc and pin has been run to compare the simulated and experimental disc after the test. The presented approach has also been used to study the influence of surface roughness on the contact pressure and area by comparing three different initial surface roughness of a cermet-coated disc surface. As a result of the present study, the following conclusions can be drawn about the simulation approach and the effects of the initial surface roughness on the contact area and pressure:
The secondary plateau formation on the simulated disc surface is in line with the coated disc surface as measured after the pin-on-disc tribometer test.
Different initial disc surface roughnesses not only result in different run-in time, they also reach a different steady state level in the contact area. This is in line with experimental results reported in the literature.
The initial roughest surface results in a considerably lower contact area than the smoother surfaces after almost one hour of sliding.
The smoothest disc results in more secondary plateau formation on the pad surface which results in a smoother pad surface after run-in.
Friction and temperature are known to strongly influence the wear performance. Even if the presented results are promising, it remains to include these in the model. Also, the test and simulation were run at constant load. In the future, a more dynamic load cycle could be used. Moreover, it remains to further investigate the validity of the numerical model with experiments.
Acknowledgement
The research leading to these results received funding from the European Union’s Horizon 2020
research and innovation programme under grant agreement No. 636592 (LOWBRASYS project).
REFERENCES
[1] F. Amato, Non-Exhaust Emissions: An Urban Air Quality Problem for Public Health, San Diego: Academic Press ELSEVIER, 342, 2018.
[2] T. Grigoratos, G. Martini, Brake wear particle emissions: a review, Environ Sci Pollut Res, vol. 22, pp. 2491–2504, 2015, doi: 10.1007/s11356-014-3696-8
[3] D. Chan, G.W. Stachowiak, Review of automotive brake friction materials, Proceedings of the Institution of Mechanical Engineers, Part D: Journal of Automobile Engineering, vol. 218, iss. 9,
pp. 953-966, 2004, doi:
10.1243/0954407041856773
[4] J. Wahlström, Y. Lyu, V. Matjeka, A. Söderberg, A pin-on-disc tribometer study of disc brake contact pairs with respect to wear and airborne particle emission, Wear, vol. 384-385, pp. 124-130, 2017,
doi: 10.1016/j.wear.2017.05.011
[5] N. Vashishtha, S.G. Sapate, J.S. Gahlot, P. Bagde, Effect of Tribo‑Oxidation on Friction and Wear Behaviour of HVOF Sprayed WC–10Co–4Cr Coating, Tribology Letters, vol. 66, 2018, doi: 10.1007/s11249-018-1006-1
[6] Y. Lyu, J. Wahlström, M. Tu, U. Olofsson, A friction, wear, and emission tribometer study of non-asbestos organic pins sliding against AlSiC MMC discs, Tribology in Industry, vol. 40, no. 2, pp. 274-282, 2018, doi: 10.24874/ti.2018.40.02.11
[7] M. Federici, C. Menapace, A. Moscatelli, S. Gialanella, G. Straffelini, Effect of roughness on the wear behavior of HVOF coatings dry sliding against a friction material, Wear, vol. 368-369, pp. 326-334, 2016, doi: 10.1016/j.wear.2016.10.013
[8] M. Federici, G. Perricone, S. Gialanella, Giovanni Straffelini, Sliding Behaviour of Friction Material Against Cermet Coatings: Pin‑on‑Disc Study of the Running‑in Stage, Tribology Letters, vol. 66, 2018, doi: 10.1007/s11249-018-1004-3
[9] M. Eriksson, F. Bergman, S. Jacobson, On the nature of tribological contact in automotive brakes, Wear, vol. 252, iss. 1-2, pp. 26-36, 2002,
doi: 10.1016/S0043-1648(01)00849-3
[11] G.P. Ostermeyer, Friction and wear of brake systems, Forsch. Ingenieurwes, vol. 66, iss. 6, pp. 267-272, 2001, doi: 10.1007/s100100100063 [12] W. Österle, I. Urban, Friction layers and friction films
on PMC brake pads, Wear, vol. 257, iss. 1-2, pp. 215-226, 2004, doi: 10.1016/j.wear.2003.12.017
[13] W. Österle, I. Urban, Third body formation on brake pads and rotors, Tribol Int, vol. 39, iss. 5, pp. 401-408, 2006, doi: 10.1016/j.triboint.2005.04.021
[14] G.P. Ostermeyer, M. Müller, New insights into the tribology of brake systems, Proceedings of the Institution of Mechanical Engineers, Part D: Journal of Automobile Engineering, vol. 222, iss.
7, pp. 1167-1200, 2008, doi:
10.1243/09544070JAUTO595
[15] M. Eriksson, J. Lord, S. Jacobson, Wear and contact conditions of brake pads: dynamical in situ studies of pad on glass, Wear, vol. 249, iss. 3-4, pp. 272-278, 2001, doi: 10.1016/S0043-1648(01)00573-7
[16] S. Gramstadt, Methoden der in-situ Visualisierung der Reibzonendynamik trockenlaufender Reibpaarungen unter Ergänzung physikalischer and chemischer Charakterisierungen der Reibpartner [Ph.D. thesis], Universitätsverlag Ilmenau, Ilmenau, Germany, 2015.
[17] A. Söderberg, S. Andersson, Simulation of wear and contact pressure distribution at the pad-to-rotor interface in a disc brake using general purpose finite element analysis software, Wear, vol. 267, iss. 12, pp. 2243-2251, 2009, doi: 10.1016/j.wear.2009.09.004
[18] A.A. Yevtushenko, P. Grzes, Axisymmetric FEA of temperature in a pad/disc brake system at temperature-dependent coefficients of friction and wear, International Communications in Heat and Mass Transfer, vol. 39, iss. 8, pp. 1045-1053, 2012,
doi: 10.1016/j.icheatmasstransfer.2012.07.025
[19] A. Belhocine, A.R. Abu Bakar, M. Bouchetara, Numerical Modeling of Disc Brake System in Frictional Contact, Tribology in Industry, vol. 36, no. 1, pp. 49‐66, 2014.
[20] A. Belhocine, N.M. Ghazali, O.I. Abdullah, Structural and Contact Analysis of a 3-Dimensional Disc-Pad Model with and without Thermal Effects, Tribology in Industry, vol. 36, no. 4, pp. 406-428, 2014.
[21] A. Belhocine, W.Z.W. Omar, Three-dimensional finite element modeling and analysis of the mechanical behavior of dry contact slipping between the disc and the brake pads, The International Journal of Advanced Manufacturing Technology, vol. 88, iss. 1-4, pp. 1035–1051, 2017,
doi: 10.1007/s00170-016-8822-y
[22]A. Belhocine, FE prediction of thermal performance and stresses in an automotive disc brake system, International Journal of Advanced Manufacturing Technology, vol. 89, iss. 9-12, pp. 3563-3578, 2017, doi: 10.1007/s00170-016-9357-y
[23]A. Belhocine, W.Z.W. Omar, CFD analysis of the brake disc and the wheel house through air flow: Predictions of Surface heat transfer coefficients (STHC) during braking operation, Journal of Mechanical Science and Technology, vol. 32, iss. 1, pp. 481-490, 2018, doi: 10.1007/s12206-017-1249-z
[24] A.A. Yevtushenko, P. Grzes, Finite Element Analysis of Heat Partition in a Pad/Disc Brake System. Numerical Heat Transfer, Part A: Applications: An International Journal of Computation and Methodology, vol. 59, pp. 521-542, 2011, doi: 10.1080/10407782.2011.561098
[25]A. Day, Thermal Effects in Friction Brakes, In Braking of Road Vehicles, edited by Andrew Day, Butterworth-Heinemann, Oxford, 2014, Pages 215-258, ISBN 9780123973146, doi: 10.1016/B978-0-12-397314-6.00007-3
[26]L. Wawrzonek, R.A. Bialecki, Temperature in a disk brake, simulation and experimental verification, International Journal of Numerical Methods for Heat & Fluid Flow, vol. 18, iss. 3-4,
pp. 387-400, 2008, doi:
10.1108/09615530810853646
[27]M.R. Ishak, A.R.A. Bakar, A. Belhocine, J.M. Taib, W.Z.W. Omar, Brake torque analysis of fully mechanical parking brake system: Theoretical and experimental approach, Measurement, vol.
94, pp. 487-497, 2016, doi:
10.1016/j.measurement.2016.08.026
[28]A. Belhocine, N.M. Ghazali, Effects of material properties on generation of brake squeal noise using finite element method, Latin American Journal of Solids and Structures, vol. 12, no. 8, pp. 1432-1447, doi: 10.1590/1679-78251520 [29] J. Wahlström, A. Söderberg, U. Olofsson, Simulation
of airborne wear particles from disc brakes, SAE Technical Paper 2009-01-3040, 2009.
[30]J. Wahlström, A comparison of measured and simulated friction, wear, and particle emission of disc brakes, Tribology International, vol. 92, pp.
503-511, 2015, doi:
10.1016/j.triboint.2015.07.036
[32] J. Wahlström, A. Söderberg, U. Olofsson, A cellular automaton approach to simulate the contact situation between the pad and disc in disc brakes, Tribology Letters, vol. 42, iss. 3, pp. 253-262, 2011, doi: 10.1007/s11249-011-9772-z [33] J. Wahlström, Towards a cellular automaton to
simulate friction, wear, and particle emission of disc brakes, Wear, vol. 313, iss. 1-2, pp. 75-82, 2014, doi: 10.1016/j.wear.2014.02.014
[34] J. Wahlström, A Factorial Design to Numerically Study the Effects of Brake Pad Properties on Friction and Wear Emissions, Advances in Tribology, vol. 2016, p. 10, 2016, doi: 10.1155/2016/8181260
[35] G.P. Ostermeyer, J.H. Merlis, Modelling the Friction Boundary Layer of an Entire Brake Pad with an Abstract Cellular Automaton, Lubricants, 2018.
[36] G. Riva, J. Wahlström, A numerical study of disc brakes wear dependence of rotor surface coating, Eurobrake, 2018.
[37] A. Söderberg, S. Björklund, Validation of a simplified numerical contact model, Tribology
International, vol. 41, iss. 9-10, pp. 926-933, 2008, doi: 10.1016/j.triboint.2008.02.013
[38]A. Hugnell, S. Björklund, S. Andersson, Simulation of mild wear in a cam-follower contact with follower rotation, Wear, vol. 199, iss. 2, pp. 202-210, 1996, doi: 10.1016/0043-1648(96)06920-7
[39]A. Flodin, S. Andersson, Wear simulations of spur gears, TriboTest Journal, vol. 5, iss. 3, pp. 225-249, 1999, doi: 10.1002/tt.3020050303
[40]J.F. Archard, Contact and rubbing of flat surfaces, J Appl Phys, vol. 24, iss. 8, pp. 981-988, 1953,
doi: 10.1063/1.1721448
[41]P. Podra, S. Andersson, Simulating sliding wear with finite element method, Tribol. Int., vol. 32, iss. 2, pp. 71-81, 1999, doi: 10.1016/S0301-679X(99)00012-2
![Figure 1 shows an overview of the simulation routine as presented by Riva et al. [36]](https://thumb-us.123doks.com/thumbv2/123dok_us/9805660.1966505/3.595.61.541.342.718/figure-shows-overview-simulation-routine-presented-riva-et.webp)
![Table 1. Test conditions used in the pin-on-disc tribometer tests as presented by Federici et al [6]](https://thumb-us.123doks.com/thumbv2/123dok_us/9805660.1966505/6.595.317.525.285.532/table-test-conditions-used-tribometer-tests-presented-federici.webp)