VOLUME 36, ARTICLE 57, PAGES 1759
,
1784
PUBLISHED 7 JUNE 2017
http://www.demographic-research.org/Volumes/Vol36/57/ DOI: 10.4054/DemRes.2017.36.57
Research Article
Racial segregation in postbellum Southern cities:
The case of Washington, D.C.
John R. Logan
This publication is part of the Special Collection on “Spatial analysis in historical demography: Micro and macro approaches,” organized by Guest Editors Martin Dribe, Diego Ramiro Fariñas, Don Lafreniere, and Hélène Vezina.
© 2017 John R. Logan.
This open-access work is published under the terms of the Creative Commons Attribution NonCommercial License 2.0 Germany, which permits use, reproduction & distribution in any medium for non-commercial purposes, provided the original author(s) and source are given credit.
1 Introduction 1760
2 Spatial scales and spatial configurations 1760
3 Processes of segregation 1763
4 Research questions and study design 1765
4.1 The 1880 data 1765
4.2 Analytical approach 1766
5 Results 1769
5.1 Illustration of spatial configurations 1769 5.2 Comparison of segregation at multiple spatial scales 1774 5.3 Predictors of living in a more racially isolated area 1775
6 Conclusion 1777
7 Acknowledgements 1780
Racial segregation in postbellum Southern cities:
The case of Washington, D.C.
John R. Logan1
Abstract
BACKGROUND
Segregation in Southern cities has been described as a 20th-century development, layered onto an earlier pattern in which whites and blacks (both slaves and free black people) shared the same neighborhoods. Urban historians have pointed out ways in which the Southern postbellum pattern was less benign, but studies relying on census data aggregated by administrative areas – and segregation measures based on this data – have not confirmed their observations.
METHODS
This study is based mainly on 100% microdata from the 1880 census that has been mapped at the address level in Washington, D.C. This data makes it possible to examine in detail the unique spatial configuration of segregation that is found in this city, especially the pattern of housing in alleys.
RESULTS
While segregation appears to have been low, as reflected in data by wards and even by much smaller enumeration districts, analyses at a finer spatial scale reveal strongly patterned separation between blacks and whites at this early time.
CONTRIBUTION
This research provides much new information about segregation in a major Southern city at the end of the 19th century. It also demonstrates the importance of dealing explicitly with issues of both scale and spatial pattern in studies of segregation.
1. Introduction
Immediately after the Civil War, Southern cities, including especially the nation’s capital, witnessed an unprecedented growth of urban black population. There are disagreements about how to describe segregation in this postbellum period. Some scholars emphasize the “relatively open housing pattern” that persisted into the 20th century (Blassingame 1973a: 481, for Savannah), while others state that “by the late 1880s segregation was firmly established” (Rabinowitz 1978: 106, for Richmond, Atlanta, Montgomery, and Raleigh). A recent study (Grigoryeva and Ruef 2015) takes a major step toward resolving the debate by studying the race of next-door neighbors for the entire Washington population. What is distinctive about many Southern cities, they argue, is that segregation is found on a microscale, like the backyard housing during the slave period when blacks lived in very close proximity to whites but clearly separated from them by the spatial layout.
This study draws on the same 100% census data file as Grigoryeva and Ruef, but it adds important geographic detail by geocoding people’s residential location. Like other recent segregation research it examines both the level of segregation and the locational processes that placed blacks in predominantly black settings. The level of segregation is measured at multiple spatial scales. This approach leads to the finding that the apparently modest segregation that most prior studies reported in Southern cities is partly a function of the spatial scale at which it was being measured, rendering a substantial share of segregation invisible to analysts even in fairly small neighborhood areas. Mapping locations also confirms the importance of Washington’s distinctive alley pattern, where newly arriving blacks were squeezed into what had originally been the backyards of large lots that then were reconstructed into high-density, low-quality housing along alleys within the residential block. Logan and Martinez (2018) show similar patterns in other Southern cities in the form of backyard housing (Charleston, SC) and side streets (Baltimore, MD), as well as larger black neighborhoods in several cities. With respect to locational processes, the availability of data from a 100% sample of residents makes it possible to test for the first time whether what some have called the “relative freedom” of the immediate postbellum period allowed many Southern blacks to move into more mixed settings on the basis of their own resources and social position.
2. Spatial scales and spatial configurations
micro-spatial segregation and macro-micro-spatial segregation. Micro-segregation is separation of residence by lot or block-segment whereas macro-segregation involves the exclusive occupancy of whole sections of a city by a particular group.” Scale has been an issue in Northern cities as well, particularly because until recently most pre-1940 studies have relied on data from city wards. In the case of Chicago one historian (Philpott 1978: 120‒121) has complained that the 1900 ward map shows blacks scattered around the city at a time when their concentration on the South Side was common knowledge.
Newly available data for much smaller units (enumeration districts) shows that Chicago was in fact highly segregated in 1900, with a value of the Index of Dissimilarity of
nearly .75 (Logan, Zhang, and Chunyu 2015).2
For this reason the sociologists who were most influential in crafting the now-standard measures of segregation gave much attention to the size of areal units that the measures are built from (see the Methodological Appendix in Taeuber and Taeuber 1965). But they also noted that it was not only a question of unit size. Citing Cowgill and Cowgill (1951), Duncan and Duncan (1955: 216‒217) point out that “it is easy to gerrymander tract boundaries to increase or decrease the apparent degree of segregation. However, the problem cannot be solved merely by reducing the size of areal units, e.g., to blocks. For example, if all nonwhites resided on alleyways and all whites in street-front structures, then even a block index would fail to reveal the high degree of segregation.”
Duncan and Duncan are referring to a second question that has received less attention, although it is often referred to in conjunction with scale. What is the spatial configuration of segregation? Here this issue is illustrated by examination of the alley configuration.
The alley is a pattern where housing on a narrow lane running through a block is physically separated from the street-front building behind it. Washington, D.C., is the most fully examined case. Here a single alley was often intersected by other lanes in the interior of the block and sometimes also had narrow pedestrian passageways leading out. The alley is similar to the backyard of the antebellum South in that it separates people living in more substantial houses on street fronts from those located in the interior of the block. But alley housing is typically separated by a wall from the street-front buildings. Like backyard housing, alley housing was sometimes comprised of self-constructed shanties or kitchens, sheds or stables repurposed as rental housing. Increasingly over time it took the form of low-quality row housing.
2 The Index of Dissimilarity measures how evenly whites and blacks are distributed across areas (wards in
Wade (1964: 61) points out that in Southern cities with large shares of slaves in the black population, “whenever alleys were opened they created an alternative center for slave activity […] away from the supervision of slaveowners or white authorities.” For this reason he believes that whites were distrustful of this configuration. Yet Myrdal (1944: 621) notes that “in some Southern cities, especially in the older ones, Negroes usually live in side streets or along alleys back of the residences of whites.” Even Charleston had alleys, which were in decline in the period before the War but revived by 1880. Radford (1976: 343) finds that at that time more than 10% of Charleston blacks but fewer than 1% of whites lived on alleys.
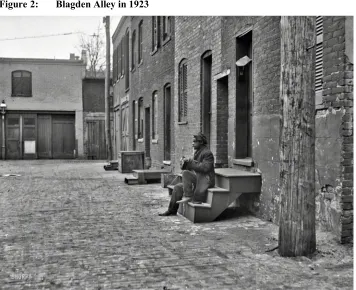
Indeed the social isolation of alley populations was one reason that many efforts were made to condemn alley housing once it had developed. According to a report on “Elimination of Insanitary and Alley Houses” in Washington, one alley (Blagden Alley, described in detail below) “contains 54 houses inhabited by a negro element who live in poverty and are a source of constant trouble […] Everyone familiar with these and other such labyrinths realizes the security from police supervision which they afford, to say nothing of other disadvantages” (Baldwin 1909: 8). Alleys were often characterized as slums. In Washington, D.C., in the 1870s, for example, Borchert (1971‒1972: 276) cites Board of Health reports on alleys that were “lined on both sides with miserable dilapidated shanties, patched and filthy,” while many frame dwellings had “leaky roofs, broken and filthy ceilings, dilapidated floors.” Jones (1929) reports that most were built directly on the ground without a foundation or flooring, with open privies behind them, and water supplied from a community hydrant in a corner of the alley.
The alley pattern was pronounced in this city, where it was introduced after the Civil War. Frazier (1957: 246) reports that in the 1870s about half of Washington’s black population lived in alleys. The original plan for the District of Columbia created large lots along major streets, many of which included alleys as part of the service infrastructure for trash collection and sewer/water connections. As land became scarce, front yards were replaced by row houses, lots were divided, and the rear lots sold separately for alley housing (Jones 1929: 30‒33). The construction of alley housing took advantage of the large influx of black migrants during the 1860s (Johnson 1932; Groves and Muller 1975). Most black heads of households living in alleys were migrants from Virginia or Maryland (Groves 1974: 275). A similar development occurred in Baltimore, where by mid-century aggressive developers were beginning to double the number of dwellings that could be built on typical 110-foot-deep lots by constructing a double row of smaller houses that faced both the street (which was sometimes considerably narrowed) and the alley (Hayward 1981: 50).
were disproportionately black. In Washington the odds of a black person living in alley housing were 15 or more times the odds for a white person.
To the extent that black residents were clustered in alleys while surrounding streets were occupied mainly by whites, the alley pattern – like the backyard – placed the races in close proximity to one another. Nevertheless it is only in a very limited sense that one could describe segregation in this context as ‘low,’ since the spatial arrangement of people was highly structured by race.
3. Processes of segregation
Another aspect of segregation is the locational process at the individual level. There is an extensive literature based on market logic that predicts greater spatial assimilation for persons (immigrants or minorities) with more human capital resources. The spatial assimilation model regards segregation as a natural but temporary phenomenon (Massey and Denton 1985). Immigrants are expected to be segregated partly by virtue of their relatively low initial class position and newcomer (i.e., ‘un-acculturated’) status. In contrast a key feature of the black ghetto of the mid-20th century was that it trapped all blacks, regardless of their social class or other attributes; segregation was based on racial exclusion (Marcuse 1997). Unlike immigrant enclaves, which were often springboards for later mobility, the ghetto is thought of as an absorbing state (Logan, Alba, and Zhang 2002). Contemporary studies show that blacks are less likely than comparable whites to escape poor neighborhoods, even across generations (South and Crowder 1997; Sharkey 2008).
Research from the 1930s and 1940s (see, e.g., Frazier [1937] on Harlem and Duncan and Duncan [1957: 237‒298] on Chicago) demonstrates that the ghettos of that period held both working-class and middle-class blacks. Some have argued that this was a relatively new development, and that in the late 19th century more affluent blacks “had been more able to find housing commensurate with their social status” (Massey and Denton 1993: 30). This view is contested by recent research showing that in Northern cities as early as 1880 neither occupational standing nor migrant status had much effect on the racial composition of the area where blacks lived (Logan, Zhang, and Chunyu 2015; Logan et al. 2015).
between the locations of working-class and middle-class blacks, but also highlight the constraints on where the middle class could live. In Washington the black neighborhoods “may have attracted the middle income black because of the higher threshold level of a black clientele and possibly the greater potential to purchase a residence on a blockfront, as opposed to the generally inferior housing of alleys and courts.” Power (1983: 291) suggests a similar pattern in Baltimore, where the “black bourgeoisie, then perhaps 250 in number, sought to remove themselves from the ‘disreputable and vicious neighborhoods of their own race,’ [and] those blacks that could afford to do so purchased second-hand housing around St. Mary’s, Orchard, and Biddle Streets.” However, they apparently faced locational constraints in this previously white neighborhood, because “their neighborhood began in the alleys and then moved out to the wider streets, displacing Bohemians and Germans,” who were departing the area.
A related factor is migrant status. The rapid growth of the Southern urban black population was due to rural‒urban migration from within the region. There is little systematic evidence on where migrants lived, though the concentrated alley housing in Washington has been specifically associated with black migrants. In Northern cities the distinction has been made between local blacks (most of whom had not been slaves) and post-Civil War migrants from the South, who were expected to experience the dual disadvantages of 1) being newcomers to the city and 2) having rural backgrounds not well suited to urban occupations. Drake and Cayton (1945) describe a class structure within the black community in which low income and education were especially associated with Southern birth. Tolnay, Crowder, and Adelman (2002), using ward-level data for a large sample of Northern and Western cities in 1920, found evidence of a slight advantage for Northern-born blacks in the percent of neighbors who were native white and the percent of homeowners. However, Taeuber and Taeuber (1965) reported that in Chicago by 1950 there was no difference in segregation from whites between migrant and nonmigrant blacks, and so they dispute the ‘immigrant’ interpretation of black segregation. The most recent studies of the late 19th century show that blacks born in the South lived in very similar neighborhoods to those born in the North (Logan, Zhang, and Chunyu 2015; Logan et al. 2015).
north of the French Quarter). Radford (1976: 343) plotted locations of household heads in 1880 in Charleston, distinguishing between those residing on streets (including backyards) and those on alleys. Alleys were least common for whites (under 4%), more likely for blacks (8.6%), and still more likely for mulattoes (11.1%). There are not strong reasons to expect a black–mulatto difference in residential outcome after controlling for class standing, but this variable is included in the analysis on an exploratory basis.
4. Research questions and study design
This study examines segregation in Washington in 1880. A key goal is to identify the spatial pattern that needs to be assessed, and the scale at which it appears. The analysis has three parts. The first presents detailed maps to illustrate the alley pattern. Then, following the example of a recent study of Northern cities that asked similar questions (Logan, Zhang, and Chunyu 2015), this study focuses on two aspects of segregation. The first is how segregated racial groups are at various spatial scales. The second seeks to interpret the statistical findings: What processes place minorities in segregated locations? Are blacks segregated as a by-product of social class differences with whites, or (especially relevant in the decades leading up to the high point of ghettoization in the 1960s) the disadvantages of new migrants coming from the South to urban centers in the Northeast and Midwest? Or is segregation imposed across the board on the basis of race?
4.1 The 1880 data
The main data source is the 100% transcription of records from the 1880 federal census, harmonized by the Minnesota Population Center (MPC) and available for public use through the North Atlantic Population Project (NAPP, http://www.nappdata.org/napp, Ruggles et al. 2010). These records were mapped and geocoded to the address level for 39 cities by the Urban Transition Historical GIS Project (www.s4.brown.edu/utp, described in Logan et al. 2011). Consequently, nearly complete population information at the finest possible geographic level is available and it is possible to aggregate it to any spatial scale.
black residents in Washington in the 1860‒1870 decade, mostly after 1865 (jumping from 18% to 31.9%). Most Southern cities witnessed a growth in the number of blacks as the cities participated in the nationwide wave of urbanization that was in progress in the latter 19th century. Another major structural change resulted from the abolition of slavery. The share of blacks who were enumerated as slaves in 1860 had varied greatly. Washington was an outlier where only 16% were slaves.
4.2 Analytical approach
An advantage of access to 100% microdata is that it is possible to define carefully who to include in the analysis. In the calculation of segregation indices and multivariate analyses we exclude black domestic servants living in white-headed households and black children in those households. Though they are residents of the city (and nearly 20% of adult blacks in Washington were live-in servants), they are not ‘neighbors’ of other household members in the common social meaning of the term. In analyses not reported here that include these domestics, segregation is found to be modestly lower (especially at the household and building scale), and the strongest predictor of a black person living in a less black area is employment as a live-in servant.
The census data is analyzed at multiple spatial scales: the household, building, face block, street segment, segment group (including adjacent interconnected streets), and extended segment group (adding another layer of connected street segments). Segregation is measured in two different ways here. One is to construct overlapping (or egocentric) areas and calculate the exposure of blacks to whites (or isolation of blacks) within these areas (typically symbolized as Pbb or Pbw). The measure is the racial composition of neighbors in the location of the average black resident’s residence. Exposure measures have the well-known feature that they depend heavily on the overall citywide racial composition, which limits comparisons across cities. They are most useful to compare segregation at different spatial scales within the same city. The other measure is the Index of Dissimilarity (D), which summarizes how differently the black population is distributed among areas compared to the white population. If they were equally distributed every area would have the same percentage of blacks in its population and D would equal zero. If there were no racial mixing at all D would reach a maximum of 1. In contemporary urban research there is wide agreement that values of D over .60 represent very high segregation.
example with contemporary data is provided in Logan, Alba, and Zhang (2002), predicting living in ethnic neighborhoods for Hispanic and Asian groups in New York and Los Angeles. Similar models have been estimated with historical data for American cities by Tolnay, Crowder, and Adelman (2002) and Logan and Zhang (2012). The usual mathematical form of the model is shown in the following equation:
ij j ij
ij X u e
y < ∗ α1 ∗ ∗
whereXijare individual-level covariates, ujis the city-specific error term, and eijis the
individual-specific error. In this case, with only one city, there is nouj.
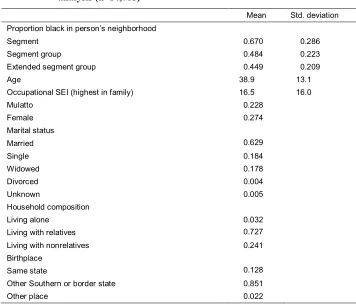
Table 1: Descriptive statistics for black adults included in the multivariate analysis (n=14,705)
Mean Std. deviation
Proportion black in person’s neighborhood
Segment 0.670 0.286
Segment group 0.484 0.223
Extended segment group 0.449 0.209
Age 38.9 13.1
Occupational SEI (highest in family) 16.5 16.0
Mulatto 0.228
Female 0.274
Marital status
Married 0.629
Single 0.184
Widowed 0.178
Divorced 0.004
Unknown 0.005
Household composition
Living alone 0.032
Living with relatives 0.727
Living with nonrelatives 0.241
Birthplace
Same state 0.128
Other Southern or border state 0.851
Other place 0.022
5. Results
Findings are presented in three parts. First, the residential locations of black and white residents are mapped to illustrate the detailed spatial pattern, with a special focus on alleys. Second, segregation indices (the Index of Dissimilarity and the Isolation Index) are compared at several different spatial scales. Third, locational attainment models are estimated for black residents at multiple scales, asking what personal characteristics most influenced living in a location with a higher share of black neighbors.
5.1 Illustration of spatial configurations
The alley configuration is illustrated here at two spatial scales. The finest scale is an area of one large city block, where the location of black, white, and mixed households is plotted, building by building, on historical fire insurance maps. At a larger scale the area surrounding these blocks is mapped with geocoded data on the residents at each address (excluding black live-in servants), showing the location of predominantly white or predominantly black buildings.
Figure 1: Blagden Alley in northwest Washington, D.C. (overlaid on Sanborn Fire Insurance Company, 1888)
Figure 2: Blagden Alley in 1923
Source: Accessed on February 17, 2017, athttp://www.shorpy.com/node/14864 (Harris and Ewing glass negative held by Library of Congress Prints and Photographs Collection).
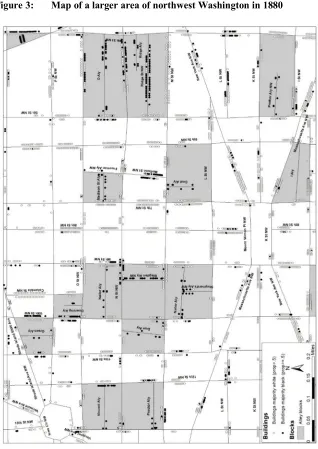
The conclusion to be drawn here is that the alley was a racially distinctive spatial configuration, particularly relevant to this central area of the city. Table 2 places it into the larger city context, showing location data for blacks and whites in the area mapped in Figure 3 (labeled Blagden neighborhood in the table) and in the remainder of the city. This tabulation includes all residents of the city. Alleys have been identified as streets whose names included the word Alley, Lane, Row, Court, or Place. In the Blagden neighborhood, about a quarter of residents lived on blocks that included alleys, either in the alley itself or on the perimeter of the block. Blacks made up 93% of the residents in the alleys, but only 26% of residents of the perimeter of the block and 17% in blocks that did not contain alleys. A similar pattern prevailed in the remainder of the city, where 83% of alley residents were black, compared to only 31% of nonalley residents.
Table 2: Washington population by race and alley residence
Black White Total population Number Share Number Share Number Share
Blagden neighborhood 5,380 0.260 15,314 0.740 20,694 1.000
Alleys 1,771 0.939 116 0.061 1,887 1.000
Perimeters of blocks with alleys 1,075 0.264 3,000 0.736 4,075 1.000 Blocks with no alley 2,534 0.172 12,198 0.828 14,732 1.000
Remainder of city 47,014 0.332 94,556 0.667 141,691 1.000
Alleys 4,853 0.839 934 0.161 5,787 1.000
Other streets 42,161 0.311 93,622 0.689 135,783 1.000
Washington total 52,394 0.323 109,870 0.677 162,385 1.000
Alleys 6,624 0.863 1,050 0.137 7,676 1.000
Other streets 45,770 0.296 108,820 0.703 154,709 1.000
5.2 Comparison of segregation at multiple spatial scales
The ward-based measures that have been relied on in past studies showed that Southern cities had levels of segregation that, while increasing steadily, were quite low at the end of the 19th century and remained well below large Midwest and Northeastern cities in the period 1890‒1940, despite their much larger black populations. Cutler, Glaeser, and Vigdor (1999) report ward data for Washington beginning in 1910, when the Index of Dissimilarity (D) by wards was only .21. This compares to a weighted average of .45 in the same year for nine of the largest Northeastern and Midwestern cities that were studied by Logan, Zhang, and Chunyu (2015).
Table 2 reports data for a much wider range of spatial scales for the Index of Dissimilarity (D) and the Isolation Index.3 The household is a constituent part of all larger units. Recall that for the calculations in this table black live-in domestic servants in white-headed households have been removed. A remaining source of household racial heterogeneity is intermarriage, which was unusual in this period; more commonly a mixed-race household would be attributable to lodgers. Not surprisingly, household segregation is extremely high ‒ the average black resident lived in a household that was nearly all black. Segregation was equally high at the level of residential buildings. The average black resident lived at an address where more than 96% of neighbors were black.
The next larger areal unit is the face block, which includes all buildings on one side of a street between two intersections. A slightly larger area is the street segment, which includes both sides of the street. An alley would count in this analysis as a street segment, and one might therefore expect to find very high values of segregation (D greater than .60) at this scale in Washington. In Washington in 1880 D at the scale of face blocks and street segments was .73 and .68 respectively. The average black person lived on a face block that was 73% black and a segment that was 68% black, although the city as a whole was only 31.9% black.
The segregation at one spatial scale sets a maximum for the segregation at a larger scale. For example, if D at the level of street segments is nearly .70, then D for a connected group of street segments (a segment group) must be below that. There is a very substantial decline in D between these two scales, despite the fact that a segment
3 The isolation measures presented here are based on egocentric neighborhoods. This means, for example, for
group is still a very compact geographic area from the street segment to the segment group level. In other words, just turning the corner or extending along the same street to the next block would often place a person in a significantly different racial environment. In Washington, of course, predominantly black street segments (or alleys) could well be adjacent to mixed or predominantly white ones. The average black person’s street segment was 68% black but the segment group was only 51% black. D dropped from .68 at the segment scale to only .44 at the segment group scale.
Segregation is still lower (D=.37) at the scale of extended segment groups, which extend the area of a segment group to the connected segment adjacent to it. The average black person lived in an extended segment group that was more racially homogeneous (43%) than the city (31%), but not nearly as homogeneous as units like street segments or buildings. What scholars usually think of as segregation across ‘neighborhoods’ (areas including several interconnected street segments) is reflected in the segment group, extended segment group, and enumeration district scales. These results show that the neighborhood as defined by racial composition was a smaller unit in Washington in 1880.
5.3 Predictors of living in a more racially isolated area
These analyses show that the black population was highly residentially segregated at relatively fine spatial scales. A final question addressed here is about the process of segregation: Who lived in the most racially isolated black neighborhoods and who lived in more mixed settings? This question is addressed at three different scales: the street segment (which includes alleys), the segment group, and the extended segment group. If segregation operated most clearly at the segment level, one would expect clearer results at this scale. However the larger issue is whether in fact individual-level characteristics mattered much in where black people lived. Was segregation experienced most by black residents with the least advantages of background, or was it more uniformly imposed on all black Washingtonians?
Table 3: Index of dissimilarity and isolation at multiple spatial scales, Washington in 1880
Dbw P*bb
Household .984 .985
Building .967 .968
Face block .733 .732
Street segment .684 .687
Segment group .446 .513
Extended segment group .378 .436
Citywide % black 31.9%
The starting point for this set of prediction equations (the constant term, before taking into account other predictors) is a street segment that is 70.8% black, a segment group that is 49.5% black, and an extended segment group that is 45.6% black. This finding indicates again how sharply the degree of segregation (isolation) shifts with relatively small changes in spatial scale, but now after controlling for individual-level characteristics.
Individual-level effects are generally small even when they are highly statistically significant. These findings reinforce the point of view of theories of segregation that emphasize racial exclusion rather than separation based on characteristics that happen to be associated with race. Most blacks regardless of their personal background lived in racially similar environments. As expected from literature that describes the hierarchical standing of lighter-skinned persons as intermediate between whites and Negroes, mulattoes are predicted to live in locations that are less black than are Negroes. The predicted difference is 4.3% at the street segment scale, an appreciable difference though small in relation to the starting point (the constant) of 70.8%. The effect drops to close to 1% at high spatial scales. Based on assimilation theory it would be expected that blacks with higher occupational standing would tend to be less confined to black locations. However, the effect of occupational SEI is tiny: a ten-point improvement in SEI (which would represent a large jump in the occupational distribution) would yield only a 0.2% reduction in the share of black neighbors on one’s street segment. There are also weak effects for birthplace, marital status, and gender.
Table 4: Model predicting black proportion in area of residence, various spatial scales, Washington in 1880
Street Segment Segment Group
Extended segment group
b SE b SE b SE
Mulatto (reference = Negro) ‒.043 *** .006 ‒.013 ** .004 ‒.011 ** .004
Female (reference = male) .006 .007 ‒.030 *** .005 ‒.028 *** .005
Age .000 .000 .000 ** .000 .001 *** .000
Marital status (reference = married)
Single ‒.001 .009 ‒.013 .007 ‒.021 *** .006
Widowed .005 .008 .003 .007 ‒.003 .006
Divorced .029 .037 .013 .029 ‒.010 .028
Unknown .010 .034 .002 .027 ‒.026 .025
Household composition (reference = family)
Living alone ‒.055 *** .014 ‒.027 * .011 ‒.022 * .010
Living with non-relatives ‒.098 *** .007 ‒.043 *** .006 ‒.024 *** .005
Birthplace (reference = same state)
Other Southern or border state .020 ** .007 .007 .006 .003 .005
Other place ‒.031 .017 ‒.021 .013 ‒.021 .013
Occupational SEI (family) ‒.002 *** .000 ‒.001 *** .000 ‒.001 *** .000
Constant .708 *** .011 .495 *** .008 .456 *** .008
Number of cases 14,705 14,705 14,705
R2 0.047 0.023 0.019
6. Conclusion
This study makes two main contributions, providing new information on segregation in one postbellum Southern city and pointing out the importance of spatial scales and configurations in the study of segregation.
to be relegated to the worst jobs and excluded from public parks and many public events, but nevertheless to live cheek by jowl with white neighbors? In addition researchers have been anxious about relying on the ward data that for many years was the only national source of pre-1940 information on small area populations. Some explicitly noted that their ward-level findings for Southern cities might not correspond well with actual patterns (Cutler, Glaeser, and Vigdor 1999: 460‒461). Demographers who pioneered the segregation measures in use today were keenly aware of potential problems even after tract and block counts became widely available. They were concerned with how segregation should be studied, how we know what to look for, and how we can find it.
New data resources are resolving the data questions. In collaboration with the private sector genealogy firm Ancestry.com, the Minnesota Population Center is in the process of making available digitized records for 100% samples of individuals and households with addresses from all censuses between 1880 and 1940, and in a short time 1950 will also lose its confidentiality status. In the meantime data centers organized by the Bureau of the Census are providing fine-resolution census enumerations for more recent years, and other sources such as social media are assembling and disseminating vast amounts of spatially referenced information about individuals. It was the state of the art at one time to rely on tabulations of ward data (or later, census tract data) and to limit debate to the question of which of many variants of segregation measures was most meaningful. Now we will have information on every person’s location, along with personal and household characteristics, and we are assisted by Geographic Information System tools that allow us to handle so much data more easily. The crucial question now and in the future is what we need to measure and how we should think about the results.
Many historians and social scientists throughout the 20th century were aware of the
patterns of segregation in Southern cities and the variations among them. Yet they
the absolute value of segregation was high in these cities by the usual standards. The average black person in Washington lived on a street segment that was more than two-thirds black and the Index of Dissimilarity was already close to .70 in 1880, a value that studies at the census tract level in the postwar period described as ‘extreme’. Fourth, the locational attainment analyses demonstrate that racial separation was very weakly associated with background characteristics like occupation or migrant status, and mostly attributable simply to race. It was a specifically racial exclusion.
This research brings into focus a question about what segregation is in a way that has not seemed as relevant to urbanists studying contemporary cities with large black settlement areas. Is segregation essentially about distance or about social boundaries? Social scientists have moved toward an emphasis on distance, as in recent developments in “spatial measures” of segregation. Researchers are now beginning to calibrate segregation and intergroup exposures based on the distances between the places where members of different groups live (Reardon and O’Sullivan 2004). In some cities, it is pointed out, small clusters of minorities are relatively dispersed around the city (segregation is visible only at a microlevel), while in others they are grouped together into large minority districts (segregation is visible at a larger spatial scale). Cities vary in the spatial scale at which minorities are segregated (Lee et al. 2008) and the spatial scale may change over time (Reardon et al. 2009). A corollary of these findings is that we need to identify the relevant spatial scale in order to construct a valid measure of segregation.
Segregation can also be understood in terms of boundaries between people (when adjacent areas are separated by law, custom, or other means) even when they live in close proximity to one another. Consider the extreme case of residents in the same household, some as domestic workers. A common arrangement has been for employees to have bedrooms on different floors, to use a back entrance to the house and a back staircase to reach other floors, and to spend much time in the kitchen and working areas. These are strong spatial boundaries within the residence, though few would call it residential segregation.
More clearly relevant are the spatial configurations beyond the building, such as the alley configuration. All available evidence suggests that there were strong social boundaries between alleys and perimeter streets: alleys were not surveilled by authorities, non-residents were afraid to enter them, and they were considered to be appropriate for blacks but not for ‘decent white people.’ It is this social boundary that turns the short distance between the alley and its connected street into a deep divide. A parallel argument can be made for other spatial scales. Whatever else matters about segregation, a key element is how spatial patterns reflect social boundaries.
mechanisms to make the boundary more or less permeable. This is where the locational attainment models presented here are most helpful, as a supplement to segregation statistics. In Washington in 1880 personal characteristics like occupation and birthplace and Negro/mulatto status (despite some statistically significant effects) made little practical difference. Higher-status, locally born, or lighter-skinned persons did not escape predominantly black locations. Not only was Washington already residentially segregated by race in the postbellum era, but race was already the driver of this outcome.
7. Acknowledgements
References
Alba, R.D. and Logan, J.R. (1993). Minority proximity to whites in suburbs: An individual-level analysis of segregation. American Journal of Sociology 98(6): 1388‒1427.doi:10.1086/230193.
Baldwin, W.H. (1909). Report of the Committee on improvement of existing homes and elimination of insanitary and alley houses. In: Sternberg, G.M. (ed.).Reports of the President’s Homes Commission. Washington, D.C.: Government Printing Office: 3‒16.
Blassingame, J.W. (1973a). Before the ghetto: The making of the black community in Savannah, Georgia, 1865‒1880. Journal of Social History 6(4): 463‒488. doi:10.1353/jsh/6.4.463.
Blassingame, J.W. (1973b).New Orleans, 1860‒1880. Chicago: University of Chicago Press.
Borchert, J. (1971‒1972). The rise and fall of Washington’s inhabited alleys, 1852‒ 1972.Columbia Historical Society Records 48: 267‒288.
Campanella, R. (2007). An ethnic geography of New Orleans.The Journal of American History 94(3): 704‒715.doi:10.2307/25095131.
Cowgill, D.O. and Cowgill, M.S. (1951). An index of segregation based on block statistics.American Sociological Review 16(6): 825‒831.doi:10.2307/2087511. Cutler, D.M., Glaeser, E.L., and Vigdor, J.L. (1999). The rise and decline of the
American ghetto. Journal of Political Economy 107(3): 455‒506. doi:10.1086/ 250069.
Drake, S.C. and Cayton, H.R. (1945). Black metropolis: A Study of Negro Life in a Northern City. Chicago: University of Chicago Press.
Duncan, O.D. and Duncan, B. (1955). A methodological analysis of segregation indexes.American Sociological Review 20(2): 210‒217. doi:10.2307/2088328. Duncan, O.D. and Duncan, B. (1957). The Negro population of Chicago. Chicago:
University of Chicago Press.
Frazier, E.F. (1957).The Negro in the United States. New York: Macmillan.
Groves, P.A. (1974). The ‘hidden’ population: Washington alley dwellers in the late nineteenth century. Professional Geographer 26(3): 270‒276. doi:10.1111/j.00 33-0124.1974.00270.x.
Groves, P.A. and Muller, E.K. (1975). The evolution of black residential areas in late nineteenth century cities. Journal of Historical Geography 1(2): 169‒191. doi:10.1016/0305-7488(75)90184-X.
Hayward, M.E. (1981). Urban vernacular architecture in nineteenth-century Baltimore. Winterthur Portfolio 16(1): 33‒63.doi:10.1086/496001.
Johnson, C.S. (1932). Negro housing: Report of the Committee on Negro Housing. Washington, D.C.: Government Printing Office.https://archive.org/stream/negro housingrepo00presrich/negrohousingrepo00presrich_djvu.txt.
Jones, W.H. (1929). The housing of Negroes in Washington, D.C. Washington, D.C.: Howard University Press. http://babel.hathitrust.org/cgi/pt?id=uc1.$b538873; view=1up;seq=71.
Lee, B.A., Reardon, S.F., Firebaugh, G., Farrell, C.R., Matthews, S.A., and O’Sullivan, D. (2008). Beyond the census tract: Patterns and determinants of racial residential segregation at multiple geographic scales. American Sociological Review 73(5): 766–791.doi:10.1177/000312240807300504.
Logan, J.R., Alba, R.D., and Zhang, W. (2002). Immigrant enclaves and ethnic communities in New York and Los Angeles. American Sociological Review 67(2): 299‒322.doi:10.2307/3088897.
Logan, J.R., Jindrich, J., Shin, H., and Zhang, W. (2011). Mapping America in 1880: The Urban Transition Historical GIS Project.Historical Methods 44(1): 49‒60. doi:10.1080/01615440.2010.517509.
Logan, J.R. and Martinez, M. (forthcoming 2018). The spatial scale and spatial configuration of residential settlement: Measuring segregation in the postbellum South.American Journal of Sociology.
Logan, J.R. and Zhang, W. (2012). White ethnic residential segregation in historical
perspective: US cities in 1880. Social Science Research 41(5): 1292‒1306.
doi:10.1016/j.ssresearch.2012.03.010.
Logan, J.R., Zhang, W., Turner, R., and Shertzer, A. (2015). Creating the black ghetto:
Black residential patterns before and during the Great Migration.The Annals of
the American Academy of Political and Social Science 660(1): 18‒35.
doi:10.1177/0002716215572993.
Marcuse, P. (1997).The enclave, the citadel, and the ghetto: What has changed in the post-Fordist US city. Urban Affairs Review 33(2): 228‒264. doi:10.1177/107 808749703300206.
Massey, D. and Denton, N. (1993).American apartheid: Segregation and the making of the underclass. Cambridge: Harvard University Press.
Massey, D. and Denton, N. (1985). Spatial assimilation as a socioeconomic outcome. American Sociological Review50(1): 94‒106.doi:10.2307/2095343.
Myrdal, G. (1944).An American dilemma. New York: Harper & Bros.
Philpott, T.L. (1978). The slum and the ghetto: Neighborhood deterioration and middle-class reform, Chicago, 1880‒1930. New York: Oxford University Press. Power, G. (1983). Apartheid Baltimore Style: The residential segregation ordinances of
1910‒1913.Maryland Law Review 42(2): 289‒328.
Rabinowitz, H.N. (1978). Race relations in the urban South, 1865‒1890. Athens: University of Georgia Press.
Radford, J.P. (1976). Race, residence and ideology: Charleston, South Carolina in the mid-nineteenth century. Journal of Historical Geography 2(4): 329‒346. doi:10.1016/0305-7488(76)90122-5.
Reardon, S.F., Farrell, C.R., Matthews, S.A., O’Sullivan, D., Bischoff, K., and Firebaugh, G. (2009). Race and space in the 1990s: Changes in the geographic scale of racial residential segregation, 1990–2000. Social Science Research 38(1): 55‒70.doi:10.1016/j.ssresearch.2008.10.002.
Reardon, S.F. and O’Sullivan, D. (2004). Measures of spatial segregation.Sociological Methodology34(1): 121‒162.doi:10.1111/j.0081-1750.2004.00150.x.
Ruggles, S., Alexander, J.T., Genadek, K., Goeken, R., Schroeder, M.B., and Sobek, M. (2010). Integrated Public Use Microdata Series: Version 5.0 [electronic resource]. Minneapolis: University of Minnesota.http://www.ipums.org/
Sobek, M. (1996). Work, status, and income: Men in the American occupational structure since the late nineteenth century. Social Science History 20(2): 169‒ 207.doi:10.2307/1171236.
South, S. and Crowder, K. (1997). Escaping distressed communities: Individual, community, and metropolitan influences.American Journal of Sociology 102(4): 1040‒1084.
Taeuber, K.E. and Taeuber, A.F. (1965).Negroes in cities. Residential segregation and neighborhood change.Chicago: Aldine Publishing.
Tolnay, S., Crowder, K., and Adelman, R. (2002). Race, regional origin and residence in Northern cities at the beginning of the Great Migration. American Sociological Review67(3): 456–475.doi:10.2307/3088966.