DEMOGRAPHIC RESEARCH
VOLUME 35, ARTICLE 34, PAGES 1011
−
1044
PUBLISHED 6 OCTOBER 2016
http://www.demographic-research.org/Volumes/Vol35/34/ DOI: 10.4054/DemRes.2016.35.34
Research Article
Determinants of rural out-migration in Ethiopia:
Who stays and who goes?
Atsede Desta Tegegne
Marianne Penker
©2016 Atsede Desta Tegegne & Marianne Penker.
This open-access work is published under the terms of the Creative Commons Attribution NonCommercial License 2.0 Germany, which permits use, reproduction & distribution in any medium for non-commercial purposes, provided the original author(s) and source are given credit.
1 Lack of knowledge on migration in rural Ethiopia 1012
2 Challenges of migration studies 1013
3 Conceptual framework and exploratory analysis 1014
4 Methodology 1018
4.1 Study sites and sampling 1018
4.2 Method of data collection 1019
4.3 Methods of data analysis 1020
5 Characteristics of the sampled households and migrants 1021 5.1 Comparison of the sample with rural Ethiopia and the Amhara
region
1021
5.2 Characteristics of the migrants 1022
6 Determinants of migration decisions 1025 6.1 Binary logistic regression explaining the propensity to migrate 1025 6.2 Determinants explaining the propensity for short-term and
long-term migration choices
1029
7 Discussion 1030
7.1 Discussion of the research design 1030 7.2 Results confirming prior research 1031 7.3 Results contributing to the discussion of ambiguous migration
determinants
1032
7.4 Results supplementing the NELM framework 1034
8 Conclusion 1035
9 Acknowledgements 1036
Determinants of rural out-migration in Ethiopia:
Who stays and who goes?
Atsede Desta Tegegne1,2
Marianne Penker2
Abstract
BACKGROUND
Rural out-migration is a common phenomenon in Ethiopia. Several studies explain migration as the outcome of an individual utility-maximizing decision. This perspective ignores the diversity of migration types and inadequately explains migration in the wider context of mutual and interdependent risk-sharing strategies of household members in response to locational advantages and disadvantages.
OBJECTIVE
The main objective of this study is to examine households’ choice of short-term and long-term migration and its underlying determinants in different locational contexts. METHODS
Based on the household-centred New Economics Labour Migration (NELM) framework, we conducted quasi-longitudinal and context-specific structured interviews with 553 randomly selected households in four rural study sites in north-west Ethiopia. The determinants of household migration decisions on the one hand and the variables explaining decisions for short-term and long-term migration were analysed in a binary logistic regression and a multinomial logistic regression.
RESULTS
The results show a positive relation between migration decisions and household variables such as a higher education status, perceived food insufficiency, female household heads, household-head age, household size, and number of economic activities. Beyond the NELM framework, location in different livelihood zones is also significant in diverging migration strategies. Short-term migration is very much driven by locational advantages and food insufficiency. The propensity for long-term
1 Department of Economics and Social Sciences, BOKU, University of Natural Resources and Life Sciences,
Vienna, 1180, Feistmantelstraße 4, Austria.
2 Centre for Development Research, BOKU, University of Natural Resources and Life Sciences, Vienna,
migration significantly increases for households with a higher educational level, but declines with a rising number of dependent household members.
CONTRIBUTION
We contribute to the discussion of ambiguous determinants of migration and provide more differentiated insight into short-term and long-term migration decisions. Besides strong support for the NELM framework, we highlight the relevance of education for long-term migration and locational meso-level factors for short-term migration.
1. Lack of knowledge on migration in rural Ethiopia
Migration is a complex, multicausal, and nonlinear demographic phenomenon that has occurred throughout human history at a variety of scales and touches the lives of many people in sub-Saharan Africa (Adepoju 2008; Malmberg 2008; Naude 2010; de Brauw, Mueller, and Lee 2014). Empirical findings for Ethiopia indicate that large-scale out-migration can be triggered by natural population increase and insufficient access to food (Ezra and Kiros 2001), overall destitution of households (Gebru and Beyene 2012), inadequate income and limited access to farm land (Bezu and Holden 2014), ecological degradation and drought (Berhanu and White 2000; Ezra 2001; Mberu 2006; Gray and Mueller 2012), government resettlement policies (Belay 2004; Hammond 2008), and employment opportunities elsewhere (Kassie et al. 2008).
Approximately 84% of Ethiopia’s population lives in rural areas (CSA 2010) and largely depends on agricultural activity for both income and subsistence (Gray and Mueller 2012; Bezu and Holden 2014). Due to population pressure and the country’s land tenure system, the livelihood of Ethiopia’s rural population is particularly endangered by declining per-capita farm land (Rahmato 2004; Bezu and Holden 2014). As state authorities allocate land use rights, land is subject to neither sale nor long-term lease contracts.
If the rightholders leave the village for an extended period, their land use rights can be redistributed to the landless (FDRE 2005). The associated land right insecurity discourages landholders from out-migration (Rahmato 2004; de Brauw and Mueller 2012). By contrast, others argue that Ethiopia’s land use policy also triggers the out-migration of rural landless youth (Ezra and Kiros 2001; Bezu and Holden 2014). Migration allows rural households to diversify their income sources and to overcome livelihood risks and lack of credit, land, and insurance (Taylor and Martin 2001; Ellis 2003).
lack of an effective registration system, the quantitative levels of migration in Ethiopia are still unclear (Hailemariam and Adugna 2011). Moreover, there is much uncertainty regarding the determinants shaping the patterns, levels, and choices of rural migration, such as the decision for short-term versus long-term migration.
To bridge these gaps, we examine the determinants of rural migration decisions in general and the choice of short-term versus long-term migration in particular for the rural context of north-west Ethiopia. As in other parts of the country, households’ migration strategies in the Amhara region are very heterogeneous with respect to duration and destination. Therefore, we consider the study site as representative of other rural areas in Ethiopia regarding the determinants of household migration decisions. However, when it comes to the proportion of migrant-sending households or the share of short-term and long-term migrants, misleading generalisations should be avoided.
2. Challenges of migration studies
Due to people’s complex, context-specific, and diverse migration experiences, there is no universal definition, comprehensive migration theory, or common conceptual framework that serves as a starting point for empirical research (King 2002, 2012; Castles 2010). Consequently, the literature emphasises the role of an interdisciplinary and context-sensitive approach in empirical migration studies (see Abreu 2012; King 2012; Brettell and Hollifield 2015). Despite the complexity and context-specificity of migration decisions, we – like other scholars (Mckenzie and Rapoport 2007; Mckenzie and Sasin 2007; Sabates-Wheeler, Sabates, and Castaldo 2008) – assume that migration is no random process, but rather a choice that is influenced by a range of observable and unobservable factors that distinguish migrants from non-migrants.
Empirical migration studies are challenged by the endogeneity problem that may be created by self-selection, omitted variables, and reverse causality (Mckenzie and Sasin 2007; Sabates-Wheeler, Sabates, and Castaldo 2008).
effects (Taylor 1999; Mckenzie and Sasin 2007; Sabates-Wheeler, Sabates, and Castaldo 2008).
In our study we address the endogeneity problem with a retrospective questionnaire that supports the collection of data at two points in time, i.e., the status of households in 2014, and the year in which migration occurred for migrant-sending households or ten years before (2004) for non-migrant-sending households. The ten-years reference period for non-migrant-sending households was the outcome of an exploratory analysis in the study location (see next section) that found that the vast majority of migrant-sending households had sent their migrants within the last ten years (this was later confirmed by the sample data, see section 5.2).
In Ethiopia, as in other sub-Saharan countries (de Brauw, Mueller, and Lee 2014), empirical migration studies are confronted with a profound lack of data. The national census is limited to questions focusing on place of birth, previous place of residence, and duration of current residence (see CSA 2006, 2010), which does not allow the examination of migration rates, determinants of migration, or implications for migration (de Brauw, Mueller, and Lee 2014).
While a growing number of studies investigate international migration, for Ethiopia the knowledge gap is particularly profound when it comes to determinants of intranational migration. Therefore, our study focuses on context-specific research at the lower administrative level, in our case the kebele, taking into account both inter- and intranational migration.
3. Conceptual framework and exploratory analysis
Shifting the focus away from individuals, the New Economics of Labour Migration (NELM) model (Stark and Bloom 1985; Stark 1991) and the Sustainable Livelihoods Approach (Ellis 2000, 2003) focus on household decisions. Both approaches conceptualize migration in the wider context of household members’ mutual and interdependent risk-sharing strategies (Stark and Bloom 1985; Stark 1991). The Sustainable Livelihoods Approach perceives migration as one of several livelihood strategies of households to fulfil their subsistence need in response to risks and constraining conditions (Ellis 2000, 2003).
The individual- and household-focused theories described are complementary in explaining the heterogeneity of migration determinants in a variety of micro-level contexts interacting with macro-level policy influence (King 2012). Due to the complexity and context-specific nature of migration patterns and the associated lack of a comprehensive migration theory (Castles 2010; King 2012), we grounded our study with an exploratory research phase in the Ethiopian study sites. Following Knafl and Howard (1984), the qualitative results from this explorative study should help to select an appropriate theoretical framework and to contextualize the literature-based hypotheses and response categories.
We organized an inter- and transdisciplinary workshop (King 2002, 2012; Brettell and Hollifield 2015) with Ethiopian demographic and development experts and local community representatives. Kebele leaders and development agents together with the application of the snowball technique helped to identify return migrants, heads of migrant-sending households, and persons who had seasonal migration experience, for exploratory interviews. Eighteen explorative interviews and four focus group discussions (in April and May 2014) helped to understand why and how locals migrate and who decides the issue.
According to the exploratory results, migration decisions are usually part of a mutual agreement between the migrant and other household family members. In the Ethiopian context, households are the suitable unit of analysis as they control the assets and ensure the future of the family (de Haan and Yaqub 2009). Therefore, we opted for the NELM framework, which places migration behaviour in the wider societal context of household decisions and concentrates straightforwardly on manifest household characteristics and migration (Taylor and Martin 2001; Hagen-Zaker 2008; De Haas 2010). NELM also takes into account complex, often indirect ways of how migration and remittances influence the economic status of households (De Haas 2010). Thus, it addresses both determinants and impacts of migration strategies (Taylor and Martin 2001; Hagen-Zaker 2008).
less than twelve months) and long-term migration (migrants who left for more than twelve months).
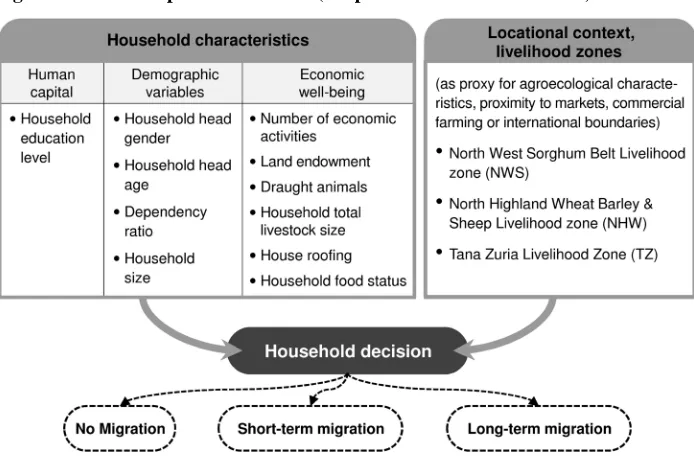
Figure 1: Conceptual framework (adopted from Bilsborrow 2002)
The NELM framework does not establish any explicit connection between household migration decisions and locational factors, which were identified as a relevant explanatory variable in the explorative study phase. Comparative locational (dis-) advantages have been considered by empirical application of the expectancy value theory and/or the theory of planned behaviour (De Jong 2000; Kley 2011) and in previous studies conducted in Ethiopia and elsewhere (see Taylor 1999; Ezra and Kiros 2001; Bilsborrow 2002; Olowa and Awoyemi 2012).
Figure 1 shows that we used livelihood zones3 (as defined in a joint project of USAID and the Ethiopian Government in 2007) as a proxy for location characteristics such as market access and agroecology. These features differ from study site to study site, despite the same national policies or international influences. Table 1 presents the
3 Livelihood zones are areas where people share similar livelihood patterns (influenced by local agroecology,
variable definitions and units of measurement and their assumed relation to migration (positive, negative, or ambiguous, according to the literature, see sections 7.2 and 7.3).
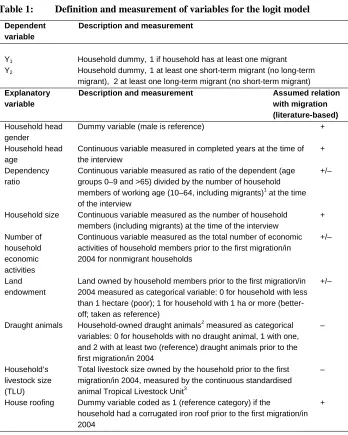
Table 1: Definition and measurement of variables for the logit model
Dependent variable
Description and measurement
Y1 Household dummy, 1 if household has at least one migrant
Y2 Household dummy, 1 at least one short-term migrant (no long-term
migrant), 2 at least one long-term migrant (no short-term migrant) Explanatory
variable
Description and measurement Assumed relation
with migration (literature-based) Household head
gender
Dummy variable (male is reference) +
Household head age
Continuous variable measured in completed years at the time of the interview
+
Dependency ratio
Continuous variable measured as ratio of the dependent (age groups 0–9 and >65) divided by the number of household members of working age (10–64, including migrants)1 at the time of the interview
+/–
Household size Continuous variable measured as the number of household members (including migrants) at the time of the interview
+
Number of household economic activities
Continuous variable measured as the total number of economic activities of household members prior to the first migration/in 2004 for nonmigrant households
+/–
Land endowment
Land owned by household members prior to the first migration/in 2004 measured as categorical variable: 0 for household with less than 1 hectare (poor); 1 for household with 1 ha or more (better-off; taken as reference)
+/–
Draught animals Household-owned draught animals2 measured as categorical variables: 0 for households with no draught animal, 1 with one, and 2 with at least two (reference) draught animals prior to the first migration/in 2004
–
Household’s livestock size (TLU)
Total livestock size owned by the household prior to the first migration/in 2004, measured by the continuous standardised animal Tropical Livestock Unit3
–
House roofing Dummy variable coded as 1 (reference category) if the
household had a corrugated iron roof prior to the first migration/in 2004
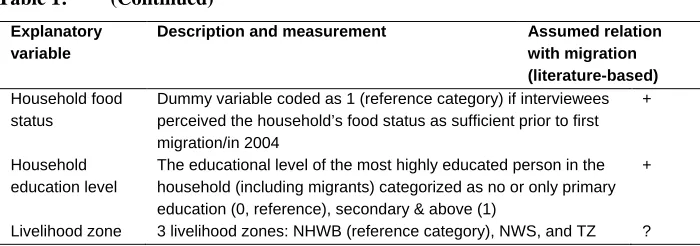
Table 1: (Continued)
Explanatory variable
Description and measurement Assumed relation
with migration (literature-based) Household food
status
Dummy variable coded as 1 (reference category) if interviewees perceived the household’s food status as sufficient prior to first migration/in 2004
+
Household education level
The educational level of the most highly educated person in the household (including migrants) categorized as no or only primary education (0, reference), secondary & above (1)
+
Livelihood zone 3 livelihood zones: NHWB (reference category), NWS, and TZ ?
Source: NELM literature-based assumption; “?” indicates unknown relationship as local context is outside of the NELM scope.
1Usually calculated as ratio of the net economical dependents (those aged 0‒14 and those aged 65+ years) to net economical
independents (15‒64 years). However, in a country like Ethiopia with low life expectancy and common child labour, this standard method would not reflect reality. Based on the exploratory analysis, we defined the dependent young cohort as the age group from 0–9.
2 Households with two or more draught animals can independently plough their farm plots, while households with only one draught
animal plough their plots by pairing with animals from their neighbours, and households with no draught animal plough by exchange of labour or fodder for the animals or by sharecropping.
3 A Tropical Livestock Unit (TLU) is a standardized animal unit equivalent to a live weight of 250 kilograms: one ox = 1.1 TLU, one
cow = 0.8 TLU, one bull = 0.6 TLU, one heifer = 0.5 TLU, one calf = 0.2 TLU, one horse/donkey/mule = 0.36 TLU, one sheep/goat = 0.1 TLU, and one chicken = 0.01 TLU (FAO 2003). There is an overlap between TLU and draught animal, but TLU is the most available form of physical asset, which may also compensate credit and saving imperfections in rural Ethiopia.
4. Methodology
4.1 Study sites and sampling
The study was conducted in four rural kebeles in north-west Ethiopia: Adisge-Miligebsa, Woken zuria, Nara-Awdarda, and Walideba, selected from three different
Gondar-Debark road but is still very far away from job opportunities. All the study areas are characterised by mixed crop-livestock production and are governed within the same Ethiopian policy framework, and the inhabitants speak the same language.
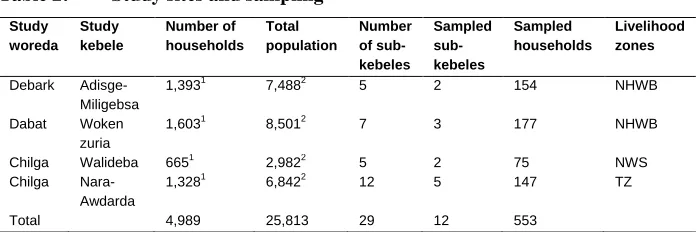
The study kebeles comprise 29 sub-kebeles (see Table 2). Time, financial, and logistical constraints called for a purposeful selection of twelve sub-kebeles, proportional to the total number of sub-kebeles and covering a variety of distances to the nearest road. The health posts of each kebele provided household lists. Five hundred and fifty-three households were randomly selected; they represent 11% of all households in each of the four kebeles (see Table 2). Nine deserted households, i.e., rare cases of out-migration of the entire household, were substituted by the nearest household, as no one was left to provide information.
Table 2: Study sites and sampling
Study woreda
Study kebele
Number of households
Total population
Number of sub-kebeles
Sampled sub-kebeles
Sampled households
Livelihood zones
Debark
Adisge-Miligebsa
1,3931 7,4882 5 2 154 NHWB
Dabat Woken
zuria
1,6031 8,5012 7 3 177 NHWB
Chilga Walideba 6651 2,9822 5 2 75 NWS
Chilga Nara-
Awdarda
1,3281
6,8422
12 5 147 TZ
Total 4,989 25,813 29 12 553
Sources: 1 unpublished data obtained from the Kebele Community-Based Health Information System (2014); 2 unpublished data
obtained from the CSA (2007)
4.2 Method of data collection
After the literature review and explorative analysis (section 3), a questionnaire was drafted and translated to the local language, Amharic. A pretest with 40 households helped to test the understandability of the questionnaire and to check if the answer categories were complete and did not overlap. Atsede Desta Tegegne, supported by seven research assistants, carried out the interviews in August and September 2014. Data collectors had been intensively trained regarding the concept behind each question and data gathering techniques. Once households were selected, we asked the household heads (if not available their spouses) to answer the questions.
nonmigrant households respectively (see Table 1). Retrospective interviews about past household characteristics are not free from recall bias. During data collection, interviewers supported interviewees to contemplate and reconstruct the past household status. In line with Easterlin (2001) we started with questions on the current situation before posing the same question about the past. Furthermore, to overcome recall bias, retrospective questions focused on households’ ‘objective’ living conditions, which are most likely to be affected by the migration itself; for example, draught animal ownership, land-holding size, house roofing, and number of economic activities. If households had sent more than one migrant, we defined the temporal reference point as prior to the departure of the first migrant in order to overcome subsequent migration impacts on the selected variables.
4.3 Methods of data analysis
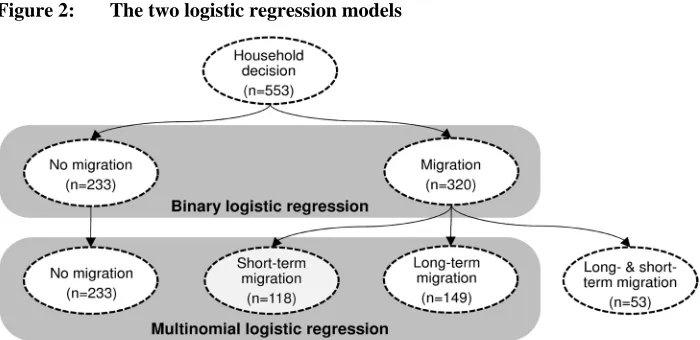
Figure 2: The two logistic regression models
We opted for a combined presentation of binary and multinomial logit models, as these two models best describe the data, allow for the inclusion of all cases, and use the same reference category of ‘no migration’ (see Figure 2). The binary logit model looks into the variables influencing the sample households’ probability of sending at least one migrant, short-term, long-term, or both (see Table 5). After excluding 53 households with both short-term and long-term migrants, we scrutinized the data of 500 households in a multinomial analysis regarding their decisions for no migration, short-term migration, or long-term migration.
Before the regression analyses the data was crosschecked to ensure that all expected frequencies in each cell of a cross-tabulation table were greater than 1 and that no more than 20% were less than 5. Multicollinearity was checked based on variance inflation factors and tolerance values. In our sample we did not find any long-term migrant-sending household with no formal education. To avoid a quasi-complete separation problem due to zero cell counts, we combined the answer categories of ‘no formal education’ and ‘primary education.’
5. Characteristics of the sampled households and migrants
5.1. Comparison of the sample with rural Ethiopia and the Amhara region
Amhara region (83%) and nationwide (44%). Due to the small number of questionnaires filled in by other religious groups (expected count below 5%, section 4.3), we were not able to analyse possible statistical relations between religion and migration decisions.
The average household size of our sampled population is 6.6 persons, which is above the average of 5.1 in rural Ethiopia (CSA 2012). This can be partly explained by the inclusion of long-term migrants in our definition of household size, who are excluded from the national census household member defintion. On average, our sample households send 1.1 migrants. The corrected sample’s household size (5.5), however, is still slightly above the national rural average (5.1).
The majority of the sampled households (86%) are currently headed by males, which is above the male proportion for rural Ethiopia of 78% (CSA 2012). The share of households covered by corrugated iron sheeting (as an indicator of housing quality and economic wellbeing) is similar to the overall situation in rural areas (34% in the sample versus 39% in the rural Amhara region and 26 % in rural Ethiopia; see CSA 2010).
To analyse the educational characteristics of households across the study sites, we asked respondents about the household head’s education and the highest educational level of household members, including the migrants before departure. In rural Ethiopia the percentage of household heads who completed primary education (up to grade 6) was 11% in 2010/11 and below 5 % in 2004/05 (CSA 2012). Similarly, only 8% of the sampled household heads had formal education.
The average farm size in our sample is 0.99 hectares, which is almost the same as that in the national land use survey, 0.95 hectares (CSA 2014). More than half of the sampled households (53%) hold less than one hectare of farm land (Amhara region 50%, nationwide 59%) (CSA 2014). We assume that the sample is representative of rural Ethiopia regarding education, farmland endowment, and the housing quality indicator ‘iron roof.’ However, compared to other rural areas in Ethiopia, the sample is characterised by a much higher share of Orthodox Christians and slightly bigger household sizes.
5.2 Characteristics of the migrants
household interviewees stated that migration decisions were made by the family, which confirms the choice of the NELM framework (section 3).
Figure 3: Distribution of the 616 migrants by year of first departure
Source: household interviews carried out in 2014
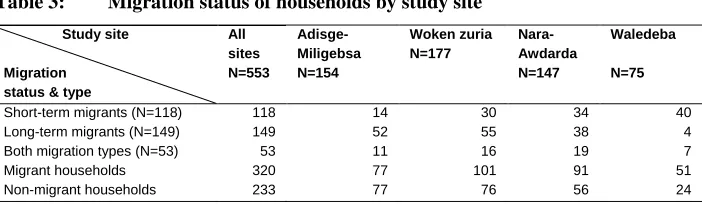
Table 3 shows the distribution of household's migration status across the study sites. 18% of the 202 long-term migrant households sent their migrants abroad, mostly to Sudan and Middle East countries. The majority of international migrants are found in the sample of Adisge-Miligebsa, and none in the kebele Waledeba.
Table 3: Migration status of households by study site
Study site
Migration status & type
All sites N=553 Adisge-Miligebsa N=154 Woken zuria N=177 Nara- Awdarda N=147 Waledeba N=75
Short-term migrants (N=118) 118 14 30 34 40
Long-term migrants (N=149) 149 52 55 38 4
Both migration types (N=53) 53 11 16 19 7
Migrant households 320 77 101 91 51
Non-migrant households 233 77 76 56 24
Source: household interview carried out in 2014
0 20 40 60 80 100 120 198 1 198 8 199 1 199 2 199 3 199 4 199 5 199 6 199 7 199 8 199 9 200 0 200 1 200 2 200 3 200 4 200 5 200 6 200 7 200 8 200 9 201 0 201 1 201 2 201 3 201 4 Num ber of m igr ants
At the time of departure, 82% of the migrants were single and young (mean age about 20 years). 76.5% of them can be considered educated (completed primary or higher education before their departure). 60% of all migrants were male. Whereas females were predominantly (85%) involved in long-term migration, males predominated in farm-related jobs available in short-term migration destinations. Migration was motivated predominantly by economic reasons: landlessness or small land endowment (64%), unemployment (58%), and low agriculture productivity (33%) were the answer categories most often chosen by the interviewees (multiple answers possible).
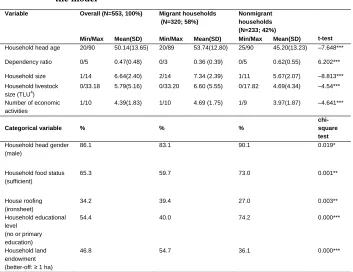
Table 4 provides an overview of the dataset for the full sample and for the two subsamples of nonmigrant and migrant households. The t-test and Pearson’s chi-square test, respectively, had already revealed statistically significant differences between migrant- and nonmigrant-sending households.
Table 4: Summary statistics for discrete and continuous variables included in
the model
Variable Overall (N=553, 100%) Migrant households (N=320; 58%)
Nonmigrant households (N=233; 42%)
t-test Min/Max Mean(SD) Min/Max Mean(SD) Min/Max Mean(SD)
Household head age 20/90 50.14(13.65) 20/89 53.74(12.80) 25/90 45.20(13.23) ‒7.648*** Dependency ratio 0/5 0.47(0.48) 0/3 0.36 (0.39) 0/5 0.62(0.55) 6.202*** Household size 1/14 6.64(2.40) 2/14 7.34 (2.39) 1/11 5.67(2.07) ‒8.813*** Household livestock
size (TLU4)
0/33.18 5.79(5.16) 0/33.20 6.60 (5.55) 0/17.82 4.69(4.34) ‒4.54***
Number of economic activities
1/10 4.39(1.83) 1/10 4.69 (1.75) 1/9 3.97(1.87) ‒4.641***
Categorical variable % % %
chi-square test
Household head gender (male)
86.1 83.1 90.1 0.019*
Household food status (sufficient)
65.3 59.7 73.0 0.001**
House roofing (ironsheet)
34.2 39.4 27.0 0.003**
Household educational level
(no or primary education)
54.4 40.0 74.2 0.000***
Household land endowment (better-off: ≥ 1 ha)
Table 4: (Continued)
Categorical variable Overall (N=553, 100%)
Migrant households (N=320; 58%)
Nonmigrant households (N=233; 42%)
chi-square test
Household draught animal
Two or more draught animals 61.3 65.6 55.4 0.012* One draught animal 18.3 18.3 18.5
No draught animal 20.4 16.2 26.2 Livelihood zone
NHWB 59.9 55.6 65.7 0.040* TZ 26.6 28.4 24.0
NWS 13.6 15.9 10.3
Source: household interviews carried out in 2014; *** (p<0.001), ** (p<0.01) * (p<0.5)
6. Determinants of migration decisions
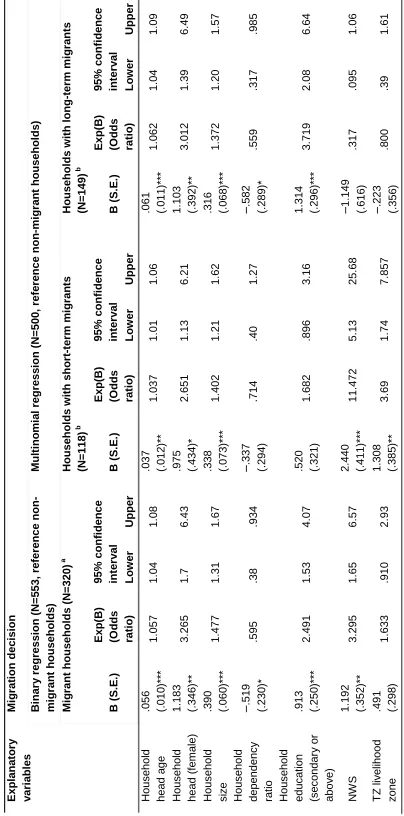
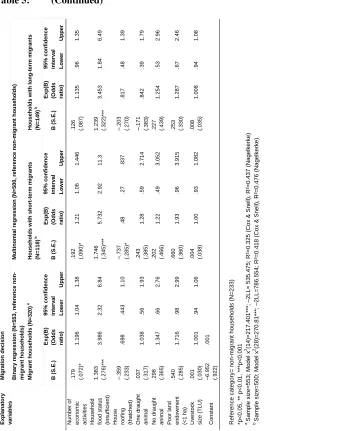
Table 5 presents the results of both the binomial (first column) and multinomial logistic regressions (second and third columns). Both have the same reference category of nonmigrant households.
6.1 Binary logistic regression explaining the propensity to migrate
Two hundred and thirty-three of all the households interviewed had not sent any migrants and 320 were homes of migrants (short-term and/or long-term). The first column of Table 5 provides an overview of the results of the binary logistic regression looking into the variables explaining the propensity of rural households to send members out of the village, independent of the duration.
in the North Highland Wheat & Barley (NHWB) livelihood zone, which is further away from commercial farming areas.
Household head’s gender is another variable with an assumed positive relationship with migration decisions. Sample households headed by females were 3.3 times (p=0.001) more likely to send a migrant than those headed by males. Households that had family members with some or completed secondary education were 2.5 (p=0.000) times more likely to report a positive migration decision compared to those households with no or only primary education.
The literature review showed both positive and negative relations between dependency ratio and migration decision (Table 1 and section 7.3). In our logit model the dependency ratio significantly lowered the propensity of the sample households to send a migrant (see Table 5). An increase of one dependent (in the study sites, as generally in Ethiopia, this would very likely be an extra child, due to high fertility rates and low life expectancy) decreased the probability of the sample households’ decision to send a migrant by 0.6 (p=0.024).
As expected, we see a positive – albeit small – relation between household size and the odds of sending a migrant. The increase by one family member raises the likelihood of a migration decision by 48% (p=0.000).
The logistic regression shows a significant positive relation between age of the household head and the odds of sending a migrant. In our sample a one-year expansion in the age of the household head increases the odds of sending a migrant by 6% and a ten-years age raise increases the odds by 81% (p=0.000).
Table 5: Likelihood estimates of the logit models for the determinants of rural out-migration (binary model) and short-term and long-term
migration choices (multinomial model)
E xpl anat or y v ar iabl es M ig rat ion dec isi on B inar y r egr essi on (N = 5 53, r e fer ence non -m igr an t househo lds ) M ul ti no m ia l r egr ess ion ( N = 500 , r ef e rence non -m igr an t househo lds ) M ig rant househol ds ( N = 320) a H ousehol ds w it h sho rt -t er m m igr an ts (N = 118) b H ousehol ds w it h long -t e rm mi g ra n ts (N = 149) b B ( S .E .) E xp( B ) (O dds ra ti o) 95% conf idence int er v al B ( S .E .) E xp( B ) (O dds ra ti o) 95% conf idence int er v al B ( S .E .) E xp( B ) (O dds ra ti o) 95% conf idence int er v al Lo w er U pper Lo w er U pper Lo w er U pper H ous ehol d head a g e
.056 (.010
)* ** 1. 057 1. 04 1. 08
.037 (.012
)* * 1. 037 1. 01 1. 06
.061 (.011
)* ** 1. 062 1. 04 1. 09 H ous ehol d head ( fem al e) 1. 183 (. 346 )* * 3. 265 1. 7 6. 43
.975 (.434
)* 2. 651 1. 13 6. 21 1. 103 (. 392 )* * 3. 012 1. 39 6. 49 H ous ehol d s ize
.390 (.060
)* ** 1. 477 1. 31 1. 67
.338 (.073
)* ** 1. 402 1. 21 1. 62
.316 (.068
)* ** 1. 372 1. 20 1. 57 H ous ehol d dependenc y ra tio ‒ .519 (. 230 )* .595 .38 .934 ‒ .337 (. 294 ) .714 .40 1. 27 ‒ .582 (. 289 )* .559 .317 .985 H ous ehol d educ at ion (s ec ondar y o r abov e)
.913 (.250
)* ** 2. 491 1. 53 4. 07
.520 (.321
) 1. 682 .896 3. 16 1. 314 (. 296 )* ** 3. 719 2. 08 6. 64 NW S 1. 192 (. 352 )* * 3. 295 1. 65 6. 57 2. 440 (. 411 )* ** 11. 472 5. 13 25. 68 ‒ 1. 149 (. 616 ) .317 .095 1. 06 T Z l iv el ihood z one
.491 (.298
Table 5: (Continued) E xpl anat or y v ar iabl es M ig rat ion dec isi on B inar y r egr essi on (N = 5 53, r e fer ence non -m igr an t househo lds ) M ul ti no m ia l r egr ess ion ( N = 500 , r ef e rence non -m igr an t househo lds ) M ig rant househol ds ( N = 320) a H ousehol ds w it h sho rt -t er m m igr an ts (N = 118) b H ousehol ds w it h l ong -t e rm mi g ra n ts (N = 149) b B ( S .E .) E xp( B ) (O dds ra ti o) 95% conf idence int er v al B ( S .E .) E xp( B ) (O dds ra ti o) 95% conf idence int er v al B ( S .E .) E xp( B ) (O dds ra ti o) 95% conf idence int er v al Lo w er U pper Lo w er U pper Lo w er U pper N um ber o f ec onom ic a c tiv it ie s
.179 (.072
)* 1. 196 1. 04 1. 38
.192 (.090
)* 1. 21 1. 06 1. 446
.126 (.087
) 1. 135 .96 1. 35 H ous ehol d food s tat u s (in s u ff ic ie n t) 1. 383 (. 276 )* ** 3. 986 2. 32 6. 84 1. 746 (. 345 )* ** 5. 732 2. 92 11. 3 1. 239 (. 322 )* ** 3. 453 1. 84 6. 49 H ous e ro of ing (t ha tc hed) ‒ .359 (. 233 ) .698 .443 1. 10 ‒ .737 (. 285 )* .48 .27 .837 ‒ .203 (. 270 ) .817 .48 1. 39 O ne d rau g ht ani m al
.037 (.317
) 1. 038 .56 1. 93
.243 (.385
) 1. 28 .59 2. 714 ‒ .171 (. 383 ) .842 .39 1. 79 N o dr au g ht ani m al
.298 (.365
) 1. 347 .66 2. 76
.202 (.466
) 1. 22 .49 3. 052
.227 (.439
) 1. 254 .53 2. 96 P oor l and endow m ent (< 1 ha)
.540 (.285
) 1. 716 .98 2. 99
.660 (.360
) 1. 93 .96 3. 915
.253 (.330
) 1. 287 .67 2. 46 Li v es toc k s iz e ( T L U)
.001 (.030
) 1. 001 .94 1. 06
.004 (.038
) 1. 00 .93 1. 082
.008 (.035
) 1. 008 .94 1. 08 C ons tant – 6. 952 (. 922 ) .001 R ef er enc e c at eg or y = non -m ig rant hous eh ol ds ( N = 233) *p< 0. 05 , * * p< 0. 0 1, * ** p< 0. 00 1
a S
a m pl e s iz e= 553; M o del x 2(14) = 217. 4 01* ** ; – 2L L= 53 5. 4 75; R ²= 0. 325 ( C ox & S nel l) , R ²= 0. 43 7 ( N ag el k er k e)
b S
6.2 Determinants explaining the propensity for short-term and long-term migration choices
In the multinomial logistic model (second and third columns in Table 5), we analysed 500 households (excluding 53 that had both short-term and long-term migrants), to understand why 118 of them opted for short-term and 149 for long-term migration. As expected from the binary regression, the multinomial regression shows that age of the household head, household size, household head's gender, and perceived food status of the household are identified as having a significant positive explanatory value for both term and long-term migration. However, we found that the likelihood of short-term migration is considerably higher in households with perceived food insufficiency (5.7 versus 3.5 times). The propensity for long-term migration is slightly higher in female-headed households (3.0 versus 2.7 times).
Sample households with some or completed secondary education were 3.7 times (p=0.000) more likely to send long-term migrants, whereas education seems to play no significant role in short-term migration decisions (Table 5). One has to keep in mind that we combined categories of education level, as our sample did not include any long-term migrant-sending household with no formal education, which highlights the relevance of education to long-term migration.
The negative relation between the dependency ratio and overall migration mainly refers to long-term migration. In the multinomial regression the dependency ratio significantly lowered the propensity of households to send a long-term migrant by 0.6 (p=0.044), but did not show any significant effect for short-term migration.
The relative locational advantage of households in NWS and TZ (Tana Zuria) livelihood zones, which represent better agricultural productivity and proximity to commercial farming areas, increased the propensity for short-term migration 11.5 (p=0.000) and 3.7 times (p=0.001) respectively. However, location showed no significant effect on long-term migration, despite the higher share of long-term migrants in the more mountainous NHWB reference zone, which includes the sub-samples of the kebeles Adisge-Miligebsa and Woken zuria in or near the mountainous Semen National Park (see Table 3).
7. Discussion
7.1 Discussion of the research design
Our analysis is limited by its spatial scope and the number of interviewees. The sample can be considered to be structurally representative of rural Ethiopia regarding education, farmland endowment, and the housing quality indicator ‘iron roof.’ However, compared to other rural areas in Ethiopia, the sample is characterised by a much higher share of Orthodox Christians, a slightly higher share of male household heads and slightly bigger households. We consider the purposefully selected study site in the Amhara region as representative of other rural areas in Ethiopia regarding the determinants of household migration decisions. However, we caution against misleading generalisations when it comes to the proportion of migrant-sending households or the share of short-term and long-term migrants.
Another potential limitation of the research design is that households with migration returnees are considered as non-migrant households. Return migrants’ past remittances might have distorted some of the data on economic well-being. However, we consider the risk of this potentially misleading effect to be very low, as exploratory findings showed that long-term migrants commonly are uninterested in returning to their rural village, and short-term migrants seem to be less willing to contribute to household expenditure but rather try to invest in their own land or enterprise.
The common challenge faced by empirical migration studies using cross-sectional data (e.g., for Ethiopia, Gebru and Beyene 2012) is the intrinsic endogeneity problem (see section 2), which might result in biased results and misleading decision support for migration-related policy choices (Mckenzie and Sasin 2007). To address this endogeneity challenge, we collected quasi-longitudinal data (two points in time) on explanatory variables that might be affected by the migration process itself (see Table 1). Being aware of potential recall bias, we supported interviewees in reconstructing the past household situation. Furthermore, we tried to understand context-specific migration strategies in explorative semi-structured interviews and focus group meetings. These qualitative insights hopefully helped us to contextualize our literature-based research hypotheses, questionnaire, and response categories and also supported the following discussion and interpretation of the quantitative results.
Sabates-Wheeler, Sabates, and Castaldo 2008). Overall, the first binary regression model correctly predicts 85.3% of households’ decision to send a migrant (77.6% of both migrant- and non-migrant-sending cases). The multinomial model fit is good with p=0.502 Pearson and 1.000 deviance statistics, indicating that the model does not significantly differ from the observed data.
In the multinomial model, the B value of 2.44 shows a very strong positive relation between the accessibility of commercial farming areas (NWS livelihood zone) and short-term migration. A multilevel model would have been very helpful to better understand the interaction between higher-level neighbourhood and lower household-level effects. However, our study areas did not include enough neighbourhoods (livelihood zones) for such an analysis (Kreft and De Leeuw 1998; Maas and Hox 2005). A future nationwide migration study could, however, consider a multilevel model to better estimate this contextual effect.
Despite all its limitations, this study provides interesting new insights on short-term and long-short-term migration choices that contribute to ambiguous migration determinants (see section 7.3). However, first we discuss those results that confirm prior research.
7.2 Results confirming prior research
The results for the role of education, household head’s gender and age, household size, and dependency ratio in migration decisions presented in section 6 are largely consistent with previous studies in Ethiopia and elsewhere and also with the explorative findings from the study sites. The very strong positive relation between formal secondary education and migration in general (the probability is two times higher) and long-term migration in particular (the probability is four times higher) confirms previous studies in rural Bangladesh, Ethiopia, Ghana, Haiti, Kenya, and Mexico (Chiquiar and Hanson 2005; Mora and Taylor 2006; Sindi and Kirimi 2006; Tsegai 2007; Mendola 2008; Hailemariam and Adugna 2011; Bezu and Holden 2014; Heckert 2015). The findings of transdisciplinary scenario research show that more highly educated household members – particularly from the kebeles Adisge-Miligebsa and Woken zuria – tend to leave rural areas in search of better options (Tegegne, Penker, and Wurzinger 2015). In contrast to its strong effect on long-term migration, our results highlight that education does not play a significant role in short-term migration.
and tended to possess comparatively less productive assets than male-headed households. This economic disadvantage may push household members into either short-term or long-term migration to sustain their livelihood. Further explanations related to gender include encouragement for females to migrate due to the expectation that Ethiopian females are more likely to remit than male migrants (de Brauw, Mueller, and Woldehanna 2013). In addition, return migrants, who we interviewed in our explorative study, also pointed out the demand for female migrants in destination countries (e.g., as housemaids in the Middle East and Sudan) and the dominance of men in commercial agriculture and thus short-term migration. Studies in Nicaragua (Murrugarra and Herrera 2011) also found that males predominantly migrate to areas with high agricultural labour demand.
According to the literature, increasing household size may put more pressure on household consumption and thus trigger migration, resulting in fewer mouths to feed, but migration also implies labour loss for sending households. Consistent with other studies in Ethiopia, Albania, Bangladesh, Ghana, and Moldova, we found that households’ propensity to migrate increases by 48% with a one-unit increase in household size (Tsegai 2007; Hagen-Zanker, Siegel, and de Neubourg 2009; Ahamad et al. 2011; Gray and Mueller 2012). According to the explorative findings, the inheritance land division where land is divided between subsequent siblings makes the farm plots too small for sustaining a household, resulting in the search for livelihood alternatives, including migration.
In migration studies, house-quality indicators, such as types of roof, flooring, and walls, and water and electricity facilities, are often used as proxy poverty variables (Mora and Taylor 2006). In rural Ethiopia, roofs that used to be constructed from thatch are increasingly covered by corrugated iron sheeting. Ezra and Kiros (2001) identify thatched roofing as among the major explanatory variables for rural out-migration in drought-prone areas of Ethiopia. However, our logistic model reported an insignificant relation of thatched roofing with overall migration and a significant negative relation with short-term household migration decisions. Even though an iron roof is often interpreted as a sign of economic advancement, the explorative findings, particularly from the kebeles of Adisge-Miligebsa and Woken zuria, revealed limited access to thatch as an alternative explanation. This resource scarcity might have distorted the variable's informative value.
7.3 Results contributing to the discussion of ambiguous migration determinants
farm labour capacity, it can also be understood as strategy to reduce the number of mouths to be fed (Hagen‐Zanker, Siegel, and de Neubourg 2009; Zezza et al. 2011). The NELM model considers migration not only as income maximization strategy but also as an option to diversify household risks (Stark and Bloom 1985). In our results, households who reported insufficient food status were observed to be four times more likely to send migrants, or, more specifically, six times more likely to have short-term and three times more likely to have long-term migrants.
In the literature, migration is conceptualized as a life-cycle event (Görlich and Trebesch 2008; Olowa and Awoyemi 2012): Households headed by older persons are expected to have fewer dependent children but more family members in the working age group. Thus, the household head’s age was reported as having a positive effect on migration in Guatemala (Adams 2006). By contrast, Görlich and Trebesch (2008) reported a negative effect for Moldova. Our results in Ethiopia show that a ten-year increase in the household head’s age raises the propensity to migrate by 74%, with a higher effect on long-term migration (82%) than on short-term migration (44%). Furthermore, a higher dependency ratio may push migration due to the search for more income for dependent household members or, by contrast, may constrain migration due to the demand for labour at home. Like Görlich and Trebesch (2008) for Moldova, our results also reveal a significant negative effect of the number of dependents in a household on long-term migration decisions.
In Ethiopia the state allocates land titles and land use rights through local governments (kebeles). In our analysis, we identified no significant explanatory value of our two categories of land endowment: households owning no or less than one hectare of land and those possessing one hectare or more. On the one hand, scholars emphasize the transaction costs of migration, which can be covered more easily by better-off households with more land (Mckenzie and Rapoport 2007). On the other hand, abundance of farm land can reduce the economic pressure for out-migration, such as indicated by recent studies in Ethiopia (Bezu and Holden 2014), Kenya (Sindi and Kirimi 2006), or Mexico (Mora and Taylor 2006).
endowment can afford to educate their children, which increases their propensity to migrate to destinations with better paying non-farm jobs (Bezu and Holden 2014).
These mixed migration effects documented in the literature might also explain why land endowment was not identified as a predictor of the sample households’ migration decisions in our research. In the exploratory study, return migrants and other locals reported that brokers support international migration to Sudan (direct brokering) and the Middle East (usually via an agent) by facilitating transport and providing contact persons and jobs in the destination country. Brokers also accept ex-post remuneration for their services from the money earned abroad.
In the sustainable livelihoods approach, migration is conceptualised as one of several livelihood strategies in developing countries (Ellis 2003). If the number of economic activities is limited, migration is seen as a strategy for income diversification (Ellis 2000). In contrast to this assumption, an empirical study in Kenya (Sindi and Kirimi 2006) showed that off-farm and non-farm activities are often only carried out on a small-scale level and therefore are not financially satisfying. Therefore, despite numerous activities, households continue to seek out alternative livelihood strategies, including migration. In our study, an additional economic activity showed a positive albeit small relation (increase of 20%) with the likelihood of sending a short-term migrant, but does not show a significant interrelation with long-term migration.
The coefficients for farm size, draught animals, and livestock assets, which are commonly regarded as suitable indicators of economic and productive household assets in rural Ethiopia (Dercon, Hoddinott, and Woldehanna 2005; Little et al. 2006; Gray and Mueller 2012; Bezu and Holden 2014), did not show a significant explanatory value for the migration decisions of our sample households. Similarly, nor could these variables explain migration decisions in Mexico (Mora and Taylor 2006).
7.4 Results supplementing the NELM framework
evidence of selection of migration strategies based on diverging comparative location advantages in different study sites.
A study conducted in Mexico (Mora and Taylor 2006) shows an effect of location factors on the probability of a decision for international migration rather than internal migration. Bilsborrow (2002) also emphasises that places’ different economic opportunities and the contextual factors of households influence peoples’ migration decisions. As location seems to matter, and as only a few previous migration studies have included the contextual factor of household location (Taylor 1999; Ezra and Kiros 2001; Olowa and Awoyemi 2012), future empirical migration studies might be well advised to extend the NELM framework with locational meso-level variables in a multi-level analysis, particularly if they include short-term migration.
8. Conclusion
9. Acknowledgements
References
Abreu, A. (2012). The new economics of labor migration: Beware of neoclassicals bearing gifts. Forum for Social Economics 41(1): 1–17. doi:10.1007/s12143-010-9077-2.
Adams, R.H.J. (2006). Remittances, poverty, and investment in Guatemala. In: Özden, Ç. and Schiff, M. (eds.). International migration, remittances and the brain drain. Washington, D.C.: World Bank and Palgrave Macmillan: 53–80. doi:10.1596/1813-9450-3838.
Adepoju, A. (2008). Migration in sub-Saharan Africa. Current African Issues 37. Uppsala: The Nordic Africa Institute.
Ahamad, M.G., Khondker, R.K., Ahmed, Z.U., and Tanin, F. (2011). Seasonal unemployment and voluntary out-migration from Northern Bangladesh. Modern Economy 2: 174–179.
Ajzen, I. (1988). Attitudes, personality, and behavior (U.S. ed.). Chicago: Dorsey Press. Belay, K. (2004). Resettlement of peasants in Ethiopia. Journal of Rural Development
27 (Winter): 223–254.
Berhanu, B. and White, M. (2000). War, famine, and female migration in Ethiopia, 1960–1989. Economic Development and Cultural Change 49(1): 91–113. doi:10.1086/452492.
Bezu, S. and Holden, S. (2014). Are rural youth in Ethiopia abandoning agriculture?
World Development 64: 259–272. doi:10.1016/j.worlddev.2014.06.013.
Bilsborrow, R.E. (2002). Migration, population change, and the rural environment. In: Dabelko, G.D. (ed.). Environmental change & security project report. Issue 8. Washington, D.C.: The Woodrow Wilson Centre: 69–94.
Brettell, C.B. and Hollifield, J.F. (2015). Introduction: Migration theory, talking across disciplines. In: Brettell, C.B. and Hollifield, J.F. (eds.). Talking across disciplines. New York: Taylor and Francis: 1–23.
Castles, S. (2010). Understanding global migration: A social transformation perspective. Journal of Ethnic and Migration Studies 36(10): 1565–1586. doi:10.1080/1369183X.2010.489381.
CSA (Central Statistics Agency) (2007). The 2007 national population and housing census data base. Unpublished raw data. Addis Ababa.
CSA (Central Statistical Agency) (2010). The 2007 population and housing census of Ethiopia. Addis Ababa: Office of the Population Census Commission (National statistical report).
CSA (Central Statistical Agency) (2012). Household consumption and expenditure (HCE) survey 2010/11. Addis Ababa: The Federal Democratic Republic of Ethiopia (Analytical report, Statistical Bulletin 563).
CSA (Central Statistical Agency) (2014). Agricultural sample survery: Report on land utilization, 2013/2014. Addis Ababa: The Federal Democratic Republic of Ethiopia (Statistical Bulletin 446, Vol. IV).
Chiquiar, D. and Hanson, G.H. (2005). Distribution of wages: Evidence from Mexico and the United States. Journal of Political Economy 113(2): 239–281. doi:10.1086/427464.
De Brauw, A. and Mueller, V. (2012). Do limitations in land rights transferability influence low mobility rates in Ethiopia? Journal of African Economies 21(4): 548–579. doi:10.1093/jae/ejs007.
De Brauw, A., Mueller, V., and Lee, H.L. (2014). The role of rural–urban migration in the structural transformation of sub-Saharan Africa. World Development 63: 33– 42. doi:10.1016/j.worlddev.2013.10.013.
De Brauw, A., Mueller, V., and Woldehanna, T. (2013). Motives to remit: Evidence from tracked internal migrants in Ethiopia. World Development 50: 13–23. doi:10.1016/j.worlddev.2013.04.008.
De Haan, A. and Yaqub, S. (2009). Migration and poverty: Linkages, knowledge gaps and policy implications. Geneva: United Nations Research Institute for Social Development (Social Policy and Development Programme Paper Number 40). De Haas, H. (2010). Migration and development: A theoretical perspective.
International Migration Review 44(1): 227–264. doi:10.1111/j.1747-7379.2009.00804.x.
De Jong, G.F. (2000). Expectations, gender, and norms in migration decision-making.
Population Studies 54(3): 307–319. doi:10.1080/713779089.
African countries. Washington D.C.: World Bank (World Bank Policy Research Working Paper 4218).
Dercon, S., Hoddinott, J., and Woldehanna, T. (2005). Shocks and consumption in 15 Ethiopian villages, 1999‒2004. Journal of African Economies 14(4): 559–585. doi:10.1093/jae/eji022.
Easterlin, R.A. (2001). Income and happiness: Towards a unified theory. The Economic Journal 111(473): 465–484. doi:10.1111/1468-0297.00646.
Ellis, F. (2000). The determinants of rural livelihood diversification in developing countries. Journal of Agricultural Economics 51(2): 289–302. doi:10.1111/j.1477-9552.2000.tb01229.x.
Ellis, F. (2003). A livelihoods approach to migration and poverty reduction. Norwich: Department for International Development (DFID) (No.CNTR- 034890). Ezra, M. (2001). Ecological degradation, rural poverty, and migration in Ethiopia: A
contextual analysis. New York: Population Council (Policy Research Division Working Papers No. 149). doi:10.1111/j.1747-7379.2001.tb00039.x.
Ezra, M. and Kiros, G. (2001). Rural out-migration in the drought prone areas of Ethiopia: A multilevel analysis. International Migration Review 35(3): 749–771. FAO (Food and Agriculture Organization of the United Nations) (2003). Compendium of agricultural – environmental indicators 1989‒91 to 2000. Rome: Statistics Division ‒ Food and Agriculture Organization of the United Nations.
FDRE (Federal Democratic Republic of Ethiopia) (2005). Federal Democratic Republic of Ethiopia rural land administration and land use proclamation. Addis Ababa (No. 456/2005).
Fishbein, M. and Ajzen, I. (1975). Belief, attitude, intention, and behavior: An introduction to theory and research. Reading, MA: Addison-Wesley.
Gebru, G.W. and Beyene, F. (2012). Causes and consequences of out-migration on rural households’ livelihood in Gulomekeda district, Tigray, Ethiopia. Agricultural Research and Reviews 1(1): 26–33.
Görlich, D. and Trebesch, C. (2008). Seasonal migration and networks ‒ evidence on Moldova’s labour exodus. Review of World Economics 144(1): 107–133. doi:10.1007/s10290-008-0139-y.
Gray, C. and Mueller, V. (2012). Drought and population mobility in rural Ethiopia.
Hagen-Zaker, J. (2008). Why do people migrate? A review of the theoretical literature. Maastricht: Maastricht Graduate School of Governance, Maastricht University. (Working Paper MGSoG/2008/WP002).
Hagen-Zanker, J., Siegel, M., and de Neubourg, C. (2009). Strings attached: The impediments to migration in Albania and Moldova. Southeast European and Black Sea Studies 9(4): 459–479. doi:10.1080/14683850903314964.
Hailemariam, A. and Adugna, A. (2011). Migration and urbanization in Ethiopia: Addressing the spatial imbalance. In: Teller C. and Hailemariam A. (eds.). The demographic transition and development in Africa: The unique case of Ethiopia. New York: Springer: 145–165. doi:10.1007/978-90-481-8918-2_8.
Hailu, Z. and Backstrom, L. (2006). Model for establishing tenure security in other countries: Land administration in Ethiopia. GIM International (February): 15– 17.
Hammond, L. (2008). Strategies of invisibilization: How Ethiopia’s resettlement programme hides the poorest of the poor. Journal of Refugees Studies 21(4): 517–536. doi:10.1093/jrs/fen041.
Harris, J.R. and Todaro, M.P. (1970). Migration, unemployment and developmnent: A two-sector analysis. American Economic Review 60(1): 126–142.
Heckert, J. (2015). New perspective on youth migration: Motives and family investment patterns. Demographic Research 33(27): 765–800. doi:10.4054/DemRes.2015.33.27.
Kassie, G.T., Asfaw, W., Zeleke, G. and Scott, D. (2008). The nexus of migration, HIV/AIDS and food security in Ethiopia. Washington, D.C.: IFPRI. (RENEWAL Working Paper).
Kebele Community-Based Health Information System (2014). Unpublished kebele health post data recording and reporting family folder: Adisge-Miligebsa, Woken zuria, Nara-Awdarda, and Walideba kebeles.
King, R. (2002). Towards a new map of European migration. International Journal of Population Geography 8(2): 89–106. doi:10.1002/ijpg.246.
Kley, S. (2011). Explaining the stages of migration within a life-course framework.
European Sociological Review 27(4): 469–486. doi:10.1093/esr/jcq020.
Knafl, K.A. and Howard, M.J. (1984). Interpreting and reporting qualitative research.
Research in Nursing and Health 7(1): 17–24. doi:10.1002/nur.4770070105. Kreft, G.G. and De Leeuw J. (1998). Introducing multilevel modeling. London: SAGE
Publications. doi:10.4135/9781849209366.
Little, P.D., Stone, M.P., Mogues, T., Castro, A.P., and Negatu, W. (2006). ‘Moving in place’: Drought and poverty dynamics in South Wollo, Ethiopia. Journal of Development Studies 42(2): 200–225. doi:10.1080/00220380500405287.
Maas, C.J.M. and Hox, J.J. (2005). Sufficient sample sizes for multilevel modeling.
Methodology 1(3): 86–92. doi:10.1027/1614-2241.1.3.86.
Malmberg, B. (2008). Demography and the development potential of sub-Saharan Africa. Current African Issues 36. Uppsala: The Nordic Africa Institute.
Mberu, B.U. (2006). Internal migration and household living conditions in Ethiopia.
Demographic Research 14(21): 509–540. doi:10.4054/DemRes.2006.14.21. Mckenzie, D. and Rapoport, H. (2007). Network effects and the dynamics of migration
and inequality: Theory and evidence from Mexico. Journal of Development Economics 84(1): 1–24. doi:10.1016/j.jdeveco.2006.11.003.
Mckenzie, D. and Sasin, M.J. (2007). Migration, remittances, poverty, and human capital: Conceptual and empirical challenges. Washington D.C.: World Bank. (World Bank Policy Research Working Paper 4272).
Mendola, M. (2008). Migration and technological change in rural households: Complements or substitutes? Journal of Development Economics 85(1–2): 150– 175. doi:10.1016/j.jdeveco.2006.07.003.
Mora, J. and Taylor, J.E. (2006). Determinants of migration, destination, and sector choice: Disentangling individual, household, and community effects. In: Özden Ç. and Schiff, M. (eds.). International migration, remittances and the brain drain. Washington D.C.: World Bank and Palgrave Macmillan: 21–51.
Naude, W. (2010). The determinants of migration from sub-Saharan African countries.
Journal of African Economies 19(3): 330–356. doi:10.1093/jae/ejq004.
Olowa, O.W. and Awoyemi, T.T. (2012). Determinants of migration and remittances in rural Nigeria. Journal of Development and Agricultural Economics 4(7): 191– 198. doi:10.5897/JDAE11.053.
Rahmato, D. (2004). Searching for tenure security? The land system and new policy initiatives in Ethiopia. Addis Ababa: Forum for Social Studies (Discussion Paper 12).
Sabates-Wheeler, R., Sabates, R., and Castaldo, A. (2008). Tackling poverty-migration linkages: Evidence from Ghana and Egypt. Social Indicators Research 87(2): 307–328. doi:10.1007/s11205-007-9154-y.
Sindi, K. and Kirimi, L. (2006). A test of the new economics of labor migration hypothesis: Evidence from rural Kenya. Paper presented at the American Agricultural Economics Association Annual Meeting, Long Beach, CA, July 23–26, 2006.
Stark, O. (1991). The migration of labour. Cambridge, MA: Basil Blackwell, Inc. Stark, O. and Bloom, D.E. (1985). The new economics of labor migration. The
American Economic Review 75: 173–178.
Taylor, E.J. (1999). The new economics of labour migration and the role of remittances in the migration process. International Migration 37(1): 63–88. doi:10.1111/1468-2435.00066.
Taylor, J. and Martin, P. (2001). Human capital: Migration and rural population change. In: Rausser, G. and Gardner, B.(eds.). Handbook of agricultural economics, Vol.1A. New York: Elsevier Science: 458–503.
Tegegne, A.D., Penker, M., and Wurzinger, M. (2015). Participatory demographic scenarios addressing uncertainty and transformative change in Ethiopia.
Systemic Practice and Action Research 28(6): 1–20.
Todaro, M.P. (1969). A model of labor migration and urban unemployment in less developed countries. The American Economic Review 59: 138–148.
Tsegai, D. (2007). Migration as a household decision: What are the roles of income differences? Insights from the Volta basin of Ghana. The European Journal of Development Research 19(2): 305–326. doi:10.1080/09578810701289212. Zezza, A., Carletto, C., Davis, B., and Winters, P. (2011). Assessing the impact of