World Maritime University World Maritime University
The Maritime Commons: Digital Repository of the World Maritime
The Maritime Commons: Digital Repository of the World Maritime
University
University
World Maritime University Dissertations Dissertations
2000
Market consolidation in container shipping : implications to liner
Market consolidation in container shipping : implications to liner
agents, ports and container terminals, shippers, forwarders and
agents, ports and container terminals, shippers, forwarders and
regulators
regulators
Silvester M. Kututa WMU
Follow this and additional works at: https://commons.wmu.se/all_dissertations
Recommended Citation Recommended Citation
Kututa, Silvester M., "Market consolidation in container shipping : implications to liner agents, ports and container terminals, shippers, forwarders and regulators" (2000). World Maritime University Dissertations. 1108.
https://commons.wmu.se/all_dissertations/1108
WORLD MARITIME UNIVERSITY Malmö, Sweden
MARKET CONSOLIDATION IN CONTAINER
SHIPPING: IMPLICATIONS TO LINER AGENTS,
PORTS AND CONTAINER TERMINALS,
SHIPPERS, FORWARDERS, AND REGULATORS
By
Silvester M. Kututa, FICS Kenya (Republic of)
A dissertation submitted to the World Maritime University in partial fulfilment of the requirements for the award of the degree of
MASTER OF SCIENCE in
SHIPPING MANAGEMENT
2000
DECLARATION
I certify that all material in this dissertation that is not my own work has been identified, and that no material is included for which a degree has previously been conferred on me.
The contents of this dissertation reflect my own personal views, and are not necessarily endorsed by the University.
Silvester M. Kututa
8th October 2000
Supervised by:
Professor Tor Wergeland
Associate Professor, Shipping Management World Maritime University.
Assessor:
Professor Shuo Ma
Course Professor, Port and Shipping Management World Maritime University.
Co-assessor:
ACKNOWLEDGMENTS
Special thanks first and foremost to THE LORD JESUS CHRIST, my Lord and savior: He is the reason for all what I am.
I acknowledge with profound gratitude, the unwavering support of the two beautiful girls in my life- my wife Jessica for putting up with it…again, and my daughter Nia for arriving just in time to urge me on.
It would be impossible for me to mention the long list of lecturers, staff, classmates and friends who in one way or another made the completion of this dissertation, in its present form, possible. My deep appreciation to all of them especially to my supervisor professor Tor Wergeland for his time and valuable guidance, professor Shuo Ma, my course professor and all the professors of shipping management at the World Maritime University.
Special thanks to Christina Debusser and the Carl Duisberg Gesellschaft e.V. (CDG) in Cologne, Germany for their financial support which enabled me to travel, live and study comfortably in WMU- "Danke schon".
ABSTRACT
Title of Dissertation: Market consolidation in container shipping: Implications to liner agents, ports and container terminals, shippers, freight forwarders and the regulators
Degree: MSc
This dissertation is a study of the ongoing container market consolidation. The big carriers are getting bigger; in the process affecting not only other smaller carriers but also other shipping services like ports and container terminals, liner agents, shippers, freight forwarders and regulatory bodies.
This dissertation starts by examining the different ways in which container carriers have been consolidating their market shares and the motives driving carriers towards consolidation. With reference to recent mergers and acquisitions, these underlying motives are investigated and analysed. Possible implications to liner agents, shippers and freight forwarders, ports and container terminals, and the regulators are discussed. Recommendations are made to each of the above groups on how they can best address the threats and take full advantage of the opportunities arising as a result of decrease in the number of container carriers, and the corresponding growth in the size of big carriers.
TABLE OF CONTENTS
Declaration ii
Acknowledgments iii
Abstract iv
Table of Contents v
List of Tables viii
List of Figures ix
List of Abbreviations x
1.0 Introduction 1
1.1 Consolidation in other industries 1 1.2 Objectives of the study 2
1.3 Scope and limitations 3
2.0 Consolidation in container shipping industry 4
2.1 Ways of achieving market consolidation 4 2.1.1 Cross shareholding agreements 4 2.1.2 Take-overs or acquisitions 4
2.1.3 Mergers 5
2.1.4 Alliances 5
2.1.5 Organic growth 6
2.2Mergers and acquisitions as a measure of market consolidation 7 2.3Supply side developments 8 2.4Container terminals and container ownership 12
3.0 Consolidation forces 14
3.1Globalisation and the increase in the size of shippers 14 3.1.1 An example from Volkswagen 16
3.2The economic motive 17
3.2.1 Increase in proportion of fixed assets 17 3.2.2 Declining freight rates and profits margin 18 3.2.3 Cost minimisation and control 25
3.3Commercial advantages 26
3.4Operational & technical benefits 27
4.0 Impact of consolidation on liner agents 29
4.1Reasons for setting up own agency 30 4.2Case study: merger of P&O Containers with Nedlloyd Lines in 1997 33
4.3Case observations 34
4.4Threatening factors 35
4.5.3 Joint venture with the carrier 37 4.5.4 Sale of the agency to the carrier 37 4.5.5 Greater control of the cargo 37 4.5.6 Portfolio diversification 38 4.5.7 Mergers and alliances with other agencies 38
4.6Conclusions. 39
5.0 Impact of consolidation on ports and container terminals 40
5.1Implications to ports 40
5.1.1 Fewer direct ports and growth in transhipment concept 40 5.1.2 Preferential treatment 42 5.1.3 Dependence on a few bigger clients 43 5.1.4 Capital investment by ports 43 5.1.5 Increased port competition 44 5.1.6 The "knock on" or "cascade effect" 44 5.2Recommendations for ports and container terminals 45 5.2.1 Customer Relationship Management strategy 45
5.2.2 Port investment 46
5.2.3 Cargo generation 47
5.2.4 Port co-operation 47
5.3Conclusions 48
6.0 Impact of consolidation on the regulators and the labour market 49
6.1Government considerations 49 6.1.1 National employment / unemployment levels 49
6.1.2 Market dominance 50
6.1.3 Cargo control in the whole chain 50 6.1.4 Threat to indigenous transport businesses 50 6.1.5 Trade route subsidisation 51 6.1.6 Balance of payments 51
6.2The labour market 51
6.3Regulatory recommendations 54 6.3.1 The "invisible hand" 54 6.3.2 Minimal commercial regulation is necessary at times 56 6.3.3 Excessive regulation will discourage trade 57
6.4Conclusions 57
7.0 Impact of consolidation on shippers and freight forwarders 58
7.1Shippers 58
7.1.1 Freight rates developments 58
7.1.2 Shippers options 59
7.3Liner conference considerations 64 7.3.1 Conference stability versus carrier instability 64 7.3.2 Long-term shipping contracts 64
7.3.3 Conference charges and surcharges 65
7.3.4 Trade coverage 65
7.3.5 Increased transport efficiency and co-ordinated transport 66
7.4Forwarders 66
7.5Recommendations to shippers and freight forwarders 68
7.5.1 Shippers councils 68
7.5.2 Long-term shipping contracts 68 7.5.3 Value added functions for forwarders 69
7.6Conclusions 69
8.0 Conclusions 70
LIST OF TABLES
LIST OF FIGURES
Figure 2.1 Share of top 20 in 1996 as compared to 1999 10 Figure 3.1 German liner freight index graph- 1994 to 1999 20 Figure 4.1 MSC network of own worldwide agencies 29
Figure 4.2 Liner agency profitability curve 31
LIST OF ABBREVIATIONS
AMOCO American Oil Company.
ANL ANL Container lines Pty. ltd.
ANZDL Australia and New Zealand Direct Line.
APL American President Lines.
ARCO Atlantic Richfield Oil Company.
BAF Bunker Adjustment Factor.
BP British Petroleum.
CAF Currency Adjustment Factor.
CGM Compagnie Generale Maritime.
CMA Compagnie Maritime d'Affretement.
CMB-T Compagnie Maritime Belgie.
COSCO China Ocean Shipping Company.
CP Canadian Pacific lines.
CRM Customer Relationship Management.
CSAV Compania Sud Americana de Vapores.
CSX CSX World Terminals.
DPA Dubai Ports Authority.
DSR Deutsche Sereederei Rostock.
ELF Elf Aquitaine.
ESC The European Shippers Council.
EU The European Union.
FINA PETROFINA
FMC The Federal Maritime Commission.
FMG Flota Mercante Grancolombiana SA.
ICTSI International Container Terminal Services Inc
IKEA Ingvar Kamprad from Agunnaryd, Sweden.
IMO The International Maritime Organisation.
K Kawasaki Kisen Kaisha ltd.
M & A Mergers and Acquisitions.
MARICO Maritime Company of East Africa.
MISC Malaysian International Shipping Company.
MISE Maersk International Shipping Education.
MSC Mediterranean Shipping Company, Sa Geneva.
NOL Neptune Orient Line.
NPR Navieras de Puerto Rico.
NYK Nippon Yusen Kaisha.
OECD The Organisation for Economic Co operation and Development.
OOCL Orient Overseas Container line.
OTAL OT Africa line.
P&O P&O Steamship Navigation.
PSA Port of Singapore Authority.
RCL Regional Container lines Pte, ltd.
SAFDAL South African Marine and Deutsche Africa Linien.
SCL South African Marine Container Line.
TEU Twenty foot equivalent unit. Shipping container measuring 20 X
8 X 8 feet. The 40 feet container is 2 TEU’s.
TMM Transportacion Maritima Mexicana SA de CV.
UASC United Arab shipping company.
UK United Kingdom.
ULCC Ultra Large Crude Carrier.
UNCTAD United Nations Conference on Trade And Development.
US United States of America.
WTO The World Trade Organisation.
Chapter One
INTRODUCTION
1.1 Consolidation in other industries
In container shipping, consolidation has long been awaited because the supply side of the market has been too fragmented with many service providers, if compared to other related sectors.
For example, the oil industry has long been referred to as an olygopolistic market because of the few but big and global players. Yet the same industry is still reducing the number of players as can be seen from the selected recent mergers and acquisitions.
Table: 1.1
Recent mergers in the oil sector
Year Activity
1998 Merger between BP, Amoco and Arco to form BP Amoco Arco. 1999 Merger between TOTAL, FINA and ELF to form TOTAL FINA ELF.
1999 Merger between Exxon and Mobil to form Exxon Mobil.
Table 1.2
Market brand shares in the cruise industry-1999
Royal Caribbean Line 17% Celebrity (part of RCL) 6%
Carnival 20%
Princes 12%
Holland America 8%
NCL 10%
Other 27%
Total 100%
Source: Royal Caribbean Cruise lines (RCL).
Mergers and acquisitions therefore are not only happening in container shipping, but as a global business trend. The new world economy has forced companies to seek growth through co-operations, cross shareholding agreements, mergers and acquisitions in virtually all types of industries, as companies strategically position themselves for global challenges and global competition.
As a result, many industries are increasingly experiencing a shrinking number of players while "the big are getting even bigger". The process that has led to a reduction in the number of companies and the increase in share of the big companies is what has come to be dubbed "market consolidation".
1.2 Objectives of the study.
commercial regulation of the maritime industry. This dissertation is also written for the merging container carriers who have to explain to shippers, ports, agents and the regulators that consolidation is not necessarily harmful to them and the public.
While chapter one introduces consolidation as a global tend, chapter two analyses various ways in which the big container carriers have been increasing their market shares. It also looks at recent mergers and acquisitions to highlight the extent of consolidation in the industry. Chapter three investigates the various reasons, which have prompted container carriers to seek increased market share through mergers and acquisitions. Chapters four to seven are an investigation of the possible opportunities and threats -faced by liner agents, ports and terminals, regulators and the labour market, shippers and freight forwarders- because of consolidation. These chapters also use examples of recent mergers and acquisitions to suggest possible alternatives to threatened companies. Recommendations are given at the end of the specific chapters because they are different for each group.
1.3 Scope and limitations.
Chapter Two
CONSOLIDATION IN CONTAINER SHIPPING INDUSTRY
Consolidation implies a reduction in the number of direct competitors in an industry, and an increase in the market share of the big companies. According to UNCTAD’s "continued work on the elaboration of a model law or laws on restrictive business practices", consolidation in an industry could be achieved in different ways.
2.1 Ways of achieving market consolidation
With reference to recent activities, the most common ways of achieving consolidation in container shipping are as follows:
2.1.1 Cross shareholding agreements
Cross shareholding agreements is a situation where two companies in the same industry exchange shares. A good example in container shipping is the cross shareholding agreement made in January 1997 between Australia and New Zealand Direct Line (ANZDL) and the Union Shipping of New Zealand.
2.1.2 Take-over or acquisitions
the purchasing of Sealand by Maersk Line in July 1999. This acquisition formed the giant company of the container world, with an estimated 11% market share, and a containership armada with more than 265 vessels and a total of 590,0001 TEU capacity.
2.1.3 Mergers
A merger is a fusion of two or more companies to form one trading entity. The most famous of mergers in the container shipping history so far is the joining forces in January 1997, between P&O and Nedlloyd to form the Anglo-Dutch carrier now trading under the brand name "P&O Nedlloyd". Both P&O and Nedlloyd own 50% shares each in the new company.
2.1.4 Alliances
Alliances, being the co-operation between two or more companies for the purpose of this dissertation has been considered as one of the early processes towards market consolidation, but need not lead to consolidation per se. Although in alliances member lines co-operate in many areas like sharing containers, ships, terminals, etc, the respective member lines maintain their identity. For this reason alliances have shown to have an unstable nature, falling off or re-organizing very often. For example, 1998 started with the re-organization of alliances, but in April 2000, 3 members of the New World Alliance joined with Maersk-Sealand, leaving the other members in a very precarious situation in what was reported by Lloyd's list in their words:
"With so many slot charter and vessel-sharing agreements between transatlantic carriers, the reverberations will be considerable. But for the Grand Alliance and Americana Ships, the new deal is particularly embarrassing. " (Lloyd's List,
13.04.2000, p.7)
This emphasizes the volatility and uncertainty of alliance agreements in container shipping, disrupting sailing schedules and affecting customer service standards adversely. Some of the alliances have, however, been stable and ended in mergers or acquisition. A good example of such successful alliance agreements is the alliance between Maersk with Sealand and DSR-Senator with Hanjin shipping. For the above-mentioned reasons, alliances will therefore not be considered in this dissertation as market consolidation.
2.1.5 Organic growth
Some companies prefer to grow "organically" without any mergers and acquisitions. Happag Lloyd is on record as being one of these companies. “Mergers and acquisitions is not Happag Lloyd chairman Bernd Wrede’s cup of tea…” (Chorinou, November 2000, p.10)
This method of increasing market share and coverage, although taking care of possible company culture incompatibilities, is limited as to the speed of growth a container line can achieve in a fast changing world. Organic company growth takes time. No company is capable of growing organically to match the competitors who are growing by consolidation and cashing in on the market requirements in good time. Organic growth is therefore not discussed in this dissertation.
2.2 Mergers and acquisitions as a measure of market consolidation.
Consolidation in container shipping is evidenced in different ways, but the best indicator is by the number of mergers and acquisitions taking place within the industry, and the frequency with which they are happening. "Over the last couple of years, some 40 mergers and acquisitions have taken place with at least one taking place every 6 weeks". (Chorinou, Nov 1999 p.7)
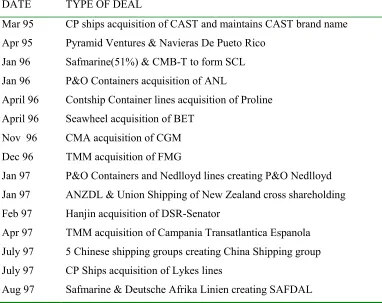
In a special report on the mergers and acquisition in the liner industry since 1995, Lloyds Shipping Economist published the following table:
Table 2.1
Liner shipping mergers and acquisitions since 1995
DATE TYPE OF DEAL
Mar 95 CP ships acquisition of CAST and maintains CAST brand name Apr 95 Pyramid Ventures & Navieras De Pueto Rico
Jan 96 Safmarine(51%) & CMB-T to form SCL Jan 96 P&O Containers acquisition of ANL
April 96 Contship Container lines acquisition of Proline April 96 Seawheel acquisition of BET
Nov 96 CMA acquisition of CGM Dec 96 TMM acquisition of FMG
Jan 97 P&O Containers and Nedlloyd lines creating P&O Nedlloyd Jan 97 ANZDL & Union Shipping of New Zealand cross shareholding Feb 97 Hanjin acquisition of DSR-Senator
Apr 97 TMM acquisition of Campania Transatlantica Espanola July 97 5 Chinese shipping groups creating China Shipping group July 97 CP Ships acquisition of Lykes lines
Aug 97 Petronas acquisition of controlling interest in MISC Aug 97 Holt acquisition of NPR inc.
Aug 97 Preussag acquisition of Hapag Lloyd
Oct 97 CP Ships acquisition of Contship Containerlines
Oct 97 MSC acquisition of 45% shares in Kenya National Shipping Line Nov 97 NOL Acquisition of APL
Feb 98 P&O acquisition of Blue Star ( Renamed Hansa Star) May98 CP Ships acquisition of Ivaran Lines
Jun 98 Hamburg Sud acquisition of South Seas Steamship July 98 Evergreen acquisition of Lloyd Triestino
July 98 Safmarine acquisition of CMB-T gaining 100% control of SCL Aug 98 Hamburg Sud acquisition of Allianca
Aug 98 CP Ships and TMM j/v
Aug 98 D'Amico acquisition of Italia di Navigazione Sept 98 Oldendorff acquisition of Hoegh lines Sept 98 CP Ships acquisition of ANZDL
Dec 98 Australian National Line acquisition by CGM Jan 99 Maersk acquisition of SCL
Mar 99 CSAV acquisition of Grupo Libra
Jun 99 Hamburg Sud acquisition of Transroll Routes July 99 Maersk Acquisition of Sealand
July 99 Hamburg Sud acquisition of South Pacific C.L July 99 Hamburg Sud acquisition of Crowley A.T Sept 99 Bollore acquisition of OTAL
Source: Lloyds Shipping Economist.
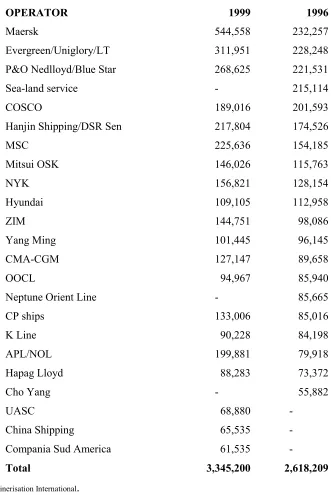
2.3 Supply side developments
period 1st September, 1996 to 1st September, 1999:
-Table 2.2
TEU Capacity development for Top 20 between 1996 and 1999
OPERATOR 1999 1996
Maersk 544,558 232,257
Evergreen/Uniglory/LT 311,951 228,248 P&O Nedlloyd/Blue Star 268,625 221,531
Sea-land service - 215,114
COSCO 189,016 201,593
Hanjin Shipping/DSR Sen 217,804 174,526
MSC 225,636 154,185
Mitsui OSK 146,026 115,763
NYK 156,821 128,154
Hyundai 109,105 112,958
ZIM 144,751 98,086
Yang Ming 101,445 96,145
CMA-CGM 127,147 89,658
OOCL 94,967 85,940
Neptune Orient Line - 85,665
CP ships 133,006 85,016
K Line 90,228 84,198
APL/NOL 199,881 79,918
Hapag Lloyd 88,283 73,372
Cho Yang - 55,882
UASC 68,880
-China Shipping 65,535
-Compania Sud America 61,535
-Total 3,345,200 2,618,209
Source: Containerisation International.
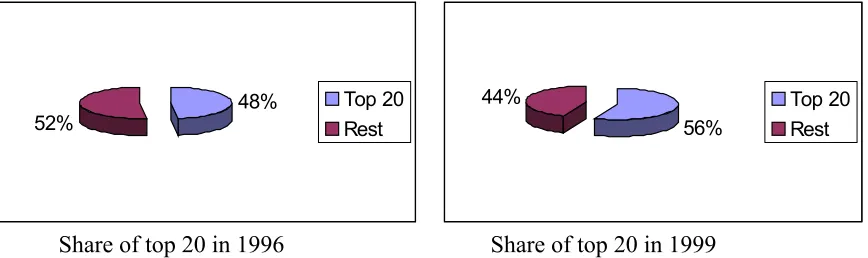
capacity of 2.6 million TEU's, equivalent to 48.10% of the world total employed slot capacity. The rest of the industry shared an estimated 2.8 million TEU's, which was equivalent to 52%. By the year 1999, the top 20 had a combined market share of an estimated 56%.
Share of top 20 in 1996 Share of top 20 in 1999 Figure 2.1 - Share of top 20 in 1996 as compared to 1999
Source: Containerisation International.
According to "Containerisation International" (Nov 1999, p. 43), the proportion of slot capacity operated by the largest 20 container carriers has continued to expand at the expense of other carriers, as the bigger lines increase their market and slot capacity shares. It is estimated that by the close of 2000, the top 20 will control more than 60% of the total world slot capacity
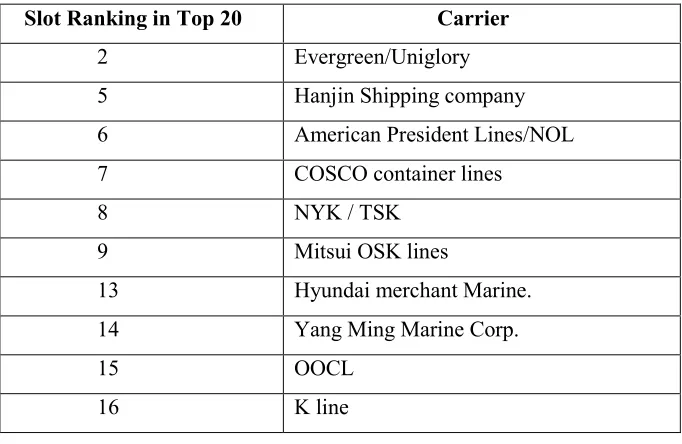
An interesting feature of this consolidation process is the way Asian carriers have been increasing their share of the container world slot capacity, at the expense of European and North American carriers. The acquisition of APL by NOL, DSR-Senator by Hanjin has strengthened Asia's participation of the container transportation business. Of the 18 top carriers in the 1999 list, 11 of them are based in Asia, illustrated in the following table.
48% 52%
Top 20
Rest 56%
44% Top 20
Table 2.3
Asian carriers in the world's top 20 list in 1999
Slot Ranking in Top 20 Carrier
2 Evergreen/Uniglory 5 Hanjin Shipping company 6 American President Lines/NOL 7 COSCO container lines
8 NYK / TSK
9 Mitsui OSK lines
13 Hyundai merchant Marine. 14 Yang Ming Marine Corp.
15 OOCL
16 K line
Source: Shipping Times.
In 1997, Asian carriers controlled about 70% of the Asia-Europe trade and more than 80% of the containerised United States-Asia trade (Shipping times, 17th November 1997).
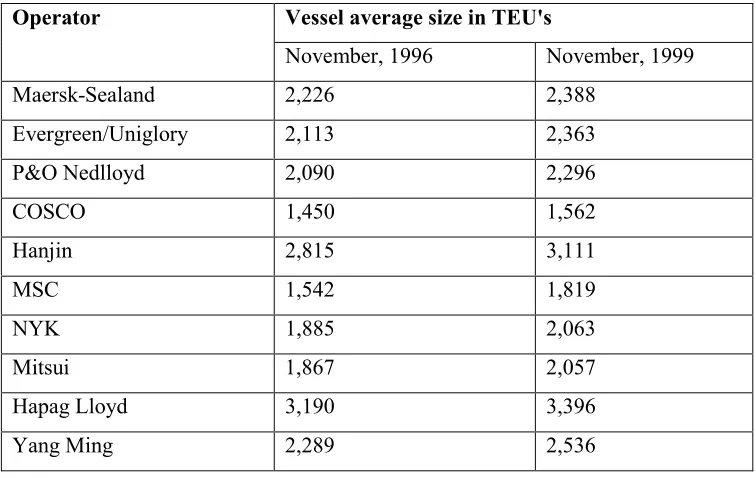
Table 2.4
Growth in average vessel size measured in TEU’s
Vessel average size in TEU's Operator
November, 1996 November, 1999 Maersk-Sealand 2,226 2,388
Evergreen/Uniglory 2,113 2,363
P&O Nedlloyd 2,090 2,296
COSCO 1,450 1,562
Hanjin 2,815 3,111
MSC 1,542 1,819
NYK 1,885 2,063
Mitsui 1,867 2,057
Hapag Lloyd 3,190 3,396
Yang Ming 2,289 2,536
Source: Containerisation International, Nov 97 & Nov 99
It can be seen from the above table that all the carriers have been replacing old tonnage with bigger new tonnage, which has increased the average operated vessel size. The increase in the size of container carriers, together with the alliance concept, has allowed carriers to seek economies of scale through employment of bigger and more efficient vessels. The average vessel capacity in TEU’s for the 10 selected carriers in figure 2.4 above shows a growth rate of about 11% between 1996 and 1999.
2.4 Container Terminals and Container ownership
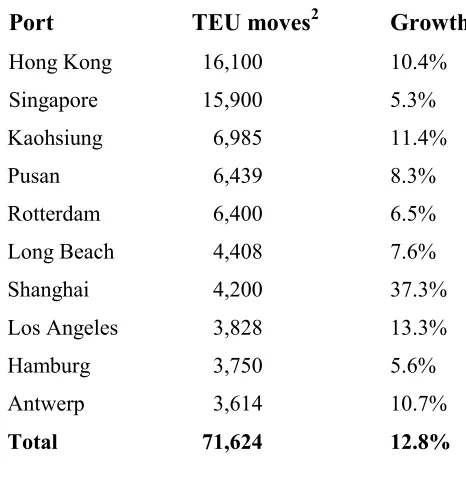
and volumes due to mergers and acquisitions. According to Maersk Sealand, the 10 largest port terminals accounted for 30% of the world's total throughput in 1999, and are also growing at a faster-than-average rate.
Table 2.5
Top 10 Ports Worldwide by throughput in 1999
Port TEU moves2 Growth Rate
Hong Kong 16,100 10.4% Singapore 15,900 5.3% Kaohsiung 6,985 11.4%
Pusan 6,439 8.3%
Rotterdam 6,400 6.5% Long Beach 4,408 7.6% Shanghai 4,200 37.3% Los Angeles 3,828 13.3%
Hamburg 3,750 5.6%
Antwerp 3,614 10.7%
Total 71,624 12.8%
Source: Maersk Sealand and Containerisation International yearbook 2000.
According to Maersk Sealand, while the annual growth rate of global port volumes grew by about 8.5 on average, the top 10 ports grew by about 12.8%. The big terminals are also increasing their market share of the world's volumes of containers handled per year.
Chapter Three
CONSOLIDATION FORCES
3.1 Globalisation and the growth in size of Shippers
The world has increasingly been referred to as a global village, although some product names like Coca-Cola have been global brands for many years. More shippers than ever before need a global service in line with their global operations. Carriers understand this very well, and are appealing to the shippers, marketing themselves as global carriers. The following advertisement slogans are an example of how carriers have been emphasis on a global service:
“We can not deliver to Mars yet, but our fast service covers the earth” (Mitsui OSK, from Containerisation International, August 1999, p.24).
“DSR-SENATOR, your global partner” (DSR Senator, from BIMCO review 1998, p.72).
name given to the practice where a shipper negotiates with one or more carriers on a one-to-one basis, for the use of the lines’ services in all global locations where the shipper ships to or from.
In a study published by "Containerisation International" (1999, June), big shippers were asked if “global contracting” had any effect on their decision making of which carrier to ship with. While only a minority 12% of the shippers did not think that global contracting was important in their selection of a carrier, 88% were keen to select a global carrier as their partner in shipping. Furthermore, 82% of the shippers were considering a reduction in the number of container carriers they were currently using. If the two results above are an indicator of shippers’ true preferences, then it would be likely that 88% of all the worlds container shipments will be moving by global carrier slots in the year 2000.
Global contracting gives the global shipper the relevant economies of scale in purchasing transport services. Global shippers therefore want to talk to carriers about all their cargo in order to secure freight rate discounts due to world wide volumes and to eliminate multi-carrier contracts, negotiations and documentation.
Empty containers can also be utilised better in a global carrier reducing empty repositioning costs immensely. The lines' imbalance can be reduced if the other lines are strong in the markets where the line is weak. This will reduce container-repositioning costs, which amounted to an estimated 5 billion dollars in 1998 (Drewry Shipping Consultants, 2000).
A good example is the coffee market. The leading coffee buyers would only negotiate with carriers on the East African coffee exports, if only the line will accept and guarantee a certain minimum shipload from Vietnam. Vietnam has a permanent shortage of empty containers while East Africa has a considerable surplus.
Even though a niche player may have a premium service in the East Africa to Europe service, it may not be operating in the Vietnam to Europe trade. This niche carrier will therefore miss bookings out of East Africa as a result. One trade route supports the others in container shipping. This is the advantage for big global carriers, and one reason why carriers have been striving to cover global markets through mergers and acquisitions.
Carriers' on their part have reluctantly embraced the lower-freight global contracting because of the stability of volumes, and the relative reduction in number of salesmen.
3.1.1 An example from Volkswagen:
Volkswagen, the German car manufacturer sources, produces and markets parts and vehicles around the globe. Shippers needs and requirements being the main market driving force, carriers have been seeking to satisfy the shippers’ need for a one stop shop for all the global shipping requirements.
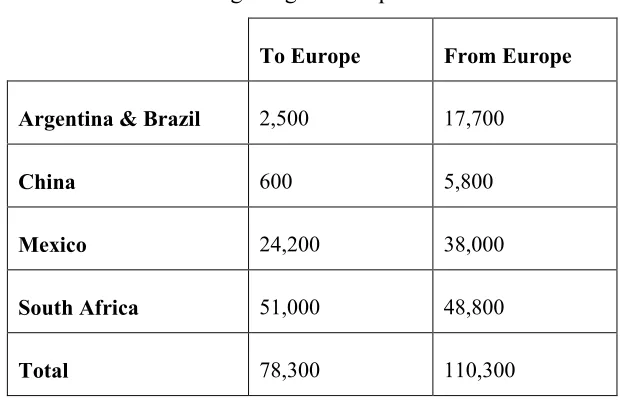
It makes economic sense for Volkswagen to negotiate a global contract with their shipping service provider. This will ensure that Volkswagen uses its volume economies (188,600 TEU's) to achieve better freight rates, which are not attainable, if the contracts were negotiated regionally or per each individual trade. The multi-trade shipper has therefore been demanding a “one stop shop” for their shipping requirements and needs.
Table 3.1
Volkswagen's global shipments in 1998.
To Europe From Europe
Argentina & Brazil 2,500 17,700
China 600 5,800
Mexico 24,200 38,000
South Africa 51,000 48,800
Total 78,300 110,300
Source: Containerisation International.
To take advantage of global contracting in an already very capital intensive industry, with oversupply, container carriers could only expand through mergers and acquisitions. Commenting about the merger of P&O Nedlloyd, the chief executive officer, Mr. Smith was quoted:
" Our container shipping business relies upon companies which are genuinely global, and in order to serve our clients, we are ready to follow the general trends of world trading" (Lloyd’s Shipping Economist, November 1999, p.8).
This clearly sums up globalisation of world trade as one of the reasons why carriers are expanding through strategic mergers and acquisitions as they position themselves to serve global clients.
3.2 Economic motive
3.2.1 Increase in the proportion of fixed assets
East-West markets cost increasingly more beyond the capability of most lines to provide a weekly service independently. “ A modern containership of the fifth generation may cost about USD 80 million a piece” (Ma, 1999c, p2). These ships may also be too big for an average carrier to economically utilise the slots, yet carriers must achieve the relevant economies of large scale in large efficient ships to remain competitive. The solution is either to enter an alliance, or to leverage the company through strategic mergers and acquisitions. Alliances pool their vessels and other resources by each line contributing a vessel enabling lines to venture into trades they otherwise would not have had the capability to, had they been required to provide a complement of containerships, terminals, equipment etc. Alliances however, have some serious disadvantages as already discussed.
In order to expand their market coverage, while avoiding the administrative bureaucracy of consulting different members, lines have found it better to expand by mergers and acquisitions.
3.2.2 Declining Freight rates and Profit margins
“Not surprisingly, industry profitability has also declined, with the Asian crisis making 1998 a particularly bad year, and on the main east-west trades Drewry estimates aggregate carrier losses at almost $2.4 billion - a negative margin of over 8%". (Drewry, 2000).
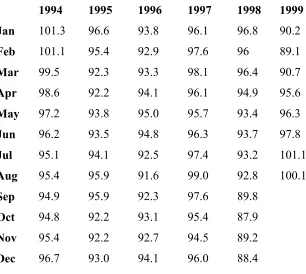
Table 3.2
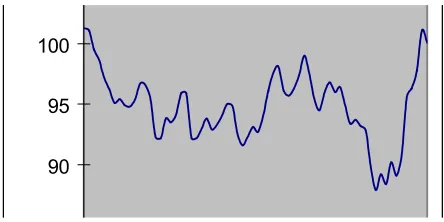
German Liner freight index 1994-1999 (1991=100)
1994 1995 1996 1997 1998 1999
Jan 101.3 96.6 93.8 96.1 96.8 90.2
Feb 101.1 95.4 92.9 97.6 96 89.1
Mar 99.5 92.3 93.3 98.1 96.4 90.7
Apr 98.6 92.2 94.1 96.1 94.9 95.6
May 97.2 93.8 95.0 95.7 93.4 96.3
Jun 96.2 93.5 94.8 96.3 93.7 97.8
Jul 95.1 94.1 92.5 97.4 93.2 101.1
Aug 95.4 95.9 91.6 99.0 92.8 100.1
Sep 94.9 95.9 92.3 97.6 89.8
Oct 94.8 92.2 93.1 95.4 87.9
Nov 95.4 92.2 92.7 94.5 89.2
Dec 96.7 93.0 94.1 96.0 88.4
Source: Institute of Shipping economics and Logistics.
Figure 3.1
German liner freight index graph-1994 to 1999
Source: Institute of Shipping economics and Logistics.
The index started at 101.3 points, in January 1994. As usual with the shipping industry, the freight rates fluctuated reaching a bottom 87.9 index points in October 1998.
We can therefore conclude that on the basis of the above data, in general, freight rates had a downward trend from 1994 through 1999, before starting to increase again in late 1999. The index averaged at 94.80441 over the 68 months period. We see a correlation in the mergers and acquisition activity during this period and a slight slow down of consolidation towards the end of 1999. This could be attributable to the anticipated increase in company profitability due to a recovering freight market, as shown in the graph.
Also for economic reasons, container carriers seek big sizes to hedge against turbulent freight rates fluctuations in this era of diminishing role of the shipping conference. In the same way that olygopolistic markets like the oil majors have some measure of price and service control, container carriers hope to gain some control on the market as they seek bigger sizes and lesser players.
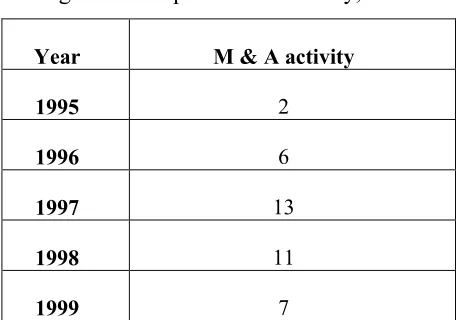
According to chapter two figure 2.1, the mergers and acquisition activity can be summarised as follows for each year:
Table 3.3
Mergers and acquisitions summary, 1995-1999
Year M & A activity
1995 2
1996 6
1997 13
1998 11
1999 7
There was a very sharp increase in mergers and acquisitions in container shipping after 1995. The climax was reached in 1997, which according to "Lloyds’ Shipping Economist" there was a total of 13. The mergers & acquisition activity started to decline slightly reaching 7 in 1999. An interesting point to note is that these 7 mergers and acquisitions happened between January and September, when the freight rates were still on a downward trend as shown in the Institute of Shipping Economics and Logistics statistics.
expected decline in profitability. The decline in freight rates therefore is logically expected to lag behind the consolidation process.
The decline in freight rates during the above period (figure 3.1) was partially caused by overcapacity in container shipping (supply of slots), which led to an increase in competition and also due to the slowing down of world economic growth -especially the Asian crisis. Because of the scope of this dissertation, the underlying causes of low freight rates will only be mentioned as above but will not be discussed further in detail.
As profitability for mainly western shipping lines nose-dived, their stock market performance dropped. There was pressure to increase shareholder value. One of the casualties was Sea-Land, as was summed up by "Lloyds ship manager"; "CSX needed to sell Sealand one way or another to enhance shareholders value". (Lloyds Shipping Economist, November 1999, p.8)
With freight rates continuously declining, while the UNCTAD liner code failed to secure a 40% cargo share for national shipping lines, many governments ceased the opportunity to sell their loss-making national shipping lines. Examples of such lines are Lloyd Triestino, Lykes, Safmarine, Cameroon National Shipping line, Kenya National Shipping line, just to name a few. In fact the only remaining fully national owned shipping line in Africa is the Ethiopian Shipping Line (ESL).
Table 3.4
German liner freight3 rate index by selected trade routes (1995=100)
Period Europe N-America Asia
Jan-98 95.90 108.70 88.00 Feb 95.80 108.50 86.40 March 95.70 108.70 86.90 April 95.10 106.80 86.20 May 94.80 104.00 80.70 June 94.80 104.70 79.30 Jul 94.70 102.50 76.40 Aug 94.60 102.00 73.80 Sept 94.50 97.30 67.30
Oct 94.40 93.80 65.30
Nov 94.40 95.70 65.20
Dec 94.30 95.10 62.70
Jan-99 91.30 88.70 62.90
Feb 91.30 91.00 64.50
March 91.20 92.10 66.30 April 90.60 93.30 70.60
May 90.60 94.70 70.40
June 90.60 96.40 71.50
Jul 91.10 96.60 74.20
Aug 91.10 95.10 78.80
Sept 91.00 101.80 79.70 Oct 92.20 104.70 80.30
Trade average 93.18 99.19 74.43
Source: Institute of Shipping Economics and Logistics
3
From the above indices, it is reasonable to say that different trade routes have different freight rate volatility.
The European trade had an average of 93.18 points and fluctuated from the highest 95.9 points in January 1998 to the lowest 90.6 points in March, April and May 1999. The range over that period was 5.3 points.
The North America trade started at 108.7 points in January 1998, had an average of 99.19 points during the whole period (January 1998-October 1999), and fluctuated from the highest 108.7 points in January to 88.7 points in January 1999. The range over the whole period was 20 index points.
The Asian trade on the other hand started at 88 points in January 1998 had an average of 74.43 points during the whole period and fluctuated from the highest 88 points in January 1998 to the lowest 62.7 points recorded in December 1998. The range over the whole period was 15.2 index points, which is clearly higher than the previous 2 trade routes.
From these range figures, the volatility of the North American and Asian trade can clearly be seen. As compared to the European trade, North America was about 4 times volatile while Asia was 3 times more volatile in this period.
3.2.3 Cost Minimisation and Control
Cost minimisation and control is another reason why container carriers have been seeking mergers and acquisitions. Declining freight rates have forced carriers to take a closer look at their costs for survival. Economies of scale can be achieved in purchasing bunkers, port terminals, trucking companies, ships and container repairs, provisions, agencies etc. Synergies in these cost areas can be achieved if the operations of two companies are merged. While administrative costs form a small proportion of the total costs of a liner company estimated at 4.4% (Alderton, 1984, p.136), huge cost savings are possible through synergies. As an example, lines may merge to eliminate duplication and save on administrative costs. These unit costs have an effect on the competitiveness of a line. The costs can be reduced by increasing cargo volumes, while keeping staff levels fairly constant. By joining together the two companies, P&O and Neddloyd reportedly yielded an estimated cost saving of US$ 100 per TEU from the duplicated administrative services.
Considering the following selected statistics (Lloyds List, 06.11.1999, P.3) for mainline operators, US$ 100 cost savings can make the difference between profits and losses.
Table 3.5
Net estimated profits4 for selected carriers- 1999
Operator Net Profit/TEU
MSC $ 94.00
CP/Americana $ 65.00 Maersk Sealand $ 22.00
Source: Lloyds List, 06.11.99.
Economies of scale in purchasing or even setting up own container terminals, bunkering facilities and container-manufacturing plant can also be achieved if the volume of traffic so warrants.
Many alliance members have practised purchasing own facilities on the strength of a collective alliance-anticipated-demand. Any investment by a particular line based on this kind of demand can be very detrimental to a specific line if the demand fails to materialise, or worse still if the alliance breaks up.
Investments in ships, terminals etc are fixed assets which once purchased they need to achieve the relevant economies of scale and stable optimum utilisation to pay back in time. The stability required of such investments is lacking within the alliance, which has been termed by some as a “loose marriage”. Filling the ships and utilising capacities optimally in the long- term will require the kind of stability and cargo growth only achievable by accelerated company growth.
3.3 Commercial advantages
“To combine the marketing strength of each company and to complement each other in the trade” - (Containerisation International, September 1996).
Marketing and sales is another reason why some lines have sought mergers and acquisitions. No line is strong in all the markets, and their penetration is different in different markets. Container imbalances therefore happen.
A good example here is the merger between P&O Containers and Nedlloyd lines in January 1997. While P&O had a strong market share in Japan, Australia and the US markets, Nedlloyd lines was strong in Latin America. By merging, the two companies into one, they hoped to enjoy improved load factors on their vessels in all routes.
If shippers are getting bigger and bigger, the carriers also should seek accelerated growth to match the bargaining power of their shippers. Small niche players may be negotiating from a very weak position if approached by a global shipper like Volkswagen, Michelin, etc.
3.4 Operational & Technical benefits
Bigger companies, as mentioned above, provide an opportunity for employing bigger cost-effective ships at a high cargo space utilisation ratio. Adjustments to space utilisation are better in an alliance than in an independent line, unless the line is a mega-carrier. Operational flexibility is another advantage of a global carrier. For example, should one container vessel break down, a mega-carrier with many vessels in position would be more flexible in terms of obtaining a replacement from the existing fleet, as opposed to a niche or regional player with few vessels.
shipping line's ability to provide swift alternatives in case of unfortunate events (Christiansen, 2000).
Chapter Four
THE IMPACT OF CONSOLIDATION ON LINER AGENTS
The traditional role of the agent was (in summary), to represent the ship owner in the port where the ship owner did not have his own offices. This role has changed considerably over the years, but still remains more or less the same for the tramp agent. The liner shipping agency has, however, gone through some metamorphosis. Many of the emerging global container lines have adopted a policy of setting up their "own agencies" in ports where the traffic can allow.
The following figure and quote from a global carrier serve to illustrate the strategic importance by which global container carriers perceive the issue.
Figure 4.1
“In order to improve and control the quality of its various operations, MSC has established its own agencies all over the world run by an extremely dedicated and professional staff.” (Mediterranean Shipping Company S.A, Geneva, 2000).
4.1 Reasons for setting up own agency
The decision on whether or when to set up own liner agency at a local port or region is a cost-benefit issue. It is a function of the cargo volume, the freight commission and quality of service being produced by the local agent.
Liner agents are usually paid a commission, a percentage of the gross freight per TEU or on a lumpsum basis per container. These commissions usually do not depend on the volume of the cargo generated or handled at the jurisdiction enumerated in the agency agreement. In other words, the agency commission remains the same per container regardless of the volume handled.
A small volume of cargo shipped per month may not be sufficient to sustain an agent. Usually a liner agent has several principals, whom he acts for. Most lines however, insist that there should not be any conflict of interest between themselves and any other shipping line served by the same agent.
Explained graphically:
-Revenues
Agency profitability
0 Cargo Volume in TEU's 100
Figure 4.2
The liner agency profitability curve
There is a certain critical cargo volume, below which the agent will not be covering his overheads. For the purposes of simplicity, this is assumed to be 100 TEU’s in figure 4.2 above. Before the critical quantity of 100 TEU’s is reached, the agent will operate at a loss.
Assuming that the line starts small, the line is comfortable paying the agency commission. This way it avoids investments in overheads such as office rent, administration etc. To set up own agency will be an inefficient use of resources, and the cost per TEU will most likely exceed the cost per TEU payable to the agent. This is because the agent has economies of scale by consolidating the cargo from different lines and principals. As the volume of cargo handled increases over time, the critical point is reached, where the agent will start to earn some profits.
the lines will want to review their analysis to see at what output level the economics will justify setting up their own agency.
Revenue/Costs per TEU.
50 AC1
AC2
0 100 Output in TEU's Per Month.
Figure 4.3
The economic decision process for setting up own agent at a port
An assumption is made that agency commission is agreed at US$ 50 per TEU on a lumpsum basis, i.e. regardless of the freight rate level.
AC1 is the shipping lines fixed cost when agency services are outsourced. It is also equivalent to the agents’ revenue per TEU.
AC2 is the carriers average cost curve when agency services are not outsourced, i.e. when operating its own agency at that port.
The average cost curve is therefore a normal one, declining from left to right because of economies of scales.
If the line maintains the agent, the average cost is still the same with different outputs at USD 50 per TEU (unless the line successfully negotiates a lower commission which will shift the curve downwards). From the above graph, it is therefore clear that it will make economic sense for the shipping line to set up its own agency at that port once the critical throughput reaches 100 TEU's per month. In real sense, the carrier may set up the agency before reaching the critical economic point mentioned above for other reasons such as:
Gaining control of the decision making and the operations of the agency.
Ensuring loyalty for the line and avoiding a possible conflict of interest with other lines.
This example, although based on theoretical explanation (because of lack of relevant specific data) serves to highlight the shipping lines economic decision making criteria on whether to set up own agencies and when to do so. Container lines could however, use this model using their in-house data and information to determine at what level the line will need to set up its own agency at a specific port.
Since it is clear that the decision depends on the output level, and the output level through a port is influenced by company growth, the impact of market consolidation on liner agents can be seen clearly in the following case study.
4.2 Case study: the merger of P&O containers and Nedlloyd lines in 1997
which was a private agent, represented Nedlloyd. Both agents had other principals they were also serving.
P&O Nedlloyd had acquired the full ownership of Mackenzie Maritime during the same year. After the merger of the two lines, the decision was made in favour of Mackenzie Maritime, obviously because of P&O’s share ownership at Mackenzie Maritime. Wigglesworth was forced to close down its shipping division because the remaining principals (Jadroplov line being one of them) were not big enough to sustain the agency.
While P&O Nedlloyd was busy settling down in Mackenzie Maritime, the other principals served by Mackenzie Maritime (Mitsui OSK being one of them) started feeling uncomfortable being served by their competitor as their agent. They started looking for another agent, but it was Mackenzie Maritime who came up with an alternative solution. They started another agency in the name of Maritime Company of East Africa (MARICO) which became the new agent for both Mitsui OSK and Jadroplov.
However, it took about 2 years before the two lines in MARICO realised that they were still being served by their competitor and moved to Inchcape Shipping Services. MARICO was closed down in 1999.
4.3 Case observations
From the above case study, the following observations can be made;
As the two container lines merge their operations into one of the two agencies, the volume of business for the agent will grow geometrically. This is good news for the agent but:
If the container line does not own the agent, the volume of business will most likely be at new levels (critical level discussed above), which warrant the line to set up its own agency. The result is that the line will demand, from a very strong position, for ownership or part ownership of the agency. Should the agent decline, the container line will most likely set up its own agency offices to the disadvantage of the liner agent.
Conflict of interest within an independent liner agent increases with the growth in the carrier's size. As the carriers grow and expand to new routes, there are more chances that their once different markets will overlap. One of the lines will have to look for new representation.
4.4 Threatening factors
From the above description of developments in the liner agency sector, the following could be the summary of threats to the liner agent as a result of emerging bigger carriers:
Growth in the size of carriers has encouraged carriers to set up their own agencies at the expense of the local independent agent.
4.5 Recommendations for the local independent agent
In view of the impending threat by the emerging global carriers taking over the role of the local agent, the agent needs to adopt a Customer Relationship Management (CRM) strategy when dealing with its principals. Some of the following suggestions may be the way forward for a threatened local agent, depending on their individual situations:
4.5.1 Negotiating a division of tasks
The carriers are more concerned with the cargo control function. They give this as one of the main reasons for wanting to operate own agency. The agent could negotiate with the carrier for a division of tasks so that the carrier is in control of marketing and sales (front office), while the agent maintains back room and operational (loading, discharging, vessel handling etc) and documentation functions. In this way, the agent will avoid being rendered redundant.
4.5.2 A reduction in the agency fee
4.5.3 Joint ventures with the carrier
Another alternative is to offer the carrier a joint venture option where the line and the agent will be co-owners in the agency business. In this way, the agent will tie down the carrier, giving the carrier a disincentive to move away. Many carriers will be happy to maintain the agent's expertise and have a share of the profits. Care should however, be taken when exercising this option because if there are other carriers represented by the same agent, these other carriers may opt to move away once the dominating carrier acquires the joint ownership of the agency.
4.5.4 Sale of the agency to the carrier
Depending on the situation, the agent may achieve a win-win situation by selling the agency to the carrier. In some cases, the agent may go bankrupt for lack of business if the line leaves the agency. To avoid a decline in company value after the line leaves, the agent may sell the company to the carrier. Some carriers will be happy to strike this deal because they also get to maintain some degree of cargo stability, which is important to them.
4.5.5 Greater control of the cargo
4.5.6 Portfolio diversification
"… firms will have to offer a greater menu of quality services to survive and prosper. This will require larger firms capable of providing services which owners and charterers' cannot duplicate economically." (Braam, 2000).
The agent is no longer in the business of shipping, but rather he is adding value in supply chain functions. Investments in tramp agency, clearing and forwarding, warehousing, logistics etc, as mentioned above, could raise the barrier for the carriers by controlling a bigger part of the chain, and also supporting the shareholders value in case the agent loses the carrier's agency representation business.
4.5.7 Mergers and alliances with other agencies
Strong agencies will survive. The strength of an agent is the amount of cargo the agent controls. The strong agent is more likely to secure new business should a global carrier leave its agency services to set up its own. The small local agents should look for possibilities of merging to form bigger entities, as long as this is possible (conflict of interest among competing lines may not allow this at times). An alternative is to merge the two agencies' back-room operations, which has been the most popular strategy so far. To quote Fairplay online,
“The number of independent agents is dwindling. To stay in business, they are not only merging their back room activities, with colleagues but also extending their activities to logistics-chain operations”(Fairplay, 2000).
4.6 Conclusion
The liner agency market has been shrinking and as long as consolidation continues, it will continue to do so.
Global shipping agencies have also emerged. Names like Inchcape Shipping Services and Barwill agencies are now truly global. On the other hand there are agents who have taken the alliance path and formed a global alliance of agencies such as Multiport Ship agencies network- another global name. In these alliances agents from the different parts of the world support each other with marketing and information about shipping lines intending to start new services in certain ports.
Chapter Five.
THE IMPACT OF CONSOLIDATION ON PORTS AND
CONTAINER TERMINALS
As container lines grow bigger through mergers and acquisitions, they are employing bigger ships due to the corresponding growth in cargo volumes. This is because as the cargo volumes grow because of the amalgamated cargo for the two merging lines, there is an optimum number of strings a line can employ on a particular route. Beyond this optimum point, any addition in strings will not be economically justifiable, and it may be better to employ bigger ships instead of increasing the port calls. The size of ships employed in a particular string will usually be a function of the line's economies of scale on one side and the shippers needs on the other hand. Still, larger volumes of cargo per week have to be shipped across continents, and this requirement calls for increased ship sizes to match the demand.
5.1 Implications to ports
The growing size of container carriers and the reduction in the number will impact ports and terminals in many different ways.
5.1.1 Fewer direct ports and growth of the transhipment concept
achieve higher economies of scale with fewer port calls rather than with many port calls. On the other hand they rely on the transhipment concept.
Since ships earn revenue only when they are sailing, the growth in the size of ships has led to fewer main ports for the big ships, and an increase in transhipment. This situation has led to a classification of ports into layers depending on the vessels calling at these ports (Hoffman, 1999). As vessel size increases, the number of ports called by these mother ships will continue to decrease.
The number of ports called per "mother vessel" per voyage will continue to decline as long as the cost savings generated by the mother ship are higher than the cost of feedering and other associated costs. A 15,000 TEU containership is envisaged to call at only 6 main ports in the world; one on East Coast of North America, one on the west coast, one in Europe, one in the middle-east/Asia and one in far-east/south-east pacific.
The growth of the transhipment/feeder concepts, the corresponding investment in hub ports concept, etc, have made it possible for the big mother ships to call at hub ports and to use smaller ships to tranship containers to smaller ports. With the growth of companies and ships, there is likely to be a negative impact on most ports and a positive impact on a few ports worldwide. The number of containers handled in most ports will increase due to transhipment options. Transhipment ports like Algeciras, Malta, etc have thus emerged and will continue to grow and increase for the foreseeable future. Other traditional ports are also benefiting because no port today can claim to be handling only imports and export business.
Figure 5.1
Possible future scenario of multi-layered port calls
Source: Jan Hoffman, 2000.
5.1.2 Preferential treatment
business it generates for the port. This places the port in a reduced bargaining position vis-à-vis the carrier.
5.1.3 Dependence on a few bigger clients
Market consolidation implies the market being concentrated to a few big carriers. Ports will compete fiercely for the few big clients. “If one line decides to change terminals or leave the port, the effect can be disastrous” (Ishii, 1999).
An example is the port of Algeciras which although operated by Maersk Sealand, all the 1,117,000 TEU’s port throughput for the year 1998 was combined Maersk and Sealand traffic. It is estimated that the port of Singapore will loose a staggering 10% (1.8 Million TEU's) volume of business on October 1st, as a result of Maersk Sealands decision to change main-haul service calls from Singapore to the port of Tanjung Pelepas (Lloyds List, 11.08.2000, p.1).
Because of their business volume, container lines will be expecting ports to treat them in a special way as mentioned in point 2 above.
5.1.4 Capital investment by ports
The new investment requirements have hastened the process of port privatisation. With a small exception like the Port of Singapore Authority (PSA), most government-owned ports and terminals have a reputation of slow adaptability to customer needs and changes in the market place. They may not be able to keep up with the required investments to increase port productivity for the discharging and loading of container ships. Privatisation is the likely option.
5.1.5 Increased port competition
Because of the value of one container line calling at a particular port, the port will be under enormous pressure to keep the client. Ports will not only be competing against each other, but also against the new container carriers, which have increasingly been setting up own terminals around the world.
Bottlenecks like port reluctance to invest in the required facilities will prompt container carriers themselves to invest in the equipment by setting up own terminals for example, to the disadvantage of the local port.
As bigger and bigger ships are employed in each trade, carriers will be faced with a decision on what port to choose as a main port, and which ones to relegate to feeder ports. This could come sooner than expected because there is already talk about 8,000 (although unofficially, container ships may have already surpassed this size) and 12,000 TEU ships. According to Mr. Tsien of Hutchinson ports holdings, “the 15,000 TEU ship may not be far away” (Tsien, 1999).
5.1.6 The “knock-on” or "cascade" effect
the bigger size vessels. For example, the biggest container ships are usually deployed in the Europe–Asia trades. At the times when the panamax ships were the biggest container ships in service, most were deployed on this route. Then came the post panamax containerships, which were deployed on the Asia-Europe trade relegating the panamax ships to the trans Pacific trades. The "knock-on" or "cascade" effect is the relegation to feeder or other routes of ships due to deployment of bigger ones on the main line trades.
Even where ports have forecasted growth in container ship size based on trade cargo growth, the bigger ships may be deployed in these ports earlier than expected because of the knock-on effect.
5.2 Recommendations for ports and container terminals
Ports and container terminals must ensure that they remain competitive in the wake of bigger ships and stronger, influential container carriers. The following recommendations may be useful to the ports wishing to stay ahead of the competition.
5.2.1 Customer Relationship Management strategy
share ownership), binding them to the port services. Care must however, be exercised when offering a carrier share ownership because this action may discourage other carriers from calling at that particular terminal. The benefits of securing one carrier have to be weighed against the potential loss of other carriers.
5.2.2 Port investment
Any carrier's decision to use a port as a main or feeder port very much depends on the facilities available, among other factors. The ports of Hamburg and Rotterdam have already invested in receiving "super post-panamax" container ships (about 8,500 TEU’s). They will be the first ports to be contacted by carriers when such big ships finally enter service. The changing requirements will need a dynamic port willing to invest in providing the carriers with the necessary facilities.
Care should, however, be exercised when choosing which projects to invest in, especially with bigger containership facilities. A 12,000 TEU ship will most likely call at only one Northwest Continent port within the Hamburg- Le Havre range (Hoffman, 1999). If 2 or 3 ports invest in such facilities, some of these ports are likely to suffer redundancy and underutilisation of the expensive resources.
The question of how big container ships can get should feature prominently in the port planners’ mind. The "ULCC effect" is a constant reminder of the fact that although there are economies of scale in ship size, diseconomies of scale do set in after a certain optimum size is attained.
5.2.3 Cargo generation
The traditional port was run as an operational facility, without much advertising and marketing. It sold itself. The reasoning was that “ship follows port, and cargo will follow ship”. Some ports have changed to a more commercial orientation while some are still relying on a “captive hinterland” concept (Francou, 1999). Today, ships follow cargo. An example of such a port is Dubai Ports Authority.
“Due to Dubai's traditional trade links with its neighbours, shippers are keen to capitalise on Dubai's proven distribution capabilities”. (Dubai Ports Authority, 2000).
Because of the distribution and manufacturing functions of Dubai, it will be very hard even with modern competing facilities like Salalah for the port of Dubai to be served as a feeder port. It is important for the port to market and generate cargo for ships calling at the port to attract bigger ships. Bigger ships generate more revenue for the port because port charges in most ports are usually based on a ship's size.
Ideas like cargo centres, distribution centres, export processing and tax free zones, hinterland development etc; are worthy projects for a port to pursue in order to increase its container traffic and port competitiveness. Value added functions would be expected of ports. In other words, “Ports will change from the port industry to the transport industry” (Beth, 1999).
5.2.4 Port co-operation
An example is the new co-operation between the port of Copenhagen and the port of Malmö. Specialisation, based on the law of comparative advantage will mean that the port of Malmö can specialise in bulk and general cargo while the port of Copenhagen specialises in containers and the passenger/cruise business.
Although port co-operation and specialisation has its disadvantages (Ma, 2000), the specialisation will ensure that the two ports do not compete for the same services, and therefore do not duplicate resources. They can now focus on investing the very best technology in the particular area of specialisation.
5.3 Conclusions
Competition in ports is increasing due to market consolidation among container carriers. It is easier for container lines today to change ports of call than ever before, because of improved road and rail networks, which have expanded each port’s shared hinterland. This competition is based on their geographical advantage, their vessel and cargo handling costs and the amount of cargo the port can generate per sailing.
Chapter Six
THE IMPACT OF CONSOLIDATION ON REGULATORS AND
THE LABOUR MARKET
6.1 Government considerations.
Fewer and bigger container carriers will have an impact on a government's regulations and their competition policy. Governments as well as employees and labour unions need to be aware of how market consolidation in container shipping will impact on them. This paper will only address the issues of commercial regulation and avoid other types of regulation, which are not directly relevant to the dissertation. The following reasons explain why governments may be interested in how consolidation develops in any market.
6.1.1 National employment / Unemployment levels
6.1.2 Market dominance
Consolidation leads to bigger liner companies. These bigger companies affect the way business is done in the liner shipping market. They also compete from a very strong point of view with designated national shipping lines. Mr. Vieljeux, the president of the CMA-CGM group was quoted as saying that “Nobody takes competition from Maersk line lightly these days…"(Containerisation International, Nov 1999).
Bigger companies always push for special treatment, e.g. own terminal facilities, etc. This may be at the expense of small locally operated niche container carriers, freight forwarders and other local companies.
6.1.3 Cargo control in the whole chain
The global mega-carriers of today's market place have direct control of the cargo from shipper to receiver, door-to-door (and more recently, factory-to-shop). The regulators are faced with a problem of trying to ensure that cross subsidisation of the different legs of the whole transport system is not practised by the carriers at the expense of other competing unimodal transport companies.
6.1.4 Threat to indigenous transport businesses
The new global mega carriers are increasingly competing with relatively weaker local clearing and forwarding companies, truckers, railway companies, terminals etc. The asset-rich container lines, controlling the flow of the cargo, are likely to push many local players out of the market, killing indigenous enterprises.
6.1.5 Trade route subsidisation
Because of their diverse market coverage, global carriers are able to subsidise the trade route/land transport with earnings from other routes. They can therefore charge for some legs below what the local operator can compete. This practice may be utilised in the short run to throw local companies out of the market, and later assuming a monopoly position.
6.1.6 Balance of payments
Global carriers are multinational organisations, which have the globe as their market place, but still maintain head offices in a certain country. Capital flight in the form of profit repatriation can be a source of regulatory concern to reduce the country’s capital account deficit, especially in developing countries. The UNCTAD liner code (1974) was partly based on this argument (UNCTAD, 1974).
6.2 The labour market
Market consolidation is about economies of scale. The merging of two companies into one involves synergies and efficient use of resources. It involves administrative savings too among other types of savings. Some employees are laid off as the two companies merge their operations into one entity.
In order to have a sizeable control of the local offices by the owners; expatriates are more likely to increase in the new liner agency. This replaces local labour with foreign labour. The number of expatriates working in developing countries where unemployment is also high has increased due to consolidation in the container industry.
On the other hand, because the cost of labour in developed countries' has been increasing steeply, shipping companies have been increasingly turning to developing countries for manpower, especially crewing needs. Less developed countries will stand to benefit in this area if they are able to train and export quality labour.
Bigger and bigger container lines require high employee training and competence. As the organisation grows bigger and bigger, handling new complex operations like logistics and supply chain management, the battle of the brains becomes the deciding factor and very stiff both within the organisation and in competition with other lines. The innovative container line is the one most likely to succeed in the particular route/market.
As the company consolidates the two operations into one, the volume of cargo creates a demand for a dedicated container terminal, own clearing and forwarding company, and a fleet of trucks/trains. The impact to the labour market will be positive as new jobs are created within the container line in these new land investments.