A network science‑based
k
‑means
++
clustering method for power systems network
equivalence
Dhruv Sharma
1*, Krishnaiya Thulasiraman
2, Di Wu
3and John N. Jiang
1Abstract
Network equivalence is a technique useful for many areas including power systems. In many power system analyses, generation shift factor (GSF)-based bus clustering meth-ods have been widely used to reduce the complexity of the equivalencing problem. GSF captures power flow on a line when power is injected at a node using bus to bus electrical distance. A more appropriate measure is the one which captures what may be called the electrical line distance with respect to a bus termed as relative bus to line distance. With increase in power transactions across different regions, the use of rela-tive bus to line distance becomes appropriate for many analyses. Inspired by the recent trends in network science on the study of network dynamics based on the topological characteristics of a network, in this paper, we present a bus clustering method based on average electrical distance (AED). AED is independent of changes in location of slack bus and is based on the concept of electrical distance introduced in the context of molecular chemistry and pursued later for applications in social and complex net-works. AED represents the AED from a bus to buses of the transmission line of interest. We first propose an AED-based method to group the buses into clusters for power systems network equivalence using k-means clustering algorithm integrated with silhouette analysis. One limitation of this method is that despite its speed, sometimes it may yield clusters of inferior quality compared to the optimal solution. To overcome this limitation, we next present our improved clustering method which incorporates a seeding technique that initializes centroids probabilistically. We also incorporate a technique in our method to find the number of clusters, k, to be given as input to our clustering algorithm. The resulting algorithm called AED-based k-means++ cluster-ing method yields a clustercluster-ing that is O(logk) competitive. Our network equivalence technique is next described. Finally, the efficacy of our new equivalencing technique is demonstrated by evaluating its performance on the IEEE 300-bus system and compar-ing that to the performance of our AED-based method (Sharma et al. in Power network equivalents: a network science-based k-means clustering method integrated with sil-houette analysis. In: Complex networks and their application VI, Lyon, France. p. 78–89, 2017) and the existing GSF-based method.
Keywords: Average electrical distance, Power systems network equivalence, Generation shift factor, k-means++ algorithm
Open Access
© The Author(s) 2019. This article is distributed under the terms of the Creative Commons Attribution 4.0 International License (http://creat iveco mmons .org/licen ses/by/4.0/), which permits unrestricted use, distribution, and reproduction in any medium, provided you give appropriate credit to the original author(s) and the source, provide a link to the Creative Commons license, and indicate if changes were made.
RESEARCH
*Correspondence: [email protected]
1 Department of Electrical
and Computer Engineering, University of Oklahoma, Norman, USA
Introduction
The past few decades have witnessed a new movement of interest and research in the study of complex networks, i.e., networks whose structure is irregular, complex and dynamically evolving in time such as power grids, communication networks, biologi-cal networks, social networks, etc. Investigating dynamics in such complex networks requires an understanding of the interaction between network topology and specific domain constraints. For example, the study of power grids requires basic circuit laws, relating voltages and currents, to be incorporated along with the network topology. In this paper, we explore this interaction in the context of deriving simplified equivalent networks as representations of large power grids. In this paper, the terms power systems, power system network, and power network are used interchangeably. Power network equivalencing has been studied in the literature with different objectives. Our objective is to study the equivalents appropriate for electrical market analysis.
Electrical market analysis involving power exchange is becoming more and more com-plex due to the size and degree of interconnections in modern power systems due to economic, political, and environmental reasons [1]. With such inherent complexities and information deficiency, it is difficult for participants to make operational and mar-ket decisions at buses that are sensitive to the condition of transmission lines. For these reasons, it is necessary to develop an enhanced method to support decisions, particu-larly, those sensitive to major and critical transmission lines. The analysis can be compu-tationally challenging, especially, when a full AC implementation approach is used [2]. Compared to the full AC analysis, a simplified analysis of the network can be done by means of full network DC power flow model [3]. Although the full AC analysis would be the most accurate approach, the DC approach allows network operators to make informed dispatch decisions thereby saving time and effort required. The enormous size of power system networks makes full network DC analysis computationally taxing. To reduce the computational burden and to simplify the analysis of electricity markets, sev-eral network equivalence models have been used [2, 4–6].
Various approaches for network equivalencing have been presented in [7–12]. These approaches follow the traditional method of eliminating less important elements from the system on the basis of geographic and electric parameters. Such elimination results in partitioning of the network into three clusters of buses: a cluster of internal buses, a cluster of external buses, and a cluster of boundary buses that divide the external buses from the internal buses. Due to their trivial impact on the internal system, remote gen-erators and transmission lines connected to the boundary buses may be eliminated with minor impact on decisions. However, irrespective of the bus demarcation, market analysis of large power system networks requires retaining the desired buyer/seller pairs corresponding to operating zones in order to understand the impact of power flows on transmission lines from the buyer/seller pairs at various buses. Hence, in this study, we do not eliminate the external buses but rather focus on the line flows between various operating areas. These line flows are called tie-line flows.
concept gained increased importance in view of its applications in areas outside electri-cal circuit theory [14–20].
In recent studies, network equivalencing has been done using generation shift factor (GSF)-based methods [5, 6, 21, 22]. In these methods, buses with similar impact on the interconnecting tie-line flows evaluated using GSFs are grouped together. In order to improve the efficiency and accuracy of bus clustering, [6] use is made of k-means algo-rithm based on GSF to cluster the buses. However, GSFs are sensitive to the change in the location of slack generator. Network operators supervising different regions of the interconnection might not be aware of the slack bus change, and hence there could be discrepancies in decision making, which can provoke an impact on regional power transactions. Therefore, our main objective in this paper is to develop a new clustering method as well as new network equivalent that overcomes the limitation of the GSF-based methods.
Our work in this paper includes our previous work [23] and its enhancements. The rest of this paper is organized as follows. “Preliminaries” section gives an introduction to all the basic concepts that are of interest in the development of techniques discussed in subsequent sections. We introduce, in “Average electrical distance” section, the con-cept of average electrical distance (AED) and discuss a relationship between AED and GSF. Also, the relevance of our work in the context of social network analysis is given in “Implications and relevance for social network analysis” section. “k-means algo-rithm” section gives an introduction to the k-means algorithm for clustering, followed by “AED-based k-means bus clustering method” section presenting our proposed AED-based k-means clustering method, which, however, has certain limitations. In “
AED-based k-means++ bus clustering method” section, we present our improved AED-based
k-means++ clustering method, to overcome the said limitations. The new method uses a seeding technique [24] for initialization of centroids. We call this augmented algorithm as AED-based k-means++ algorithm. We also incorporate in this method silhouette analysis to determine the number k of clusters to be given as input to the clus-tering method. The resulting AED-based k-means++ method yields clusclus-tering which is O(logk) competitive. “Power network equivalencing based on AED-based k-means++
clustering method” section presents how we use clustering to develop a power network equivalent suitable for market analysis. To demonstrate the efficacy of our approach for clustering and equivalencing, the rest of “Power network equivalencing based on
AED-based k-means++ clustering method” section is concerned with experimental and
com-parative evaluations of our network equivalence method applied on the 300-bus system. We conclude this paper with “Conclusion” section, highlighting the main findings of this work, their implications, and our continuing attempt to find an efficient network equiva-lencing technique for power systems and its implications in the context of social net-work analysis.
Preliminaries
Laplacian matrix of a graph
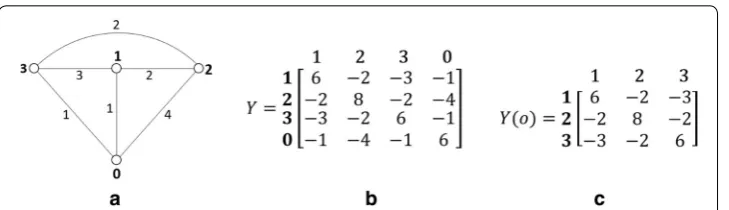
Consider a graph G=(V,E) with vertex set V = {0, 1,. . .,n} . Edge e∈E connecting vertices i and j is denoted by (i, j). We assume there are no loops on any vertices and there are no parallel edges connecting the vertices. In this paper, the terms, vertices and nodes, as well as links and edges, will be used interchangeably. Let an edge (i, j) be assigned a weight wij , a positive real number. If there is no edge connecting i and j then wij=0 . Two vertices i and j are adjacent if there is an edge (i, j). A vertex j is incident on
vertex i if there is an edge connecting i and j. The degree of a vertex i denoted by deg(i) is the sum of the weights of the edges incident on i.
The Laplacian matrix, Y = [yij] of G is an (n+1)×(n+1) matrix defined as follows:
As an example, a graph G and its adjacent matrix are shown in Fig. 1a, b. Note that
yij=yji . It can be seen that the sum of all the elements in any row and the sum of all the
elements in any column are both equal to zero. So, Y is singular and has no inverse. To handle this singularity problem of Y, two different approaches are adopted, namely, the eigenvalue approach and the determinant approach.
In the eigenvalue approach, the pseudo-inverse Y+ of Y is used. The properties of G
are studied in terms of the elements of Y+ . This approach is quite popular among
math-ematicians [25, 26]. In this paper, we follow the determinant approach which is popular in the electrical engineering community. In this approach, we first remove a row and the corresponding column from the Laplacian matrix, Y. Let us assume that the vertex labelled o called the datum node or slack node is removed. The resulting matrix denoted by Y(o) is called a reduced Laplacian matrix. The reduced Laplacian matrix Y(o) of Y in Fig. 1b is shown in Fig. 1c. It can be shown that the matrix Y(o) is non-singular and it has several other properties, for example, [13].
In all discussions in this paper, we will use Y = [yij] to denote the reduced Laplacian of
the network. We wish to draw attention to Cetinay et al. [27] where the authors investi-gate the impact of topology on power flow using spectral graph theory.
Electrical distance
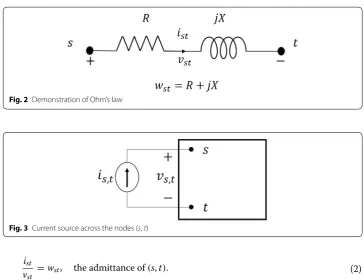
Consider an electrical network N represented by the graph G. The admittance of the edge (i, j) in N serves as the weight wij in G. Each edge (s, t) in G is associated with two
variables, voltage, vst and current ist , Fig. 2. Then by Ohm’s law, we get
(1)
yij=
−wij, ifi�=j deg(i), ifi=j
In the electrical engineering literature, the reduced Laplacian matrix, Y is called the node-to-datum matrix of N with vertex o as the datum vertex. Datum vertex is also known as the slack vertex. Let Z= [Zij] be the inverse of the reduced Laplacian matrix. This matrix is called Z-bus (Zbus) matrix in the power engineering literature. Also, the
ground is usually used as the slack vertex.
Suppose we now connect a current source of value is,t across nodes (s, t), Fig. 3. Let vs,t be the voltage across s and t. Then the electrical distance between s and t, denoted
as rs,t is defined as
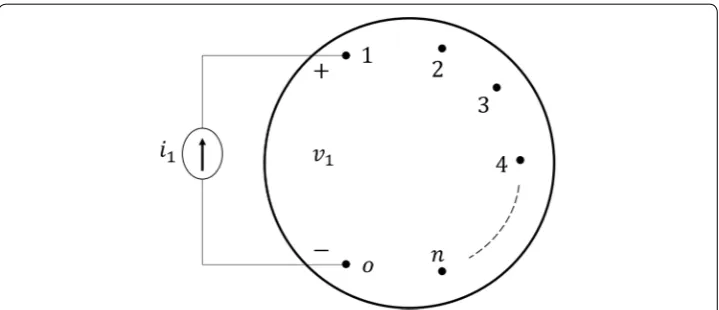
We now proceed to show how to evaluate rs,t across all pairs of nodes s and t. Note that
definition of rs,t does not require that s and t be connected by edge (s, t) in the network
N. Suppose we now connect a current source of value is across the vertices o and for each s∈ {1, 2,. . .,n} , as shown in Fig. 4. Note that the current flows from node o to node s.
Let vs denote the voltage from node s to node o. If we let V =
v1 .. . vn
and I =
i1
.. .
in
, then
the matrix Z represents the relation between V and I as
Therefore,
(2)
ist vst
=wst, the admittance of(s,t).
(3) rs,t =
vs,t is,t .
(4)
v1
.. . vn
=Z
i1
.. . in
Fig. 2 Demonstration of Ohm’s law
Note that Zij is a complex number denoted by (Rij+jXij).
It follows from (5) that rs,o=Zss , for all s. It can be shown that for all i and j
In the power engineering literature, electrical distance rst is called Thevenin resistance/
impedance between the nodes s and t, denoted by Zth,st . Thus,
Also, in the chemistry literature, the electrical distance is referred to as resistance dis-tance [14].
Generation shift factor
Given a power network with two or more interconnected areas, in power market analy-sis, a simpler equivalent network is needed which preserves the flows across the lines (edges) connecting different areas. In this context, the concept of GSF [5] was intro-duced and used in determining power network equivalents.
Let us consider a network N represented by graph G. Consider a line connecting two nodes u and v. Suppose we inject a current of unit value at node i i.e., connect a cur-rent source of unit value between node i and the slack node o. Then the curcur-rent that flows through the line (u, v) is called the generation shift factor of i with respect to (u, v), denoted as guv,i . To find a formula for guv,i consider (4). Then,
(5)
Zss=
vs is
ij=0,j�=s
(6)
Zst= vs is
ij=0,j�=t
(7)
rij=Zii+Zjj−2Zij.
(8)
Zth,st=rst =Zss+Ztt−2Zst.
(9)
vu =zu1i1+zu2i2+ · · · +zuiii+ · · · +zuuiu,
(10) vv =zv1i1+zv2i2+ · · · +zviii+ · · · +zvviv.
If ij =0 for all j =i and ii=1 , then we get vu=zui and vv=zvi . Then the current flow-ing through line (u, v) is given by
where cuv is the admittance of line (u, v). Thus, the GSF of i with respect to (u, v) is
Average electrical distance
Average electrical distance (AED) is defined as the electrical distance of a specific bus with respect to a transmission line or a tie-line connecting different operating zones. It can also be viewed as the relative electrical distance of a bus w.r.t. a line. The AED, duv,i ,
is defined as
where Zth,ui is the electrical distance between buses u and i, Fig 5. Using (8), we get
where Zui is the corresponding (u, i) element in the bus impedance matrix shown in (16).
(11) iuv =
zui−zvi
cuv
,
(12)
guv,i=
zui−zvi
cuv
.
(13) duv,i =
Zth,ui−Zth,vi 2
,
(14) duv,i =
(Zuu−2Zui+Zii)−(Zvv−2Zvi+Zii)
2 , (15) = ¯
Zuu− ¯Zvv
2 −( ¯
Zui− ¯Zvi) , (16) Z=
Z11 · · · Z1i · · · Z1n
..
. . .. ... ... ...
Zu1 · · · Zui · · · Zun
..
. . .. ... ... ...
Zn1 · · · Zni · · · Znn .
In (16), the diagonal elements of the impedance matrix represent the Thevenin impedance at each corresponding bus. For real-time analysis, it is required to execute calculations of electrical distance at short intervals which can be achieved through sim-plification of electrical distances. Since transmission lines usually have a high X/R ratio (Fig. 2), the resistances of the lines can be neglected compared to the high reactances of lines. Thus, the impedances in (14) can be simplified as shown in (17).
where elements in X¯ = [ ¯Xij] represent the approximation of elements in Z, i.e., Zij≈ ¯Xij .
Then, AED defined in (13) can be rewritten as
In previous studies [6, 21], GSF-based bus clustering methods have been used to ana-lyse the impact of injections from groups of buses on the power flows of different trans-mission lines. In these GSF-based methods, buses that have similar contributions to the power flows on lines of interest are grouped together based on GSFs. However, GSF does not take into account the impact of injection on buses u and v. As shown below, AED is indeed a measure that captures the impact of injection at u and v. This important char-acteristic of AED can be explained by analysing the relationship between AED and GSF. GSFs can be calculated using elements of X¯ as shown in (19).
Similarly, the sum of GSFs of bus u and bus v with respect to tie-line uv is given by
Comparing (18–20), we can see that duv,i enhances guv,i by adding an additional term
cap-turing the impact of injection at buses, u and v, on the power flow across the tie-line, uv. In the rest of the paper, we discuss our improved clustering method based on AED and compare the results with the existing GSF-based clustering method.
Calculation of AED
Algorithm given below to determine AED for each bus in the network with respect to the tie-lines of interest includes the following main steps:
Algorithm 1: Calculation of AED
1. Creation of bus impedance matrix According to the system data, bus admittance matrix is first developed. Then, bus impedance matrix, shown in (16), is created by calculating the inverse of bus admittance matrix.
2. Calculation of Thevenin impedance Using the elements of bus impedance matrix obtained in Step 1, the Thevenin impedances for each pair of buses are calculated according to (17).
(17)
Xth,ui= ¯Xuu−2X¯ui+ ¯Xii,
(18) duv,i =
Xth,ui−Xth,vi 2 = ¯
Xuu− ¯Xvv
2 −(Xui¯ − ¯Xvi)
. (19) guv,i=
¯
Xui− ¯Xvi xuv
.
(20) guv,u+guv,v=
¯
Xuu− ¯Xvv
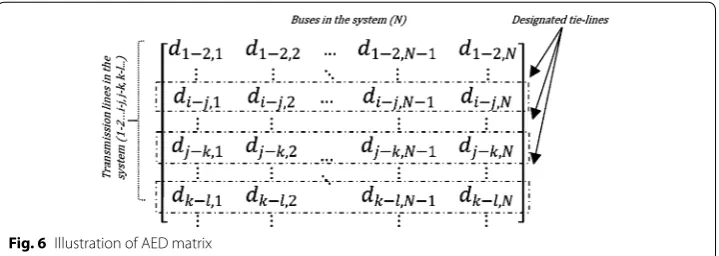
3. Calculation of AED After calculating the Thevenin impedances, AEDs between buses and tie-lines of interest are calculated using (18). The results of AEDs are used to cre-ate a matrix as shown in Fig. 6. In this matrix, each row corresponds to a tie-line and each column corresponds to a bus in the system. Thus, an element in the matrix cor-responds to AED from a bus to a tie-line in the system.
Implications and relevance for social network analysis
In the graphical representation of a social network, link weights are all unity. Differ-ent types of metrics/measures are defined to determine certain properties of links or nodes. For example, a measure called PageRank is used to rank the nodes in terms of their importance [28]. As another example, the betweenness measure of a link is used to determine the importance of a link. A link e is considered more important than another link e′ , if the fraction of the total number of messages that flow through e is greater than
that for e′ . In view of the connection between random walk and current flow in a resist-ance network [18], this fraction is in fact equal to the current through the link when a unit current is injected at a node. Taking advantage of this connection in [15], a measure similar to GSF is used to determine the betweenness measures of links. A detailed dis-cussion of many of these measures is given in [29].
The concept of role discovery in networks was first studied in sociology [30, 31]. In this context, roles considered are social roles. Thus, role discovery has become an important topic in social network analysis. Recently, role discovery has been studied in other set-tings such as online social networks, technological networks, biological networks, web graph, etc.
In [32], a comprehensive review of literature on role discovery in network has been given. This paper discusses the problem of identifying clusters in a network such that all nodes in each cluster are equivalent in some sense. Two types of equivalence are con-sidered: graph-based equivalence and feature-based equivalence. Several challenges that arise in the application of role discovery in non-static network such as dynamic and streaming graphs are also discussed in [32].
Our work in this paper is about clustering in a power network and its application in deriving a simplified approximate equivalent network that preserves flows along cer-tain lines. The GSF and AED are measures that are defined for each node with respect
to certain lines. If we set the line weights to unity, then these measures in the context of social networks capture the fraction of total messages that flow through a link when messages arrive (or injected) at a node. Therefore, the work presented in this paper is relevant to social network studies. For example, a problem of interest is to determine clusters such that the total flow carried by inter-cluster links is optimized. Once such clusters are identified, we can determine simplified approximate equivalent network as explained in “Power network equivalencing based on AED-based k-means++ clustering method” section that can be used to predict the flows across the clusters. Further discus-sion of these ideas is given in “Concludiscus-sion” section.
k‑means algorithm
k-means algorithm is one of the most popular clustering techniques in unsupervised learning tasks. Given a set of nodes or buses, this algorithm has been efficiently used to partition a network into k clusters [33]. This is based on the optimal placement of cen-troid for the respective cluster in a network [34].
In this algorithm, initially the network is divided into k clusters with each clus-ter defined by a reference bus (centroid). Remaining buses are then partitioned and assigned appropriately to the clusters based on the closeness of each bus to k reference buses. Then cluster adjustments are made with the calculation of new centroids. These centroids act as new reference points for the next partitioning of all the buses. These adjustments naturally produce error minimum of which corresponds to “Voronoi con-figuration” [35] which results in reference locations at the centroid of the clusters. The error measure or potential function is the sum of all the variances and is given as shown in (21).
where k is the total number of clusters; nj is the number of buses belonging to the jth
cluster; xij represents ith bus in the jth cluster; µj is the centroid in the jth cluster and the
term; and |xij−µj| represents the distance between xij and µj.
The process becomes iterative in order for the clusters to reach a local minimum which is dependent on the initial selection of the reference buses. The k-means algorithm keeps on adjusting the centroids after each partition making it more dynamic to the changes. The k-means algorithm is explained in Algorithm 2.
Algorithm 2: k-means algorithm
1. Selecting initial cluster centroids Cluster formation is initialized by selecting k cen-troids, i.e., µ1,µ2,. . .,µk in the network. These centroids act as initial reference
points for the buses to be assigned to an appropriate cluster.
2. Grouping buses into clusters For the selected k centroids, based on the Euclidean dis-tance, a bus is assigned to a cluster which has its centroid closest to the bus.
3. Recalculating centroid positions After all the buses are assigned to respective clusters, the new centroid of each cluster is recalculated as shown in (22).
(21)
φ=min
k
j=1
nj
i=1
4. Evaluating objective function in (21) After all buses are grouped into the clusters in Step 2, the potential function in (21) is evaluated.
5. Iterations of algorithm Steps 2–4 are repeated until the centroid of each cluster ceases to change its position with further iterations.
AED‑based k‑means bus clustering method
In this section, we discuss our AED-based improved clustering method that uses k-means algorithm for power system network equivalence. This method uses a simple iterative technique known as Lloyd’s algorithm for finding a locally minimal solution [34]. Further, it utilizes AED as a measure of distance between the buses in the system. Integration of AED makes k-means algorithm more relevant to the power system net-work study. This is because AED gives a measure of distance of a bus with respect to a tie-line. This algorithm proves to be sufficiently accurate for the independent analysis done by various utilities on their networks.
AED‑based k‑means algorithm
With reference to the power system network equivalence, it is preferred to incorporate a measure that can reflect the true distance from a power system network perspective. AED presented in “Average electrical distance” section is one such measure. In the net-work, while determining the clusters, we replace the actual distance term in the variance calculation with the AED measure. Specifically, in (21), we replace the location of the bus xij with d(xij) which represents the AED of the ith bus in the jth cluster with respect
to set of tie-lines and d(µj) represents the AED-based measure of the centroid in the jth
cluster with respect to the tie-lines. If the number of tie-lines is greater than 1, d(xij) is
replaced with the average of AEDs considered for the given set of tie-lines. The updated potential function is shown in (23).
This improves the k-means algorithm when applied in power system setting compared to general distance used in the classical algorithm.
AED‑based k‑means++ bus clustering method
In this section, we introduce AED-based improved k-means++ algorithm which can be used for clustering of large power system networks.
(22) µj= 1
nj nj
i=1 xij
(23)
φ=min
k
j=1
nj
i=1
k‑means++ algorithm
Although the results showed improvements compared to other methods used for clus-tering power system networks, the AED-based improved k-means clusclus-tering method may deliver inconsistent results for large power system networks comprising a large dataset. This is due to the fact that k-means algorithm uses random centroids for initiali-zation and thus achieves different results for each simulation. To address this problem, a seeding technique was proposed in [24] that selected the first centroid position at ran-dom and then initialized the remaining centroids by sampling probabilistically, propor-tional to the squared distance of the nearest centroid. This made an improvement in the k-means algorithm which helps to achieve a clustering which is O(log k) competitive. This is achieved by considering a potential function that satisfies the following relation for any set of buses:
where φ∗ is the potential function corresponding to the set of cluster centroids in the
network. The resulting augmented k-means algorithm is called k-means++ algorithm. In our study, we modify our previous AED-based k-means algorithm by incorporating the seeding technique to obtain a much improved AED-based k-means++ algorithm for bus clustering.
We would like to point out that k-means++ algorithm, due to its initialization pro-cess, produces starting centroids uniformly distributed for different iterations compared to k-means algorithm starting centroids. This is illustrated in [36].
AED‑based k‑means++ algorithm
Different from commonly used k-means++ algorithm, the improved AED-based algo-rithm groups the buses in a power system into various clusters based on the closeness between buses and the centroid of each cluster in terms of AEDs. The objective of the improved AED-based k-means++ algorithm is also to minimize the same potential function, φ , as shown in (23).
To achieve the objective described in (23) with the initial seeding as shown in (24), the improved AED-based algorithm, shown in Algorithm 3, includes the following main steps:
Algorithm 3: AED-based k-means++ algorithm
1. Cluster initialization Cluster formation is initialized by selecting one centroid µ1 , chosen uniformly at random in the network. This centroid acts as initial reference point for the buses to be assigned to an appropriate cluster. Those buses that are closer to µ1 are later assigned to the same cluster.
2. Determining cluster centroids Given the centroids, µ1,. . .,µj−1 , a new centroid, µj , is
chosen and each bus, i, is selected with probability
where D(i)=min|d(uv,i)−d(uv,µr)| , where r=1,. . .,j−1.
(24)
E[φ] ≤8(lnk+2)φ∗,
D(i)2 n
i=1D(i)2
3. Step 2 is repeated until we get all the centroids.
4. k-means algorithm Proceed as with the standard k-means algorithm (Algorithm 2)
with AED used as distance measure as discussed in “AED-based k-means bus
cluster-ing method” section.
Silhouette value analysis
An important problem in the application of k-means algorithm is to determine appropriate value of k. This problem has been extensively studied in the mathemati-cal statistics literature [37, 38]. The authors in [39] identified certain best performing methods. In [37], authors determined through extensive simulation studies that all the best performers do quite well in selecting the appropriate number of clusters to be selected. In our work, we use the silhouette value analysis proposed in [40] that is also among the best performers.
Silhouette value analysis is a graphical partitioning technique [41] allowing an appreciation of the relative quality of clusters. In our study, the silhouette value analysis is used to enhance the quality of clusters identified by the improved AED-based k-means++ clustering algorithm. The main steps of the silhouette value anal-ysis, which are incorporated into the improved AED-based k-means algorithm are explained below:
Algorithm 4: Silhouette value analysis algorithm
Consider that in a network with k clusters, a bus i∈ {1, 2,. . .,n} is assigned to a
cluster j∈ {1, 2,. . .,k} . Let nj be the number of buses in cluster j and k is the
arbi-trarily selected number of clusters. Clusters neighbouring j are represented by
m∈ {1, 2,. . .,k−1} such that m =j ; these are all the clusters other than j.
1. Evaluating closeness between buses in a cluster In this step, the average closeness between the buses in cluster j is evaluated by calculating AED measure, acij , with
respect to the tie-lines in the network. This is shown in (25).
2. Evaluating closeness between each bus and clusters In this step, the minimum of aver-age closeness of a bus i with respect to each cluster m =j is evaluated which is given
by ebim .
where nm is the number of buses in cluster m.
(25)
acij=
1 n
nj
r=1
r�=i
|d(uv,i)−d(uv,r)|
(26)
ebim= 1
nm nm
r=1
3. Calculating average silhouette coefficient of all the clusters The silhouette coefficient of a bus indicates whether its placement is in an appropriate cluster. Silhouette coef-ficient (sim) of bus i can be calculated as
The average of silhouette coefficients, sim , of buses is evaluated as si . The average
silhouette coefficient, si , of all the buses in the whole network is evaluated to give a
perspective of average closeness of all the buses to their neighbouring clusters. The coefficient is in a range [−1,+1] , where +1 indicates that buses are far away from their closest neighbouring clusters; while −1 indicates that the buses are closer to
their neighbouring clusters.
4. Selecting value ofkbased on silhouette value analysis Steps 1, 2 and 3 are repeated for different values of k and the one with average silhouette coefficient closest to +1 is
selected.
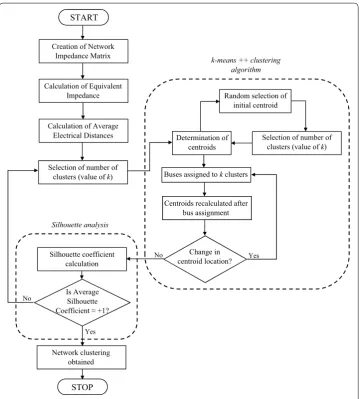
Flowchart
The proposed AED-based bus clustering method integrates the improved AED-based k-means++ algorithm and silhouette value analysis to group buses for network equivalence of large power system networks. The flowchart shown in Fig. 7 describes this bus clustering method.
Power network equivalencing based on AED‑based k‑means++ clustering
method
Power network equivalents based on aggregation of buses in a cluster
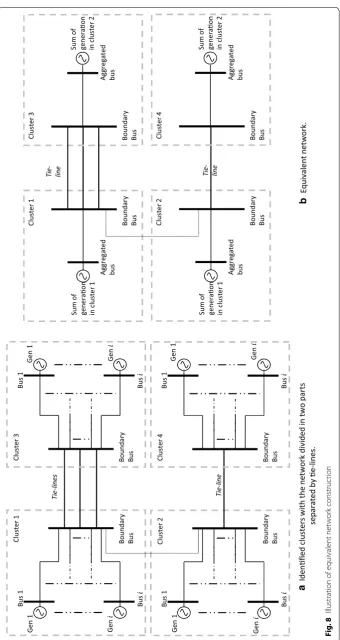
The given power system network is divided into various sub-networks governed by local utilities and connected by several tie-lines. Power system operators employ var-ious approximation methods to quickly analyse the behaviour of power system. To replicate the scenario, we employ a similar methodology that divides a given sub-net-work into smaller areas. This allows us to identify the tie-lines connecting the smaller areas. Further our AED-based improved clustering method is then used to identify appropriate clusters within each smaller area from which we obtain equivalent net-work. The equivalent network includes each cluster represented by an equivalent bus with a combined generation and load for that cluster connected directly to it. This equivalent bus is connected to the other equivalent buses through the tie-lines. A sample aggregation is illustrated in Fig. 8. In Fig. 8a, a part of the network is shown with two identified clusters connected through a tie-line. Each cluster can be approxi-mated by considering a single aggregated bus without any change in relevant informa-tion. As a result, we obtain a simple approximated network with each aggregated bus representing its respective cluster. This is shown in Fig. 8b.
(27)
sim=
ebim−acij
max(acij,ebim)
Case studies using tie‑lines
In this section, we first demonstrate in “39-bus system (Algorithm 3 and method of
“AED-based k-means bus clustering method)” section the efficacy of the proposed
AED-based improved k-means++ clustering method by comparing it with our pre-vious clustering method [23] (“AED-based k-means bus clustering method” section) on the IEEE 39-bus system. Then in “300-bus system” section, we use IEEE 300 bus system to show the superiority of the proposed method compared to the widely used GSF-based clustering method [5, 6, 21, 22].
39‑bus system (Algorithm 3 and method of “AED‑based k‑means bus clustering method”
section)
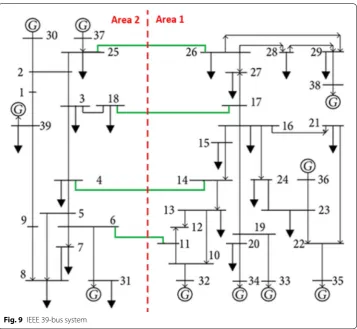
The IEEE 39-bus system is a standard test system composed of 39 buses with 10 gen-erators and 18 loads connected as shown in Fig. 9 [42, 43]. The net generation and load capacity are 5266.69 MW and 5222.80 MW, respectively. In our study, we consider the
Change in centroid location? Centroids recalculated after
bus assignment Buses assigned to kclusters
Selection of number of clusters (value of k) Random selection of
initial centroid
Determination of centroids
Yes
k-means ++ clustering algorithm
No
STOP Network clustering
obtained
Yes No Is Average Silhouette
Coefficient ≈ +1? Silhouette coefficient
calculation Selection of number of
clusters (value of k) Calculation of Average
Electrical Distances Calculation of Equivalent
Impedance Creation of Network
Impedance Matrix START
Silhouette analysis
b Equiva le nt networ k. Aggr egated bus
Boundary Bus Boundary Bus
Cluster 4 Cluster 2 Ti e- line Sum of
generaon in cluster
1 Aggr egated bus Sum of
generaon in cluster
2
Aggr
egated
bus
Boundary Bus Boundary Bus
Cluster 3 Cluster 1 Tie- line Sum of
generaon in cluster
1 Aggr egated bus Sum of
generaon in cluster
2
Bus
1
Bus
Boundary Bus
Bus
1
Bus
Boundary Bus
Cluster 3 Cluster 1 Tie-li nes Gen 1 Gen Gen 1 Gen a Iden fi ed clusters with the networ k divided in tw o parts separated by e -lines . Bus 1 Bus
Boundary Bus
Bus
1
Bus
Boundary Bus
Cluster 4 Cluster 2 Tie-l in e Gen 1 Gen Gen 1 Gen Fig . 8 I
llustration of equivalent net
w
or
k construc
system to be divided into two areas interconnected with four tie-lines in order to analyse the impact of any injection change in generation/load zones on designated transmission line flows. In Fig. 9, area 1 comprises 24 buses, while area 2 consists of 15 buses. Bus 31 is chosen as slack bus.
In our study, the two tie-line scenario is used to compare the proposed method with the method of “AED-based k-means bus clustering method” section. In this scenario, any two tie-lines out of four are utilized to connect the two areas in the system. Under this scenario, the clusters are identified using the two methods which are based on average AEDs of each bus with respect to the two tie-lines connected. The two clus-tering methods follow different algorithms, and hence, the clusters obtained using the two methods are different as observed in Table 1. This may affect the accuracy of tie-line flows in equivalent networks compared to the tie-line flows in the original network. The comparison of accuracy of tie-line flows in the equivalent network is demonstrated using tie-line flow analysis. Further, we also analyse the quality of clus-ters in the equivalent networks based on the similarity of buses in each cluster.
Tie-line flow analysis (Algorithm 3 and method of “AED-based k-means bus clustering method” section) The tie-line flow analysis is based on the comparison of accuracy of net tie-line flows in the equivalent networks with those in the original network. The equivalent networks are created using Algorithm 3 and method of “AED-based k-means bus cluster-ing method” section. Different cases with combinations of two tie-lines are studied. In this
study, the tie-line flows in the original network are calculated using GSFs, and those in the equivalent networks are calculated using average GSFs for each cluster.
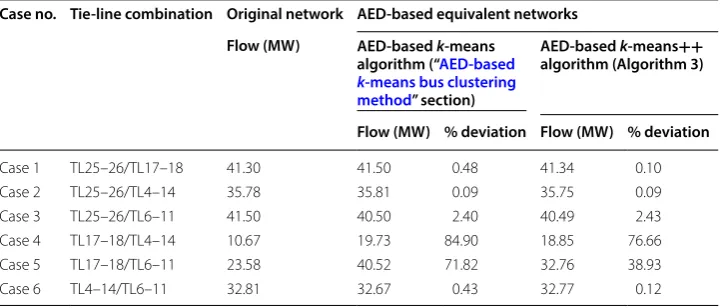
Table 2 shows the comparison of net tie-line flows under different tie-line combination cases. It can be observed from Table 2 that the net tie-line flows in the equivalent networks created using the proposed method are more accurate than those in the equivalent net-works created using our AED-based k-means clustering method of “AED-based k-means bus clustering method” section. For instance, in cases 1, 4, 5 and 6, the net flows in the tie-lines in equivalent network obtained using AED-based k-means++ method are more accu-rate compared to the net flows in equivalent network obtained using AED-based k-means method. For cases 2 and 3, the net flows in the equivalent networks obtained using the two methods are almost similar. Next, we present a study involving the quality of clusters which explains the tie-line flow analysis on the basis of cluster formations and similarity of buses in each cluster.
Cluster quality analysis We analyse the quality of clusters identified using Algorithm 3 and method of “AED-based k-means bus clustering method” section. In this study, the
Table 1 Comparison of clusters identified by two different AED‑based clustering methods Tie‑line 25–26 and Tie‑line 17–18
Clusters identified by AED‑based k‑means algorithm
(“AED‑based k‑means bus clustering method” section) Clusters identified by proposed AED‑based improved k‑means++ algorithm (Algorithm 3)
Clusters Buses Clusters Buses
SA 11 26, 28, 29, 38 SA 11 26, 28, 29, 38
SA 12 27 SA 12 27
SA 13 10, 11, 12, 13, 14, 15, 16, 17, 19, 20, 32,
33, 34, 35, 36 SA 13 10, 11, 12, 13, 14, 15, 16, 17, 19, 20, 32, 33, 34, 35, 36
SA 21 25, 37 SA 21 25, 37
SA 22 1, 2, 30, 39 SA 22 1, 2, 30
SA 23 18 SA 23 39
SA 24 3, 4, 5, 6, 7, 8, 9, 31 SA 24 3, 18
SA 25 4, 5, 6, 7, 8, 9, 31
Table 2 Comparison of net tie‑line power flows in the original network and AED‑based equivalent networks for 39 bus system
Case no. Tie‑line combination Original network AED‑based equivalent networks Flow (MW) AED‑based k‑means
algorithm (“AED‑based k‑means bus clustering method” section)
AED‑based k‑means++ algorithm (Algorithm 3)
Flow (MW) % deviation Flow (MW) % deviation
Case 1 TL25–26/TL17–18 41.30 41.50 0.48 41.34 0.10
Case 2 TL25–26/TL4–14 35.78 35.81 0.09 35.75 0.09
Case 3 TL25–26/TL6–11 41.50 40.50 2.40 40.49 2.43
Case 4 TL17–18/TL4–14 10.67 19.73 84.90 18.85 76.66
Case 5 TL17–18/TL6–11 23.58 40.52 71.82 32.76 38.93
cluster quality analysis is carried out in terms of the similarity of buses in clusters. The simi-larity is measured by the average of standard deviation of the AEDs in each of the clusters identified by the algorithm in [23] and the k-means++ algorithm of this paper. The stand-ard deviation of the buses in a cluster can be defined as
where σj represents the standard deviation of AEDs in jth cluster; dij indicates the AED
of ith bus in jth cluster; and µj indicates the mean of AEDs in jth cluster. In (28), a
smaller value of standard deviation indicates that the AEDs of the buses tend to be closer to the mean of the cluster, i.e., the buses are closer to each other.
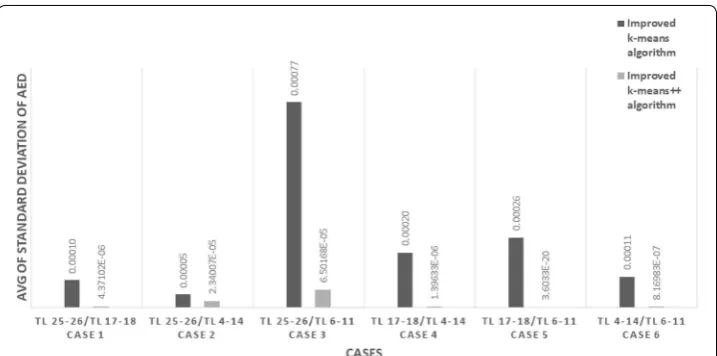
We analyse the cluster quality based on (28), the results of which are shown in Fig. 10. The figure compares the average of standard deviation of the clusters identified by the AED-based improved k-means++ clustering method to those identified with our previous method. In Fig. 10, for each case of combinations of tie-lines, grey bars indicate the average of standard deviations of AEDs for the clusters obtained using AED-based improved k-means++ algorithm; black bars correspond to the average of standard deviations of AEDs for the clusters obtained using previous AED-based algorithm.
It can be observed from Fig. 10 that for each set of two tie-lines, the similarity of buses in clusters created using proposed AED-based k-means++ algorithm is clearly more compared to the buses in clusters created using previous AED-based method. Based on similarity of buses in the clusters, the created equivalent network has net tie-line flows very similar to the original network which can be observed from Table 2. Thus, modifying the clustering method by replacing our method of “AED-based k-means bus clustering method” section with the proposed AED-based improved k-means++ algorithm provides much accurate results for network cluster-ing schemes.
300‑bus system
The IEEE 300-bus system is a test system developed by the IEEE Test Systems Task Force in 1993 [44]. It is composed of 300 buses with 69 generators and 195 loads connected through 409 transmission lines as shown in Fig. 11. Similar to IEEE 39-bus system, in order to analyse the impact on designated transmission line flows, the system is divided into two major areas interconnected using four tie-lines. In Fig. 11, area 1 comprises of 111 buses with total load of 11824.31 MW; area 2 consists of 189 buses and total load of 11,701.54 MW. Bus 7049 is chosen as slack bus.
To demonstrate the efficacy of our Algorithm 3, we compare it with the widely used GSF-based clustering method. We use different two tie-line scenarios in the 300-bus system and the two methods, based on average AEDs and average GSFs respectively, are used to identify clusters to obtain equivalent networks using k-means++ algo-rithm. Further, to validate the use of k-means++ algorithm, we compare Algorithm 3 with the AED-based method of “AED-based k-means bus clustering method” section that uses k-means algorithm. In this study, we use different two tie-line scenarios in (28)
σj= 1 nj
nj
i=1
the 300-bus system for clustering. These methods yield different clusters for the same network and in order to compare the two clustering methods, we analyse the accu-racy of tie-line flows in the equivalent networks. We also analyse the quality of clus-ters in these equivalent networks in terms of similarity of buses in each cluster.
Tie-line flow analysis (Algorithm 3, method of “AED-based k-means bus clustering method” section and GSF-based clustering method) In this section, we compare the net tie-line flows in the equivalent networks with those in the original 300-bus net-work. In order to study the flows, we consider the cases in which different combi-nations of two tie-lines connect the areas in the network. The results are shown in Tables 3 and 4 with different combinations of two tie-lines. The net tie-line flows in the equivalent networks in Table 3 are obtained using average GSFs for cluster iden-tification. It can be observed that for each of the cases, the net tie-line flow in the equivalent network created using our proposed method is more accurate as compared to the tie-line flow in equivalent network created using the GSF-based method that uses k-means++ algorithm. Also, from Table 4, it can be observed that the tie-line flows in the AED-based equivalent network using k-means++ algorithm are better as compared to the equivalent network that uses k-means algorithm. Further, cluster quality analysis is done in order to compare the methods based on the similarity of buses in each of the cluster obtained in equivalent networks.
Cluster quality analysis (Algorithm 3 and GSF-based clustering method) In this sec-tion, we analyse the quality of clusters identified using the proposed method (Algo-rithm 3) and GSF-based method in terms of similarity of buses. Here, the similarity of buses refers to the degree of change in AEDs or GSFs in a cluster with respect to a set of tie-lines. The similarity of buses in a cluster is decided using the standard deviation of buses given by (28). Based on (28), we obtain results as shown in Fig. 12. In this fig-ure, for each combination of two tie-lines, grey bars indicate the average of standard deviations of AEDs for the clusters obtained using AED-based improved k-means++ algorithm; black bars correspond to the average of standard deviations of GSFs for the clusters obtained using widely used GSF-based clustering method.
It can be observed from Fig. 12 that for each set of two tie-lines, buses in clusters cre-ated based on AEDs are more similar than those in clusters crecre-ated based on GSFs since the average of standard deviations of AEDs in clusters for each set of two tie-lines is smaller than the average of standard deviations of corresponding GSFs. Based on the
Table 3 Comparison of net tie‑line power flows in the original network and those in GSF and AED‑based equivalent networks obtained using Algorithm 3 for 300 bus system Case no. Tie‑line combination Original network GSF‑based equivalent
network AED‑based equivalent network (Algorithm 3) Flow (MW) Flow (MW) % deviation Flow (MW) % deviation
Case 1 TL19–87/TL8–14 448.09 375.31 16.24 392.85 12.33
Case 2 TL19–87/TL4–16 1051.79 1019.24 3.09 1032.31 1.85
Case 3 TL19–87/TL62–144 55.34 156.84 183.41 57.93 4.68
Case 4 TL8–14/TL62–144 450.86 391.79 13.10 487.01 8.02
Case 5 TL4–16/TL62–144 994.46 490.70 50.66 973.19 2.14
Table 4 Comparison of net tie‑line power flows in the original network and the AED‑based equivalent networks obtained using the Algorithm 3 and method of “AED‑based k‑means bus clustering method” section
Case no. Tie‑line combination Original network AED‑based equivalent networks Flow (MW) AED‑based k‑means
algorithm (“AED‑based k‑means bus clustering method” section)
AED‑based k‑means++ algorithm (Algorithm 3)
Flow (MW) % deviation Flow (MW) % deviation
Case 1 TL19–87/TL8–14 448.09 292.39 28.08 392.85 12.33
Case 2 TL19–87/TL4–16 1051.79 978.73 6.95 1032.31 1.85
Case 3 TL19–87/TL62–144 55.34 89.87 62.39 57.93 4.68
Case 4 TL8–14/TL62–144 450.86 324.26 28.08 487.01 8.02
Case 5 TL4–16/TL62–144 994.46 922.42 7.24 973.19 2.14
similarity and closeness of buses in the clusters, the created equivalent network has net tie-line flows very similar to that of the original network. It can be observed from Table 3, that the net tie-line flows in the equivalent network of 300-bus system cre-ated by bus clustering method using AED-based improved k-means++ algorithm are more accurate than those in the equivalent network created by GSF-based bus cluster-ing method. Similar results comparcluster-ing AED-based k-means algorithm [23] and the pro-posed k-means++ algorithm are shown in Table 4.
Conclusion
In this paper, we have presented an AED-based improved bus clustering method for network equivalence of large interconnected power systems. The method utilizes AED-based improved k-means++ algorithm for grouping similar buses together to form clus-ters on the basis of their respective AEDs. The new algorithm is obtained by augmenting the AED-based k-means algorithm to probabilistically initialize the centroids of clusters thereby, as in [26], improving the accuracy of the algorithm. The use of silhouette analy-sis along with improved k-means++ algorithm has resulted in further maximizing the accuracy of the clusters. The proposed method has been compared with our previous method [23] on the IEEE 39-bus system. It has been shown that when compared to the full network, the net tie-line flows in the equivalent networks created using the proposed method are more accurate than those in the equivalent networks created using our pre-vious method. Also, the proposed method yields a better cluster quality which shows that the buses in clusters formed using the proposed method are more closely connected than those in the clusters formed using our previous AED-based method.
Moreover, the proposed method has been compared with the widely used GSF-based clustering method [6] on the IEEE 300-bus system. It has been shown that the net tie-line flows in the network with different combinations of tie-lines are more accurate for the equivalent network obtained using the proposed AED-based
improved k-means++ clustering method than the one obtained using GSF-based
clustering method as well as the one obtained with the AED-based k-means algo-rithm. Further, the results of the cluster quality analysis show that the buses in the clusters obtained using proposed method are more closely connected. Thus, the reduced network obtained using the proposed method gives a better representation of the original network compared to the widely used GSF-based clustering method.
the inter-cluster Kirchhoff index of two clusters, the less closely connected are the nodes in the two clusters. A problem of interest is designing a clustering algorithm that determines clusters such that the Kirchhoff index of each cluster and inter-ter Kirchhoff index of each pair of clusinter-ters are within pre-specified limits. The clus-ters so determined will provide a solution to the community detection problem in social networks. This is a fairly complex problem involving the solution of a bi-criteria optimization problem, Kirchhoff indices of clusters and inter-cluster indices of pairs of clusters, optimization problem. We are currently studying design of approximation heuristics of this community detection problem. This problem is also related to the problem of partitioning power networks with the aim of containing the impact of cas-cades due to failures in the network.
Authors’ contributions
DS, DW and JNJ conceived of the presented idea of average electrical distance (AED) for network equivalencing. DS and JNJ developed the theory and DS performed the computations related to AED-based network equivalencing method and its comparison with the existing generation shift factor (GSF)-based method. KT, DW and JNJ verified the results and encouraged DS to extend the study by integrating k-means++ algorithm and apply it on a bigger network. JNJ and KT supervised the findings of this work. All authors discussed the results and contributed to the final manuscript. All authors read and approved the final manuscript.
Author details
1 Department of Electrical and Computer Engineering, University of Oklahoma, Norman, USA. 2 Department of Computer
Science, University of Oklahoma, Norman, USA. 3 Department of Electrical and Computer Engineering, North Dakota
State University, Fargo, USA.
Acknowlegements Not applicable.
Competing interests
The authors declare that they have no competing interests.
Availability of data and materials
The datasets supporting the conclusions of this article are included within the article and its additional files. The IEEE 39-bus system analysed in this study is commonly known as “The 10-machine New-England Power System”. This system’s parameters are specified by Athay et al. [42] and are published in a book titled “Energy Function Analysis for Power System Stability” [43]. The IEEE 300-bus system test case was developed by the IEEE Test Systems Task Force under the direction of Mike Adibi in 1993. The dataset for this system is available at [44]. Simulation codes related to the study will be avail-able upon request.
Funding Not applicable.
Publisher’s Note
Springer Nature remains neutral with regard to jurisdictional claims in published maps and institutional affiliations.
Received: 8 March 2018 Accepted: 3 April 2019
References
1. U.S. Energy information administration: energy explained. http://www.eia.gov/energ y_in_brief /artic le/power _grid. cfm.
2. Wang H, Sanchez CEM, Zimmerman RD, Thomas RJ. On computational issues of market-based optimal power flow. IEEE Trans Power Syst. 2007;22(3):1185–93.
3. Hogan W. A market power model with strategic interaction in electricity networks. Energy J. 1997;18:107–41. 4. Duran H, Arvanitidis N. Simplification for area security analysis: a new look at equivalencing. IEEE Trans Power App
Syst. 1972;91(2):670–9.
5. Cheng X, Overbye TJ. PTDF-based power system equivalents. IEEE Trans Power App Syst. 2005;20(4):1868–76. 6. Shi D, Tylavsky DJ. A novel bus-aggregation-based structure preserving power system equivalent. IEEE Trans Power
App Syst. 2015;30:4.
7. Dimo P. Nodal analysis of power systems. London: Kent; 1975.
8. Ward JB. Equivalent circuits for power flow studies. AIEE Trans Power App Syst. 1949;68:373–82. 9. Srinivasan S, Sujeer VN, Thulasiraman K. A new equivalence technique in linear graph theory. J Inst Eng.
10. Srinivasan S, Sujeer VN, Thulasiraman K. Application of equivalence technique in linear graph theory to reduction process in a power system. J Inst Eng. 1966;46:12.
11. Housos EC, Irisarri G, Porter RM, Sasson AM. Steady state network equivalents for power system planning applica-tions. IEEE Trans Power App Syst. 1980;99(6):2113–20.
12. Tinney WF, Bright JM. Adaptive reductions for power flow equivalents. IEEE Trans Power App Syst. 1987;2(2):351–60. 13. Swamy MNS, Thulasiraman K. Graphs, networks and algorithms. New York: Wiley; 1981.
14. Klein DJ, Randic M. Resistance distance. J Math Chem. 1993;12:81–95.
15. Newman MJ. A measure of betweenness centrality based on random walks. Soc Netw. 2005;27(1):39–54. 16. Tizghadam A, Leon-Garcia A. Autonomic traffic engineering for network robustness. IEEE J Select Area Commun.
2010;28(1):39–50.
17. Chellappan V, Sivalingam KM, Krithivasan K. A centrality entropy maximization problem in shortest path routing networks. Comput Netw. 2016;104:1–15.
18. Doyle PG, Snell JL. Random walks and electrical networks. Washington, D.C.: The Mathematical Association of America; 1984.
19. Coppersmith D, Doyle P, Raghavan P, Snir M. Random walks on a 129 weighted graphs and applications to online algorithms. In: 22nd symposium on the theory of computing. 1990. p. 369–78.
20. Blumsack S, et al. Defining power network zones from measures of electrical distance. In: 2009 IEEE power energy society feneral meeting. 2009. p. 1–8.
21. Oh H. A new network reduction methodology for power system planning studies. IEEE Trans Power App Syst. 2010;25(2):677–84.
22. Shi D, Shawhan DL, Li N, Tylavsky DJ. Optimal generation investment planning: pt. 1: network equivalents. In: 44th North American power symposium, Champaign, IL, USA. 2012. p. 1–6.
23. Sharma D, Thulasiraman K, Wu D, Jiang JN. Power network equivalents: a network science-based k-means clustering method integrated with silhouette analysis. In: Complex networks and their application VI, Lyon, France. 2017. p. 78–89.
24. Arthur D, Vassilvitskii S. k-means++: the advantages of careful seeding. In: 18th annual ACM-SIAM symposium on discrete algorithms. 2007. p. 1027–35.
25. Gutman J, Xiao W. Generalized inverse of the Laplacian matrix and some applications. Bull Acad Serbe Sci Arts. 2004;129(29):15–23.
26. Molitierno JJ. Aplications of combinatorial matrix theory to Laplacian matrices of graphs. Boca Raton: Chapman and Hall–CRC; 2012.
27. Cetinay H, Kuipers FA, Mieghem PV. A topological investigation of power flow. IEEE Syst J. 2018;12(3):2524–32. 28. Brin S, Page L. The anatomy of a large-scale hypertextual web search engine. In: Seventh international world-wide
web conference (WWW 1998). 1998.
29. Newman MEJ. Networks: an introduction. Oxford: Oxford Univ. Press; 2010. 30. Merton R. Social theory and social structure. New York: Simon and Schuster; 1968.
31. Lorrain F, White H. Structural equivalence of individuals in social networks. J Math Soc. 1971;1(1):49–80. 32. Rossi RA, Ahmed NK. Role discovery in networks. IEEE Trans Knowl Data Eng. 2015;27(4):1112–31. 33. Faber V. Clustering and the continuous k-means algorithm. Los Alamos Sci. 1994;22:138–44. 34. Lloyd SP. Least squares quantization in PCM. IEEE Trans Inf Theory. 1982;28:129–37. 35. Preparata FP, Shamos MI. Computational geometry: an introduction. Berlin: Springer; 1990. 36. Sicotte XB. k-means vs k-means++. Cross validated. https ://stats .stack excha nge.com/q/35760 6.
37. Tibshirani R, Walther G, Hastie T. Estimating the number of clusters in a data set via the gap statistic. J R Stat Soc B. 2001;63(2):411–23.
38. Milligan GW, Cooper MC. An examination of procedures for determining the number of clusters in a data set. Psy-chometrika. 1985;50:159–79.
39. Gordon A. Classification. London: Chapman and Hall–CRC; 1999.
40. Kaufman L, Rousseeuw PJ. Finding groups in data: an introduction to cluster analysis. New York: Wiley; 1990. 41. Rousseeuw PJ. Silhouettes: a graphical aid to the interpretation and validation of cluster analysis. J Comput Appl
Math. 1987;20(1):53–65.
42. Athay T, Podmore R, Virmani S. A practical method for the direct analysis of transient stability. IEEE Trans Power App Syst. 1979;2:573–84.
43. Pai MA. Energy function analysis for power system stability. Boston: Kluwer Academic Publishers; 1989.
44. 300 bus Power Flow Test Case Dataset. http://www2.ee.washi ngton .edu/resea rch/pstca /pf300 /pg_tca30 0bus.html. 45. Thulasiraman K, Yadav M. Weighted kirchhoff index of a resistance network and generalization of foster’s theorem.
In: IEEE International symposium on circuits and systems, Baltimore, USA. 2017. p. 1027–35.
46. Thulasiraman K, Yadav M. Network science meets circuit theory: resistance distance, Kirchhoff index and foster’s theorems with generalizations and unifications. IEEE Trans Circuits Syst. 2017;66:1027–35.