R E S E A R C H
Open Access
Improved monaural speech segregation based
on computational auditory scene analysis
Wang Yu, Lin Jiajun
*, Chen Ning and Yuan Wenhao
Abstract
A lot of effort has been made in Computational Auditory Scene Analysis (CASA) to segregate target speech from monaural mixtures. Based on the principle of CASA, this article proposes an improved algorithm for monaural speech segregation. To extract the energy feature more accurately, the proposed algorithm improves the threshold selection for response energy in initial segmentation stage. Since the resulting mask map often contains broken auditory element groups after grouping stage, a smoothing stage is proposed based on morphological image processing. Through the combination of erosion and dilation operations, we suppress the intrusions by removing the unwanted particles and enhance the segregated speech by complementing the broken auditory elements. Systematic
evaluation shows that the proposed segregation algorithm improves the output signal-to-noise ratio by an average of 8.55 dB and cuts the percentage of noise residue by an average of 25.36% compared with the mixture, yielding a significant improvement for speech segregation.
Keywords: Speech segregation, Computational Auditory Scene Analysis (CASA), Threshold selection, Morphological image processing
1 Introduction
While monaural speech segregation remains a challenge to computers, the humans can distinguish and track speech signal of interest under various noisy environ-ments. In 1990, Bregman published his book, Auditory Scene Analysis [1], which was the first to explain the principles underlying the perception of complex acous-tic mixtures systemaacous-tically, inspiring the establishment of its computational model, computational auditory scene analysis (CASA) [2].
The CASA simulates the human auditory system, and its processing of mixture speech is similar to human audi-tory perception. The system is made of two main stages: segmentation and grouping. It decomposes input signal into sensory segments in segmentation stage and then those segments which likely come from the same source are grouped into “target stream” together. Since the CASA system can solve the monaural speech separation prob-lem, it has been improved continuously and tremendously in recent years.
*Correspondence: jjlin [email protected]
School of Information Science and Engineering, East China University of Science and Technology, Shanghai 200237, China
The CASA system proposed by Brown and Cooke employs maps of different auditory features that generated from the output of a cochlear model for speech segrega-tion. This system does not requirea prioriknowledge of the input signal but has a few limitations. It cannot handle sequential grouping problem effectively and often leaves missing parts in the segregated speech [3].
Wang and Brown [2,4] proposed a CASA model to segregate voiced speech based on oscillatory correlation, which uses harmonicity and temporal continuity as major grouping cues. This model is able to recover most of the target speech, but it cannot handle the speech signal in the high-frequency range (above 1 kHz) well.
For voiced speech segregation, Hu and Wang [5,6] pro-posed a typical monaural CASA system which groups the resolved and unresolved harmonics differently, using amplitude modulation (AM) effects to improve segrega-tion. And in [7], an improved tandem algorithm is pro-posed for pitch estimation, which is robust to interference and produces good estimates of both target pitch and voiced target.
For unvoiced speech segregation, Hu–Wang system employed a multi-scale onset and offset analysis for
unvoiced speech segmentation, which makes both voiced and unvoiced speeches correctly segmented in [8]. After voiced speech removal, acoustic-phonetic features are then used in a classification stage to distinguish unvoiced segments from interference [9,10]. Hu and Wang [11] pro-posed a new CASA approach for unvoiced segregation based on spectral substraction. To further group the target signal across time, Shao proposed a CASA system com-prised of both simultaneous and sequential organizations systematically in [12].
This article proposes an improved CASA system for speech separation. After signal decomposition, response energy feature plays an important role in initial segmen-tation. In the previous CASA system, a constant value is used as the threshold of the time-frequency (T-F) unit’s respond energy. However, because the intrusion is unknown, its distribution may vary in each channel. Some intrusions are likely to be distributed in all chan-nels while some may only in some certain ranges. Hence, we label each T-F unit with proper threshold based on the respective channel energy to extract response energy feature, which will increase the robustness of the system and the accuracy of the initial pitch detection results. After further grouping and labeling the units with other auditory features, a binary mask map is constructed. There are usually some scattered or broken auditory fragments in the obtained mask map, which will cause unnecessary utterance fluctuation and degrade the qual-ity of the resynthesized speech. However, few studies have been concentrated on this problem so far. In [5], though Hu-Wang system employs a smoothing stage for obtained mask such as remove the segments that shorter than 30 ms and so on, this simple post-processing method is not able to remove the isolated segments and make up the missing elements systematically and effectively. Math-ematical morphological operation is of a great flexibility and well known as an efficient method in binary image
smoothing processing. It is widely used in various tasks such as noise suppression, image enhancement, and image restoration. To smooth and retrieve the mask map, this article proposes a new smoothing method based on the erosion/dilation operation of binary mathematical mor-phology. This method is able to remove the residual noise and restore the mask map while maintaining the mask information. The experiments in Section 3 show that with a proper smoothing extent, it generates better results than conventional smoothing method.
The rest of the article is organized as follows. Section 2 gives an overview of the proposed system model and a detailed presentation of each component in this model. In Section 3, the proposed system is evaluated and compared with Hu–Wang tandem system [7]. Finally, conclusion is presented in Section 4.
2 System description
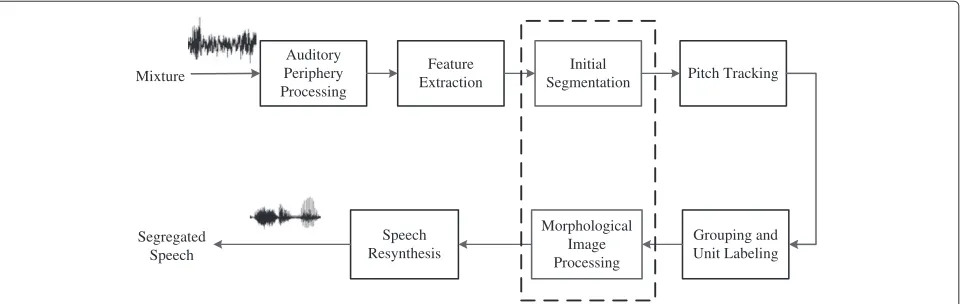
Figure 1 illustrates the proposed speech separation model, which is a multi-stage system, where initial segmenta-tion module is improved and the smoothing module for auditory element mask based on the morphological image processing is added to CASA speech segregation system.
2.1 Auditory periphery processing
In the first stage, auditory periphery is modeled by a 128-channel gammatone filterbanks and a simulation of neuromechanical transduction by inner hair cells [5]. The input speech passes through the auditory periphery model and is decomposed into the T-F domain. Each unit in this domain is called a T-F unitucm, corresponding to a certain filter channelcat a certain time framem.
Gammatone filters are derived from psychophysical observations of the auditory periphery and this filterbank is a standard model of cochlear filtering [2]. Its center
Grouping and Unit Labeling Speech
Resynthesis Mixture
Segregated Speech
Morphological Image Processing
Pitch Tracking Initial
Segmentation Feature
Extraction Auditory
Periphery Processing
frequencies are quasi-logarithmically spaced from 80 to 5000 Hz. The impulse response of gammatone filter is
g(t)=
tl−1exp(−2πbt)cos(2πft) t≥0
0 else (1)
wherel=4 is the center frequency of the filter andbis the equivalent rectangular bandwidth which increases withf.
The response of each gammatone filter is further pro-cessed by Meddis et al. [13] model of inner hair cells. Its output represents the firing rate of an auditory nerve fiber. In the high-frequency range, a filterbank channel con-tains multiple harmonics, leading to AM problem and changing the correlogram. However, it is proven that the envelope correlogram shows fluctuation at the fundamen-tal frequency of dominant pitch though the response in high-frequency range is strongly amplitude modulated, so it is an appropriate feature in high-frequency range for CASA system. Therefore, we use a low-pass FIR filter to extract the response envelope feature of each channel [5]. The outputh(c,n)is divided into 20-ms time frames with 10-ms time shift in each channel.
2.2 Feature extraction
In the second stage, we extract the auditory features from the filter response as follows.
(1) Correlogram: A correlogram constructed by the autocorrelation of hair cell responseh(c,n)in the T-F domain is given by:
AH(c,m,τ )=
1 Nc
Nc−1
n=0
h(c,mT−n)h(c,mT−n−τ ) (2)
wherec is the order of the channel and m is the time frame andNcis the number of samples in a frame of
20 ms.τ refers to time delay,τ ∈[ 0, 12.5ms], where the maximum delay is corresponding to 80 Hz. The envelope correlogram is constructed by computing the autocorrelations of the response envelope.
(2) Cross-channel correlation: Cross-channel
correlation between adjacent filter channels indicates whether the filters respond to the same target.CHis
calculated as follows.
CH(c,m)=
L−1
τ=0 ˆ
AH(c,m,τ )AˆH(c+1,m,τ ) (3)
Here,L is the sampling number corresponding to the maximum time lag andAˆH denotesAHnormalized
to zero mean and unity variance.
The envelope of cross-channel correlation indicates the similarity between the envelopes of AM patterns in the high-frequency range, which is computed by the envelope correlogram.
(3) Response energy: Whenτ =0, the correlogram A(c,m, 0)represents the response energy of the input signal.
(4) Onset/offset detection: Onsets and offsets correspond to sudden intensity changes, reflecting boundaries of auditory events [12]. This feature provides useful cues for unvoiced speech segmentation. Here, we employ an
onset/offset-based segmentation method proposed by Hu and Wang [8]. It consists of three stages: smoothing, onset/offset front matching and multi-scale integration, as shown in Figure 2.
Onset/offset detection yields a set of segments, usually containing voiced, unvoiced speech, and interference.
2.3 Initial segmentation
Segmentation stage comprises two parts, namely voiced and unvoiced. Unvoiced segmentation is based on onset/offset analysis as mentioned in Section 2.2 while voiced segmentation is mainly based on the extracted features such as response energy and cross-channel correlation.
Since the response energy of the T-F units dominated by the target speech is stronger than those dominated by the background noise, the estimated target units are initially labeled based on the response energy feature A(c,m, 0) and the cross-channel correlation featureC(c,m)as fol-lows [5]:
A(c,m, 0)≥θHc
C(c,m)≥θC (4)
Here,θCis constant, chosen to be 0.985[4].
θHc is the threshold for the effective target energy. In this article, the intrusions for the speech segrega-tion experiment are of a great variety. The distribusegrega-tion of the intrusion’s energy is quite uncertain. It may be
Smoothing Onset/offset Front Matching
Multiscale Integration
( )
h n
output
distributed around the whole channels or in a certain range, mostly in the high-frequency range. Conventional constant threshold is not able to extract the target energy while removing the intrusion efficiently. This would affect the initial dominant pitch detection results. To obtain more accurate energy extraction results, the energy is extracted based on its own characteristic distribution fea-ture in the proposed algorithm. Different thresholds are calculated for different frequency channels. Here, θHc is defined as the threshold of channelcand calculated based on the average energy of channelcas follows:
θHc= 1
M·α
M
m=1
A(c,m, 0) (5)
Here, Mis the total number of the frames in a single channel.αis constant and decides the value of the thresh-old. ifαis set too high, the threshold would be too low to remove the interference especially in the high-frequency range. If it is set too low, the threshold would be too high to preserve the target energy in all channels. Thus, it has to seek the balance between target energy preserving and intrusion energy removing. By experiments, it is found that α = 1.2 is an appropriate value. The experiment results are presented in Section 3 for details.
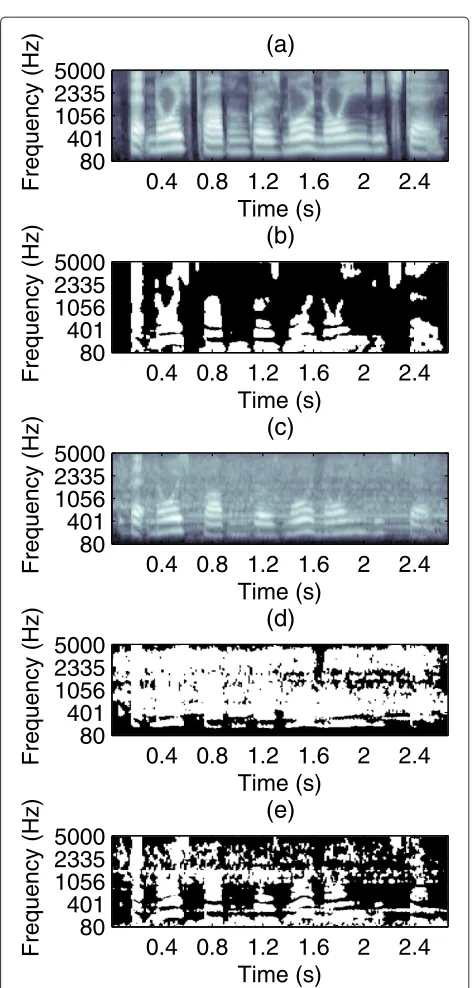
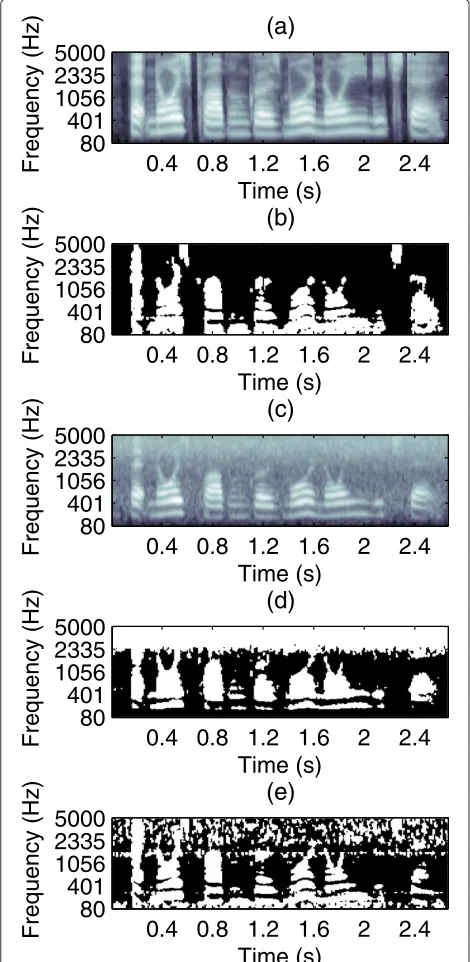
The proposed energy threshold selection method often produces better results than the conventional constant threshold as it can remove more interference units, espe-cially the non-speech ones. Figure 3 illustrates an example of the female speech and crowd noise with music mixture labeled by conventional threshold and proposed method, whose intrusion energy is distributed in all channels. Sim-ilar to Figure 3, the response energy-labeling example of the speech and white noise mixture, whose intrusion energy is mainly distributed in high-frequency ranges, is shown in Figure 4.
From Figures 3 and 4, it can be inferred that for many kinds of intrusions, the proposed method can remove more units dominated by the interference than the con-ventional threshold selection method, which will increase the accuracy of the initial pitch detection and the robust-ness of the system.
After initial labeling, those selected neighboring T-F units which likely come from the target speech are merged into segments [5].
2.4 Pitch tracking
Pitch detection and tracking in complex environment has proven to be very challenging in CASA system. In this article, we apply a tandem method for pitch tracking and reestimation proposed by Hu and Wang [7,14].
The tandem algorithm can track several pitch con-tours and handle multi-talker problem. First, an initial
Time (s)
Frequency (Hz)
(a)
0.4 0.8 1.2 1.6
2
2.4
5000
2335
1056
401
80
Time (s)
Frequency (Hz)
(b)
0.4 0.8 1.2 1.6
2
2.4
5000
2335
1056
401
80
Time (s)
Frequency (Hz)
(c)
0.4 0.8 1.2 1.6
2
2.4
5000
2335
1056
401
80
Time (s)
Frequency (Hz)
(d)
0.4 0.8 1.2 1.6
2
2.4
5000
2335
1056
401
80
Time (s)
Frequency (Hz)
(e)
0.4 0.8 1.2 1.6
2
2.4
5000
2335
1056
401
80
Figure 3The energy-labeled mask for the speech and crowd noise with music mixture.(a)Cochleagram of a female utterance showing the energy of each T-F units. The brighter pixel indicates stronger energy.(b)Ideal binary mask, which is computed by target and intrusion before mixing.(c)Cochleagram of the mixture.(d)The mask labeled by the conventional threshold.(e)The mask labeled by the proposed threshold selection method.
Time (s)
Frequency (Hz)
(a)
0.4 0.8 1.2 1.6
2
2.4
5000
2335
1056
401
80
Time (s)
Frequency (Hz)
(b)
0.4 0.8 1.2 1.6
2
2.4
5000
2335
1056
401
80
Time (s)
Frequency (Hz)
(c)
0.4 0.8 1.2 1.6
2
2.4
5000
2335
1056
401
80
Time (s)
Frequency (Hz)
(d)
0.4 0.8 1.2 1.6
2
2.4
5000
2335
1056
401
80
Time (s)
Frequency (Hz)
(e)
0.4 0.8 1.2 1.6
2
2.4
5000
2335
1056
401
80
Figure 4The energy-labeled mask for the speech and white noise mixture.(a)Cochleagram of a female utterance showing the energy of each T-F units.(b)Ideal binary mask.(c)Cochleagram of the mixture.(d)The mask labeled by the conventional threshold. (e)The mask labeled by the proposed threshold selection method.
active units. LetL0(c,m)be the labeled mask after initial segmentation andH0 be the hypothesis that ucm is tar-get dominant, the estimated tartar-get pitch is calculated as follows:
τS,1(m)=arg max τ
c
L0(c,m)·sgn(P(H0|rcm(τ ))−θP) (6)
where
sgn(x)= ⎧ ⎪ ⎨ ⎪ ⎩
1, x>0 0, x=0
−1, x<0
(7)
andθPis set to be 0.75 [7,9].
rcm(τ )is a six-dimensional feature vector for each T-F units, defined as follows:
rcm(τ )= ⎛ ⎜ ⎜ ⎜ ⎜ ⎜ ⎜ ⎜ ⎜ ⎜ ⎜ ⎝
A(c,m,τ )
int(¯f(c,m)τ ) ¯
f(c,m)τ−int(f¯(c,m)τ )
AE(c,m,τ )
int(¯fE(c,m)τ )
¯
fE(c,m)τ−int(f¯E(c,m)τ )
⎞ ⎟ ⎟ ⎟ ⎟ ⎟ ⎟ ⎟ ⎟ ⎟ ⎟ ⎠ (8)
Here,A(c,m,τ )denotes the autocorrelation andf¯(c,m) denotes the estimated average instantaneous frequency features calculated from the response of each T-F unit
ucm. The function int(x)returns the nearest integer. The first three features are extracted from the filter responses and the last three from the response envelopes [7,14].
P(H0|rcm(τ )) for each channel is computed by a pre-trained multi-layer perceptron. The corpus used for train-ing consists of 100 utterances selected from TIMIT database and 100 intrusions of a great variety [7]. With the obtained pitch estimates, the mask forτS,1(m), denoted as
L1(c,m), is reestimated as
L1(c,m)=
1, P(H0|rcm(τS,1(m))) >0.5
0, else (9)
The tandem algorithm is able to handle multiple pitch estimation and tracking problem. If the mixture contains other utterances, after extracting the first target pitch τS,1(m), the units which do not supportτS,1(m)are used to extract the second pitchτS,2(m)as follows:
τS,2(m)=arg max τ
c
L2(c,m)·sgn(P(H0|rcm(τ ))−θP)
(10)
whereL2(c,m)is the mask forτS,2(m), calculated as
L2(c,m)=
1, P(H0|rcm(τS,1(m)))≤θPandL0(c,m)=1 0, else
(11)
Similarly, after extracting the second pitchτS,2(m), the maskL2(c,m)is reestimated as
L2(c,m)=
1, P(H0|rcm(τS,2(m))) >0.5
After the pitch estimation, pitch contours are gener-ated based on the temporal continuity. The differences between the pitch periods of the same speech at the consecutive frames m − 1,m, and m + 1 should be all less than 20% of themselves. Meanwhile, their asso-ciated masks should also have good temporal continu-ity. After this pitch tracking with the above constraints, the remaining isolated pitch estimates are considered unreliable and set to 0, indicating no pitch at these frames [7,9,14].
The pitch contours and their associated masks are both reestimated iteratively. The tandem algorithm estimates the pitch and segregates the voiced speech jointly [11].
2.5 Grouping and unit labeling
In this stage, the T-F units are grouped into streams and labeled as target or background based on the extracted feature. To obtain the final target stream, both voiced and unvoiced segregations are needed [12]. Hence, a binary mask map is constructed finally.
1. If the interference is non-speech, voiced speech segregation is performed by tandem algorithm first [7]. Then an unvoiced speech segregation algorithm proposed by Hu and Wang [10,15] is used in this article. The extracted segments by onset/offset analysis usually contain both voiced, unvoiced speech and interference. To extract the unvoiced segments, the segments that are overlapped with the voiced segments need to be removed first. Then, the unvoiced segments are distinguished from interference based on the classification of
acoustic-phonetic features. The extracted unvoiced segments are subsequently merged with the target streams to generate final outputs.
2. If intrusion is another speech, after simultaneous grouping based on the detected pitch contours, a sequential grouping for organizing the target
utterance based on speaker characteristics is required [16]. According to Shao and Wang, to ensure the homogeneity of each segment, if dominant pitch values of neighboring frames change abruptly, it is considered that a speaker change occurs and the segment may be split into two shorter one. To group the segments, the speaker models are needed to be pre-trained. The data used for training and testing come from TIMIT database. The speaker set consists of 30 talkers (15 males and 15 females). The speakers are modeled as 64-mixture Gaussian mixture models and trained using the Gammatone frequency cepstral coefficients [12]. With the pre-trained speaker models, the segments are grouped into two speaker streams by searching for the optimal hypothesis
based on the speaker characteristics. A binary mask for voiced segments is labeled regarding whether the current belongs to the same speaker as the previous segments based on the likelihood of pitch dynamic feature. Unvoiced segments grouped based on the already detected speakers with the organized streams [12,16].
After the above steps in grouping and unit labeling, a binary mask map is obtained.
2.6 Smoothing
There are some discrete fragments or missing segments in the mask map we have obtained, which will cause unnecessary fluctuation in the segregated speech. In pre-vious CASA systems, little attention has been paid to this problem. In our system, missing auditory elements are complemented and unwanted particles are pruned while the original target segments being maintained in a novel and systematic way.
Though the mask map is a two-dimensional T-F rep-resentation of audio signal, it is also a binary image and viewed as a bi-valued function of 1 and 0. In this binary mask image, the discrete fragments less than a certain threshold is likely to be the residual noise while the broken auditory elements with narrow gaps indicate the discontinuous speech in the resynthesized speech. So, the problem of speech enhancement becomes the image restoration. In this way, we can use the image processing technique to improve the quality of the segregated speech signal.
2.6.1 Morphological image processing
Mathematical morphology is often used in binary image processing for pre- or post processing, such as morpho-logical filtering, thinning, and pruning [17]. The language and theory of the mathematical morphology often present a dual view of binary images. It is an effective way to remove the noise while retaining the information details in binary image.
With proper morphological image processing opera-tions, we can suppress the intrusions by removing the unwanted particles and enhance the segregated speech by complementing the broken auditory segments in the obtained mask.
The operations of dilation and erosion are fundamental to morphological image processing. The unwanted parti-cles can be pruned and the broken auditory elements can be complemented in the mask map by combining the two operations properly.
manner and extent of this thicken is controlled by a shape referred to as a structuring element.
LetB be the structuring element and A be the mask, we define some basic operations first.
ˆ
Bis the reflection of setB, defined as
ˆ
B= {c|c= −b, forb∈B} (13)
(B)zis the translation of setB by pointz=(z1,z2),
defined as
(B)z= {c|c=b+z,forb∈B} (14)
Based on the above definitions, the dilation ofA by B, denotedA⊕B, is defined as follows
A⊕B= {z|(Bˆ)z∩A=Ø} (15)
where Ø is the empty set.
(2) Erosion: Erosion is an operation that “shrinks” or “thins” objects in a binary image. As in dilation, the manner and extent of shrinking is controlled by a
structuring element. The erosion ofA by B, denoted AB, is defined as follows
AB= {z|(B)z∩Ac=Ø} (16)
whereAcis the complement of setA [17].
2.6.2 Mask smoothing based on morphological image processing
In this stage, we complement the missing auditory ele-ments and prune the unwanted particles by combining dilation and erosion operations.
Each marked T-F unit is considered as an active element. All the active elements are considered as having simi-lar periodicity patterns. The structuring element defines the smoothing extent of the resulting mask. For time dimension, since the actual speech segments should be no shorter than 30 ms [5], the target speech segments should last for two frames as each frame representing 20 ms with 10 ms time shift. For frequency dimension, since the seg-ments that cross less than three channels are considered to be edge elements [18], the target segments should cross three channels at least. Thus, the segments less than two frames or does not cross three channels should be pruned
Time (s)
Frequency (Hz)
(a)
0.4 0.8 1.2 1.6 2 2.4
5000
2335
1056
401
80
Time (s)
Frequency (Hz)
(b)
0.4 0.8 1.2 1.6 2 2.4
5000
2335
1056
401
80
Time (s)
Frequency (Hz)
(a)
0.4 0.8 1.2 1.6 2 2.4
5000
2335
1056
401
80
Time (s)
Frequency (Hz)
(b)
0.4 0.8 1.2 1.6 2 2.4
5000
2335
1056
401
80
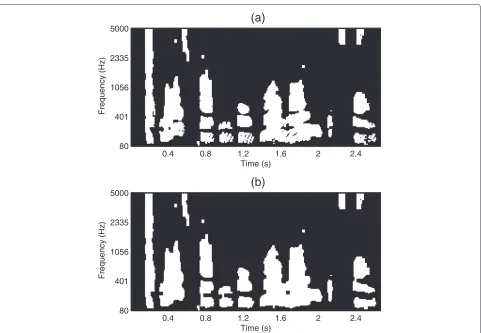
Figure 6Result of complementing the mask.(a)The maskA before complementing.(b)The final maskCafter complementing.
by morphological image processing. Similarly, the gaps no larger than the same size should be complemented, too. Hence, the structuring element are selected to be a 3×2 mask. Here, we perform the smoothing operation with the following structuring element:
B=
⎡ ⎢ ⎣
1 1 1 1 1 1 ⎤ ⎥
⎦ (17)
With this proper size of structuring element, the opera-tion can remove the unwanted particles and complement the broken auditory element while maintaining the origi-nal target segments. The smoothing operation rules take the form as follows:
(1) Pruning: To suppress the synthesized noise, pruning stage is used to remove the isolated particles and smooth the spurious salience of the segments in the obtained mask. We apply erosion of the maskA by the structuring elementB and followed dilation of the result byB. After these operations, we remove
the small isolated particles and obtain the resulting maskA [17]:
A =(AB)⊕B (18)
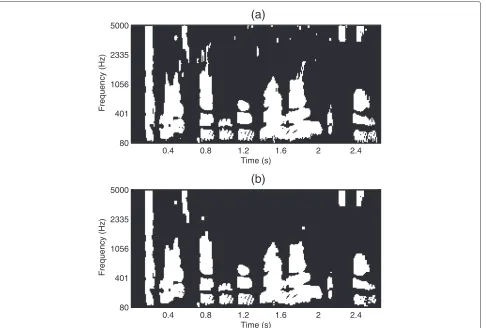
Figure 5 illustrates the original maskA and the mask A after pruning.
From Figure 5, it can be seen that the isolated segments which unlikely arise from target speech are removed successfully.
(2) Complementing: We complement the broken auditory elements in the low-frequency range (below 1 kHz) after pruning based on the morphological image processing. We applyA with dilation byB and followed by erosion. This operation will fill the discontinuous gaps of the target speech [17]. The resulting maskC in the low-frequency is obtained after complementing step:
Clow=(Alow⊕B)B (19)
In many situations, there will be some residual interference energy distributed in the high-frequency range. If complementing is applied in the
0 0.4 0.8 1.2 1.6 2 2.4 −1
0 1
Time (s)
Amplitude
(a)
0 0.4 0.8 1.2 1.6 2 2.4
−1 0 1
Time (s)
Amplitude
(b)
0 0.4 0.8 1.2 1.6 2 2.4
−1 0 1
Time (s)
Amplitude
(c)
0 0.4 0.8 1.2 1.6 2 2.4
−1 0 1
Time (s)
Amplitude
(d)
Figure 7Segregation illustration.(a)The waveform of the original female utterance.(b)The waveform of the mixture.(c)The waveform of the resynthesized speech by the tandem system.(d)The waveform of the resynthesized speech by the proposed CASA system.
brought in the segregated speech. Therefore, we only complement the mask map to recover the broken auditory elements in the low-frequency range [18]. The comparison for complementing results is presented in Section 3 for details.
Figure 6a shows an example of maskA while Figure 6b shows the final mask resultsC after complementing. It can be seen that the auditory element groups are compen-sated so that there are no missing parts between speech elements after complementing stage.
Through morphological image processing smoothing, the likely residual noise is removed and the discontinuous target speech is complemented, so the mask map and the segregated speech are both enhanced.
2.7 Speech resynthesis
After smoothing stage, this algorithm resynthesizes the segregated speech from input mixture and the final mask
Cwith an inverse filter of the gammatone filterbank [12].
Figure 7 illustrates the segregated result for the speech of a female utterance and the alarm clock mixture. Figure 7a shows the waveform of the original female utter-ance and Figure 7b of the mixture. The resynthesized speech by the tandem system and the proposed CASA system are shown in Figure 7c,d respectively.
As shown in Figure 7, the waveform of segregated speech by the proposed system is more closer to the origi-nal one for that it extracts more exact energy and retrieves the auditory mask map.
3 Evaluation and comparison
0.8 1.0 1.2 1.4 1.6 1.8 −0.3
−0.2 −0.1 0 0.1 0.2 0.3 0.4 0.5
α
Average SNR Gain S
G
(dB)
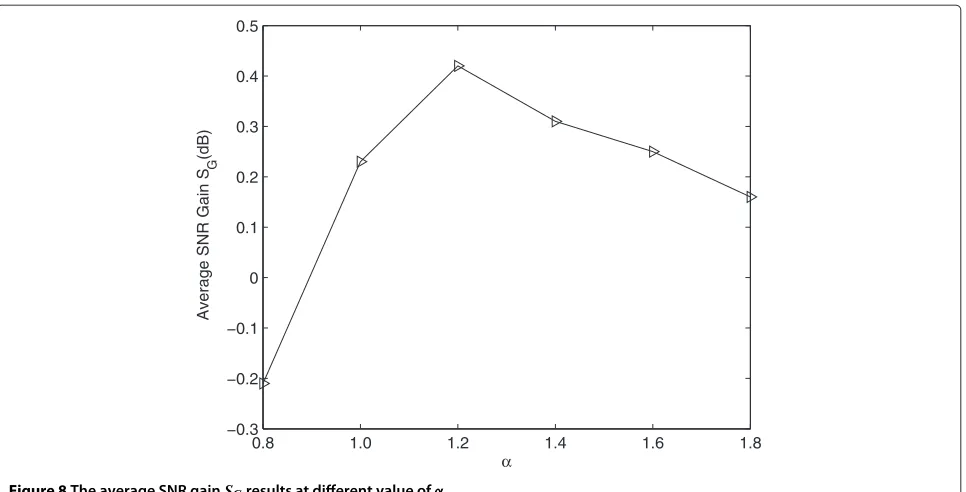
Figure 8The average SNR gainSGresults at different value ofα.
N1, white noise; N2, rock music; N3, siren; N4,telephone; N5, electric fan; N6, alarm clock; N7, traffic noise; N8, bird chirp with water flow; N9, wind noise; N10, rain; N11, cocktail party; N12, crowd noise at a playground; N13, crowd noise with music; N14, crowd noise with clap; N15, babble noise; N16, male speech; N17, female speech. In N16 and N17 cases, the target utterance is much stronger than the interference. These intrusions are of a considerable variety and used to test CASA systems [7,9].
3.1 Selection ofα
First, we present the experiment results for the selection ofαin initial segmentation. Here, average signal-to-noise ratio (SNR) gain over the conventional threshold method is employed as the criterion for the selection ofα. SNR is an objective and straightforward criterion to measure the performance of the algorithm, which is calculated as
SNR=10log10 S0(n) 2
(Sˆ(n)−S0(n))2
(20)
N1 N2 N3 N4 N5 N6 N7 N8 N9 N10 N11 N12 N13 N14 N15 N16 N17 0
0.2 0.4 0.6 0.8 1 1.2 1.4
Intrusion type
SNR Gain S
G
′ (dB)
Complementing in full−frequency range Complementing in low−frequency range
N1 N2 N3 N4 N5 N6 N7 N8 N9 N10 N11 N12 N13 N14 N15 N16 N17 −2
0 2 4 6 8 10 12 14 16
Intrusion type
SNR (dB)
Mixture
HuWang Tandem System Proposed Threshold Selection
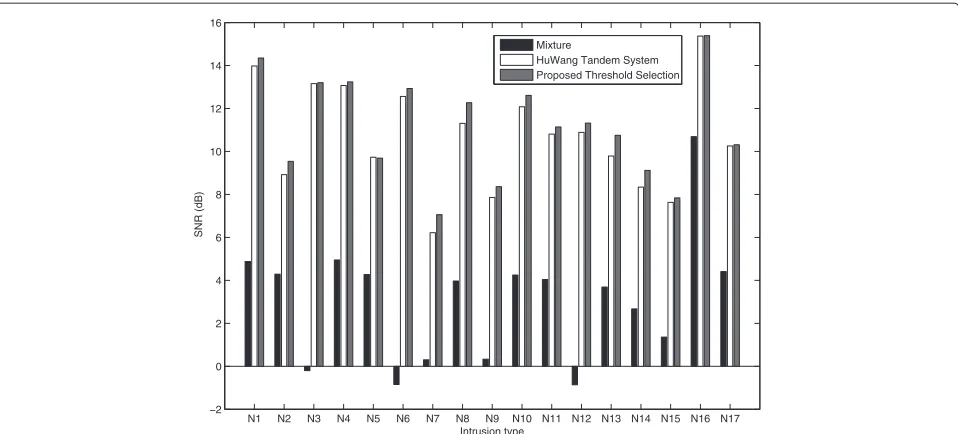
Figure 10Segregation results when threshold selection is applied.SNR results for segregated speech and mixtures for a corpus of speech and various intrusions when threshold selection method is applied.
whereS0(n)is the original speech andSˆ(n)is the segre-gated speech.
The average SNR gain over the conventional method, denoted asSG, is calculated as follows
SG=SP−SC (21)
whereSPis the average SNR result generated by the
pro-posed threshold selection method and SC is the result
generated by the conventional constant threshold. Figure 8 shows the SG results at different values of α
from 0.8 to 1.8 through experiments with various intru-sions. It can be seen that whenα=1.2,SGexhibits a peak
of 0.42 dB, soα=1.2 is appropriate in our method.
3.2 Comparison of complementing
Similar to the selection of α, in smoothing stage, to compare the results between complementing in the full-frequency and the low-full-frequency range, the average SNR gain over the conventional smoothing method, denoted asSG, is used as the criterion. Here,SG is calculated as
follows
SG =SP −SC (22)
whereSP is the average SNR result after complementing
by morphological image processing andSC is the result
generated by conventional smoothing method.
Figure 9 shows SG results of complementing in
full-frequency and low-full-frequency range, respectively. Each
column in the figure represents the average SG value
of ten utterances. As shown in Figure 9, in most noise conditions, it has a better SNR improvement to comple-ment the mask only in the low-frequency rather than the full-frequency range.
Table 1 SNR results when threshold selection is applied
Intrusion Mixture Hu–Wang tandem system
Threshold selection
N1 4.88 13.98 14.35
N2 4.29 8.92 9.54
N3 −0.20 13.16 13.20
N4 4.95 13.07 13.24
N5 4.27 9.73 9.69
N6 −0.85 12.56 12.93
N7 0.30 6.22 7.06
N8 3.97 11.31 12.27
N9 0.33 7.86 8.36
N10 4.25 12.08 12.61
N11 4.04 10.81 11.14
N12 −0.86 10.89 11.32
N13 3.69 9.79 10.75
N14 2.67 8.34 9.12
N15 1.36 7.63 7.84
N16 10.69 15.37 15.39
N17 4.41 10.26 10.31
3.3 System evaluation
Since two novel techniques are proposed in this arti-cle, the evaluation for the proposed system is provided separately as follows.
Figure 10 shows the segregation results when proposed threshold selection stage is applied. The columns in the figure represent the average SNR value of ten mixtures in the test database and segregated speech by conventional and proposed threshold selection method, respectively. The comparison among the results of the tandem sys-tem and the proposed method for speech separation is presented in Table 1.
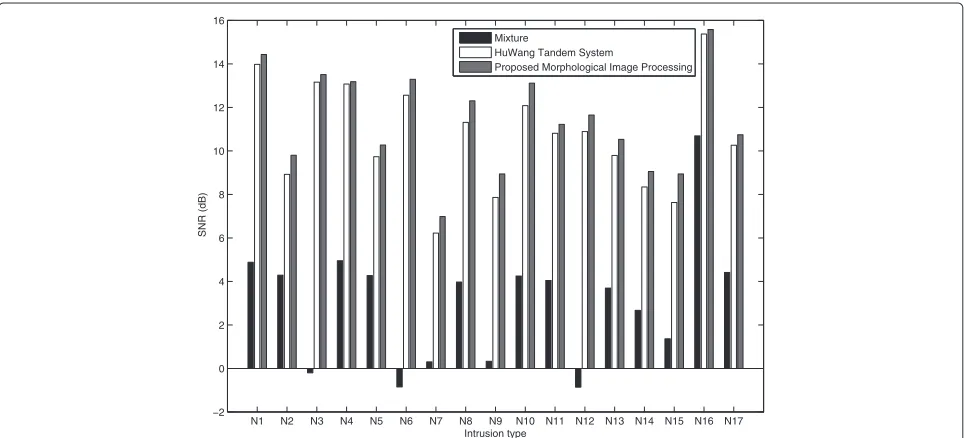
Figure 11 and Table 2 show the segregation results when morphological image processing smoothing stage is applied.
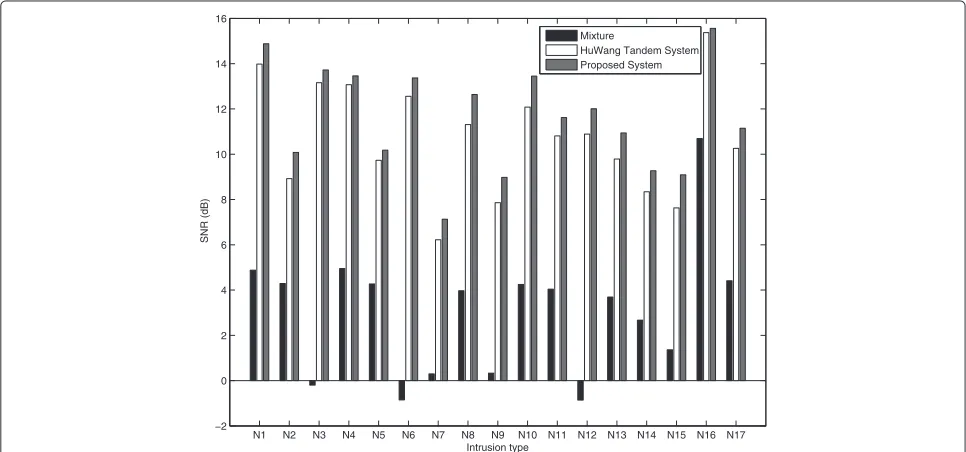
The final segregation results are shown in Figure 12 and Table 3. As shown in the above tables, we can see that the proposed method improves the SNR by 8.55 dB on average for all noise conditions, whereas the tandem system improves by 7.63 dB compared with no processing case. It is proven that the proposed model performs better than the tandem system in SNR improvement.
Despite its common use, SNR criterion does not pro-vide much information about how different the seg-regated speech is from the original one. Here, we employ two complementary error measures to evalu-ate the performance by comparing the resynthesized speech from estimated mask with ideal binary mask (IBM) [5]:
(1) The percentage of energy lossPEL:
PEL=
n
e21(n)
n
I2(n) (23)
Here,e1is the signal presenting in the original
speech but missing from the segregated one.I(n)is the speech resynthesized from the IBM. To obtaine1,
we construct a new mask by labeling the T-F units which is active in IBM but inactive in final target stream.e1is the waveform resynthesized from the
mixture and the mask.
(2) The percentage of noise residuePNR:
PNR=
n
e22(n)
n
O2(n) (24)
Here,e2is the energy presenting in the segregated
signal but not existing in the original one.O(n)is the segregated speech obtained by CASA system. Similar toe1, a new mask is constructed by labeling the T-F
units which is inactive in IBM but active in final target stream.e2is the waveform resynthesized from
the mixture and the mask.
The two criteria provide a better reflection about the difference between original and segregated speech. The better the performance is, the lowerPELandPNRwill be, and vice versa. The results of the energy loss and noise
N1 N2 N3 N4 N5 N6 N7 N8 N9 N10 N11 N12 N13 N14 N15 N16 N17
−2 0 2 4 6 8 10 12 14 16
Intrusion type
SNR (dB)
Mixture
HuWang Tandem System
Proposed Morphological Image Processing
Table 2 SNR results when morphological image processing is applied
Intrusion Mixture Hu–Wang tandem system
Morphological image processing
N1 4.88 13.98 14.43
N2 4.29 8.92 9.80
N3 −0.20 13.16 13.51
N4 4.95 13.07 13.18
N5 4.27 9.73 10.27
N6 −0.85 12.56 13.29
N7 0.30 6.22 6.98
N8 3.97 11.31 12.30
N9 0.33 7.86 8.94
N10 4.25 12.08 13.11
N11 4.04 10.81 11.22
N12 −0.86 10.89 11.65
N13 3.69 9.79 10.53
N14 2.67 8.34 9.05
N15 1.36 7.63 8.94
N16 10.69 15.37 15.58
N17 4.41 10.26 10.74
Average 3.07 10.70 11.38
residue are shown in Tables 4, 5, and 6. Since the mixture contains all the original speech information, thePELof the mixture is 0.
From the final results, it can be seen that the pro-posed system has cutPNRof the mixture by 25.36%. It has
Table 3 The final SNR results
Intrusion Mixture Hu–Wang tandem system
Proposed system
N1 4.88 13.98 14.88
N2 4.29 8.92 10.08
N3 −0.20 13.16 13.72
N4 4.95 13.07 13.46
N5 4.27 9.73 10.18
N6 −0.85 12.56 13.37
N7 0.30 6.22 7.13
N8 3.97 11.31 12.64
N9 0.33 7.86 8.98
N10 4.25 12.08 13.45
N11 4.04 10.81 11.62
N12 −0.86 10.89 12.01
N13 3.69 9.79 10.94
N14 2.67 8.34 9.27
N15 1.36 7.63 9.09
N16 10.69 15.37 15.56
N17 4.41 10.26 11.15
Average 3.07 10.70 11.62
improved bothPEL andPNR compared with the tandem system by 1.43 and 1.08%, respectively.
The criteria we have used above such as SNR, PEL andPNR, do not always reflect the objective speech qual-ity of the segregated speech. To evaluate the segregated speech quality further, we use the perceptual evaluation
N1 N2 N3 N4 N5 N6 N7 N8 N9 N10 N11 N12 N13 N14 N15 N16 N17
−2 0 2 4 6 8 10 12 14 16
Intrusion type
SNR (dB)
Mixture
HuWang Tandem System Proposed System
Table 4 ThePELandPNRresults when threshold selection is applied
Intrusion Threshold selection Hu–Wang tandem Mixture system
PEL(%) PNR(%) PEL(%) PNR(%) PNR(%)
N1 3.28 2.21 3.34 2.46 27.11
N2 4.89 5.17 4.76 6.08 29.50
N3 6.11 5.50 6.24 5.62 40.56
N4 3.01 5.47 3.03 5.82 22.01
N5 2.58 1.23 2.39 1.64 9.77
N6 4.77 2.08 4.65 2.17 46.31
N7 6.04 6.15 6.19 6.63 36.51
N8 6.95 1.14 7.07 3.23 18.43
N9 7.20 4.98 7.49 5.21 29.46
N10 3.80 0.56 3.84 0.58 11.77
N11 5.85 2.28 6.38 3.02 20.73
N12 4.49 3.23 4.67 3.71 76.79
N13 4.35 2.93 5.09 3.12 13.76
N14 5.95 4.27 6.03 4.80 23.16
N15 4.16 4.60 4.18 5.78 26.84
N16 2.24 2.72 2.03 2.89 6.64
N17 6.08 6.20 6.37 6.94 43.07
Average 4.81 3.57 4.93 4.10 28.38
Table 5 ThePELandPNRresults when morphological image processing is applied
Intrusion Morphological Hu–Wang tandem Mixture image processing system
PEL(%) PNR(%) PEL(%) PNR(%) PNR(%)
N1 2.98 2.08 3.34 2.46 27.11
N2 4.96 5.05 4.76 6.08 29.50
N3 5.81 4.06 6.24 5.62 40.56
N4 2.64 4.91 3.03 5.82 22.01
N5 1.89 1.07 2.39 1.64 9.77
N6 1.98 1.92 4.65 2.17 46.31
N7 5.70 5.28 6.19 6.63 36.51
N8 6.19 0.88 7.07 3.23 18.43
N9 4.32 4.87 7.49 5.21 29.46
N10 2.55 0.56 3.84 0.58 11.77
N11 4.01 2.89 6.38 3.02 20.73
N12 2.05 2.98 4.67 3.71 76.79
N13 4.43 2.44 5.09 3.12 13.76
N14 4.81 3.95 6.03 4.80 23.16
N15 3.79 4.46 4.18 5.78 26.84
N16 1.66 1.94 2.03 2.89 6.64
N17 3.70 6.33 6.37 6.94 43.07
Average 3.73 3.27 4.93 4.10 28.38
Table 6 The finalPELandPNRresults
Intrusion Proposed Hu–Wang tandem Mixture system
PEL(%) PNR(%) PEL(%) PNR(%) PNR(%)
N1 2.77 1.94 3.34 2.46 27.11
N2 5.03 3.95 4.76 6.08 29.50
N3 5.92 4.08 6.24 5.62 40.56
N4 2.11 4.73 3.03 5.82 22.01
N5 1.93 1.01 2.39 1.64 9.77
N6 1.70 1.88 4.65 2.17 46.31
N7 5.21 6.23 6.19 6.63 36.51
N8 5.77 0.69 7.07 3.23 18.43
N9 3.95 4.72 7.49 5.21 29.46
N10 2.06 0.42 3.84 0.58 11.77
N11 3.22 1.89 6.38 3.02 20.73
N12 2.01 2.19 4.67 3.71 76.79
N13 3.14 2.25 5.09 3.12 13.76
N14 4.96 3.62 6.03 4.80 23.16
N15 3.83 3.72 4.18 5.78 26.84
N16 1.84 1.87 2.03 2.89 6.64
N17 4.06 6.10 6.37 6.94 43.07
Average 3.50 3.02 4.93 4.10 28.38
Table 7 The PESQ results
Intrusion Hu–Wang Threshold Morphological Proposed
tandem selection image system
system processing
N1 2.340 2.376 2.382 2.391
N2 1.675 1.806 1.739 1.746
N3 2.282 2.304 2.311 2.309
N4 2.233 2.239 2.340 2.376
N5 1.808 1.821 1.885 1.915
N6 1.834 1.852 1.921 1.934
N7 1.587 1.603 1.642 1.663
N8 1.725 1.682 1.746 1.752
N9 1.529 1.545 1.550 1.563
N10 1.583 1.596 1.614 1.618
N11 1.673 1.680 1.774 1.803
N12 1.607 1.642 1.768 1.745
N13 1.438 1.445 1.465 1.488
N14 1.626 1.693 1.702 1.723
N15 1.451 1.462 1.483 1.499
N16 1.705 1.643 1.719 1.708
of speech quality (PESQ) criterion further for compari-son. This evaluation method has been proposed by the International Telecommunication Union (ITU) under the recommendation P.862 [19]. The higher values of PESQ mean better performance. As shown in Table 7, the supe-riority of the proposed method compared to that of the Hu–Wang tandem system is illustrated. It can be seen that the threshold selection has a better performance in PESQ improvement than the conventional threshold under most intrusion conditions except N8 and N16 while morphological image processing smoothing increases the criterion under all conditions.
From the experiment results by different criteria, it is proven that the proposed model has a better performance.
4 Conclusions
This article concentrates on the improvement for the ini-tial segmentation and smoothing stage in CASA system. We set different thresholds in each channel to label the T-F units based on the response energy feature due to the unknown distribution of the intrusions while the tan-dem system uses constant threshold. As CASA system performs speech segregation based on the various fea-tures, it always produces broken auditory elements in the mask, which leads to the missing portions of the segre-gated signal. To solve this problem, morphological image processing is introduced to the smoothing stage for com-plementing and pruning the mask map. We evaluated the separation performance of the proposed system and compared it with the Hu–Wang tandem system for the speech segregation tasks with artificially mixed speech data. The comparison shows that the proposed method has a better performance by improving the average SNR and PESQ while cutting the energy loss and noise residue rate effectively.
Abbreviations
AM: amplitude modulation; CASA: computational auditory scene analysis; IBM: ideal binary mask; ITU: International Telecommunication Union; PESQ: perceptual evaluation of speech quality; SNR: signal-to-noise ratio.
Competing interests
The authors declare that they have no competing interests.
Acknowledgements
This study was supported by the National Natural Science Foundation of China (Grant nos. 60903186, 61271349).
Received: 20 April 2012 Accepted: 5 November 2012 Published: 12 January 2013
References
1. A Bregman,Auditory Scene Analysis. (MIT Press, Cambridge, MA, 1990) 2. D Wang, G Brown,Computational Auditory Scene Analysis: Principles,
Algorithms and Applications. (IEEE Press, New Jersey, 2006) 3. G Brown, M Cooke, Computational auditory scene analysis. Comput
Speech Lang.8, 297–336 (1994)
4. D Wang, G Brown, Separation of speech from interfering sounds based on oscillatory correlation. IEEE Trans. Neural Netw.10(3), 684–697 (1999)
5. G Hu, D Wang, Monaural speech segregation based on pitch tracking and amplitude modulation. IEEE Trans. Neural Netw.15(5), 1135–1150 (2004) 6. G Hu, D Wang, An auditory scene analysis approach to monaural speech
segregation,Topics in Acoustic Echo and Noise Control. (E Hansler, G Schmidt, eds.) (Springer, New York, 2006), pp. 485–515
7. G Hu, D Wang, A tandem algorithm for pitch estimation and voiced speech segregation. IEEE Trans. Audio Speech Lang. Process.18(8), 2067–2079 (2010)
8. G Hu, D Wang, Auditory segmentation based on onset and offset analysis. IEEE Trans. Audio Speech Lang. Process.15(2), 396–405 (2007)
9. G Hu,Monaural speech organization and segregation. (The Ohio State University, PhD thesis, 2006)
10. G Hu, D Wang, Segregation of unvoiced speech from non-speech interference. J. Acoust. Soc. Am.124, 1306–1319 (2008) 11. K Hu, D Wang, Unvoiced speech segregation from nonspeech
interference via CASA and spectral subtraction. IEEE Trans. Audio Speech Lang. Process.19(6), 1600–1609 (2011)
12. Y Shao, S Srinivasan, Z Jin, D Wang, A computational auditory scene analysis system for speech segregation and robust speech recognition. Comput. Speech Lang.24, 77–93 (2010)
13. R Meddis, et al., Simulation of auditory-neural transduction: further studies. J. Acoust. Soc. Am.83(3), 1056–1063 (1988)
14. D Wang, Tandem algorithm for pitch estimation and voiced speech segregation (2010). http://www.cse.ohio-state.edu/pnl/software.html, Accessed 23 September 2012
15. D Wang, G Hu,Unvoiced speech segregation, vol. 5. (IEEE, Toulouse, 2006), pp. 953–956
16. Y Shao, D Wang, Model-based sequential organization in cochannel speech. IEEE Trans. Audio Speech Lang. Process.14(1), 289–298 (2006) 17. C Rafael, E Richard, L Steven,Digital image processing using MATLAB
(Publishing House of Electronics Industry, (Beijing, 2009)
18. Y Lee, O Kwon, Application of shape analysis techniques for improved CASA-based speech separation. IEEE Trans. Consum. Electron.55(1), 146–149 (2009)
19. R Pichevar, J Rouat, A quantitative evaluation of a bio-inspired sound segregation technique for two-and three-source mixtures sounds,Lecture Notes in Computer Science, vol. 3445. (Springer, Berlin, 2004), pp. 430–435
doi:10.1186/1687-4722-2013-2
Cite this article as:Yuet al.:Improved monaural speech segregation based
on computational auditory scene analysis.EURASIP Journal on Audio, Speech,
and Music Processing20132013:2.
Submit your manuscript to a
journal and benefi t from:
7Convenient online submission 7Rigorous peer review
7Immediate publication on acceptance 7Open access: articles freely available online 7High visibility within the fi eld
7Retaining the copyright to your article