Copyright © 2016 IJECCE, All right reserved
An Integrated Adaptive Histogram Equalization Based
Genetic Algorithm for Performance Enhancement of
Colored Images
Rimpi Mahajan1, Dr. Ajay Kumar2, Dr. Amita3 Beant College of Engineering and Technology, Gurdaspur1,2, Bucc, Batala3
India
Abstract – In digital image processing, image enhancement plays a vital role. A new algorithm is proposed in this paper, which utilises genetic algorithm integrated with adaptive histogram equalization to enhance the results. Genetic algorithm has ability to find optimistic adjustment factor for better image enhancement. Therefore provides more optimistic results than available methods. Also to reduce ringing artifacts further adaptive histogram equalization is used. The main scope of this work is to apply proposed technique for colored infrared images. The design and implementation has been done in MATLAB using image processing toolbox. The comparison among the genetic algorithm and proposed technique has shown that the proposed technique outperforms over the genetic algorithm based image enhancement.
Keywords – Genetic Algorithm (GE), Image Enhancement (IE), Transform Domain.
I. INTRODUCTION
Image Enhancement is the phenomenon of transforming a picture so that the impact is more effective than the actual for particular applications. Image enhancement methodologies upgrades the picture’s contrast, brightness properties, removal of its noise contents or sharpen its detail. Image enhancement involves techniques to accentuate or sharpen the image features such as edges, boundaries or contrast to make a graphic display more useful for display and analysis. Such images with good contrast and visual quality are required for all important areas of image processing. The inherent information content is not increased by applying enhancement techniques but there is an increase in the dynamic range of chosen factors [6].It improves the quality of the image by extracting critical details of the images to improve the interpretability or perception of the image for human viewers. Enhancement may be used to restore an image that has suffered some kind of deterioration due to the optics, electronics and/or environment or to enhance certain features of an image[26]. IE accentuates or sharpens image features such as edge boundaries or contrast to make a graphic display more beneficial to further image applications.
IE has been focused mostly to improve visual perception of images that are unclear because of blur [25].. IE is applied in every field where images are ought to be understood and analyzed. It simply means, transforming an image f into image g using T. (where T is the transformation). The values of pixels in images f and g are denoted by r and s, respectively. The pixel values r and s are related by the expression (1),
s=T(r) (1) where T is a transformation that maps a pixel value r into a
pixel value s. The results of this transformation are mapped into the grey scale range as we are dealing here only with grey scale digital images. So, the results are mapped back into the range [0, L-1], where L=2k, k being the number of bits in the image being considered. For instance, for an 8-bit image the range of pixel values will be [0, 255][3].
II. METHODS OF IMAGE ENHANCEMENT
The enhancement methods can broadly be divided into the following two categories:
• Spatial Domain Methods
• Frequency Domain Methods
a) Spatial Domain Methods
A spatial domain technique directly deals with the image pixels. The pixel values are manipulated to achieve desired enhancement. Spatial domain processes are denoted by the expression
g(x,y)=P[f(x,y)] (2) where f(x, y) is the input image, g(x, y) is the processed
image, and P is an operator on f, defined over some neighbourhood of (x, y). In addition, P can operate on a set of input images, such as performing the pixel-by-pixel sum of K images for noise reduction.
b) Frequency Domain Methods
In frequency domain methods, the image is first transformed into frequency domain. All the enhancement operations are performed on the Fourier transform of the image and then the Inverse Fourier transform is performed to get the resultant image. These enhancement operations are performed in order to modify the image brightness, contrast or the distribution of the grey levels. As a consequence the pixel value (intensities) of the output image will be modified according to the transformation function applied on the input values[3].
III. GENETIC ALGORITHM
Copyright © 2016 IJECCE, All right reserved (GA) is a model of machine learning which derives its
behavior from a metaphor of the processes of evolution in nature[21] .A group of guessed solutions form a population, whose first generation may be chosen at random. A second generation is formed by ‘mating’ pairs of the population to form ‘offspring’ solutions, and allowing a mixture of the parents and offspring to survive to form a new generation .Usually those solutions which are fittest have a better chance of surviving.
The main steps GAs are[12]:
i) Initializing the population of possible solutions . ii) Calculation of an evaluation i.e. fitness function that
plays the role of the environment, rating solution in terms of their fitness.
iii) Definition of genetic operators (selection, crossover, mutation) that alter the composition of children during reproduction.
iv) Establishing values for the parameters (population size, probabilities of applying genetic operators) that the genetic algorithm uses.
GA’s are a class of randomized, parallel search optimization procedures inspired by the mechanisms of natural selection, the process of evolution [32] .GA performs efficient search in global spaces to get an optimal solution[19]. GA’s operate iteratively on a population of structures, each of which represents a candidate solution to the problem, encoded as a string of symbols (i.e., chromosome). A randomly generated set of such strings forms the initial population from which the GA starts its search. Three basic genetic operators guide this search: selection, crossover and mutation. Evaluation of each string is based on a fitness function which is problem-dependent .The fitness function determines which of the candidate solutions are better. Selection probabilistically filters out poor solutions and keeps high performance solutions for further investigation. Mutation is a very low probability operator that plays the role of restoring lost genetic material. Crossover in contrast is applied with high probability. In computer world, genetic material is replaced by strings of bits and natural selection replaced by fitness function [16].
Genetic operators used in genetic algorithms maintain genetic diversity. Genetic diversity or variation is a necessity for the process of evolution. Based on individual fitness value, these algorithms use the operators such as selection, crossover and mutation to get the next generation that may contain chromosomes providing better fitness [20]. Genetic operators are analogous to those which occur in the natural world:
• Population size
• Selection
• Crossover
• Mutation
a) Population Size
The performance of a GA is often sensitive to the quality of its initial population. The "goodness" of the initial population depends both on the average fitness of individuals in the population and the diversity in the population. Losing on either count tends to produce a poor GA.
Population size says how many chromosomes are in population (in one generation).If there are only few chromosomes, then GA would have a few possibilities to perform crossover and only a small part of search space is explored. If there are many chromosomes, then GA slows down.
b) Selection
The Selection operator determines which solutions are to be preserved and allowed to reproduce and which ones deserve to die out. . The selection operator is carefully formulated to ensure that better members of the population (with higher fitness) have a greater probability of being selected for mating or mutation [13].
The primary objective of the selection operator is as follows:
• To emphasize the good solutions and eliminate the bad solutions in a population while keeping the population size constant. “Selects the best, discards the rest” identifies the good solutions in a population.
• Make multiple copies of the good solutions.
• Eliminate bad solutions from the population so that multiple copies of good solutions can be placed in the population[31].
c) Crossover
Crossover is a genetic operator that combines two
chromosomes(parents) to produce a new
chromosome(offspring).It involves swapping of genes or sequence of bits in the string between two individuals[20].It occurs during evolution according to user definable crossover probability.
d) Mutation
In natural evolution, mutation is a random process where one allele of a gene is replaced by another to produce a new genetic structure. In GA, mutation is applied with low probability, typically in the range 0.001 ad 0.01, and modifies elements in the chromosomes. It takes place after the crossover gets performed and it prevent falling all solutions in population into local optimum of the problem being solved.
IV COMPONENTS OF GENETIC ALGORITHM
i) Cost Function
The goal of GAs is to solve an optimization problem defined by parameter involved. The parameters are organized as a vector known as a chromosome. If the chromosome has Nvar variables (N dimensional optimization problem) given by
var 1, 2, 3,... N
p p p p then the
chromosome is written as an array with 1 N× var elements . var
1 2 3
[ , , ,..., N ] chromosome= p p p p
In the case, the variable values are represented as floating numbers. Each chromosome has a cost found by evaluating the cost function at the variables
var 1, 2, 3,...., N
p p p p .
var
1 2 3
( ) ( , , ,... N )
Cost= f chromosome = f p p p p
ii) Initial Population
To begin the process, an initial population of Npop must
Copyright © 2016 IJECCE, All right reserved row begin a 1×Nvar chromosome of continuous values
[15]. Given an initial population of Npop chromosome the
full matrix of Npop×Nvarrandom values are generated. All
variable are normalized to have values between 0 and 1.
iii) Pairing
A set of eligible chromosomes is randomly selected as parents to generate next generation. Each pair produces two off springs that contain traits from each parent. The more similar the two parents, the more likely are the offspring to carry the traits of the parents.
iv) Mating
As for the binary algorithm, two parents are chosen to produce off springs; many different approaches have been tried for crossing over in GAs. The simplest method is to mark a crossover points first, then parents exchange their elements between the marked crossover points in the chromosomes. Consider two parents as
var 1 [ m1,..., mN ]
parent = p p
var 2 [ d1,..., mN ]
parent = p p
Two offspring’s might be method be produced as:
var 1 [ m1, m2, d3, d4, m5, m6,..., mN ]
offspring = p p p p p p p
var 2 [ d1, d2, m3, md4, d5, d6,..., dN ]
offspring = p p p p p p p
v) Natural Selection
The extreme case is selection
N
var points and randomly choosing which of the two parents will contribute its variable at each position. Thus one goes down the line of the chromosomes and, at each variable, randomly chooses whether or not to swap information between the two parents. This method is called uniform crossover [13].vi) Mutation
If care is not taken, the GA can converge too quickly into one region on the cost surface. However, some functions have many local minima. To avoid fast convergence, other areas on the cost surface must be explored by randomly introducing changes, or mutations, in some of the variables.
IV. LITERATURE SURVEY
Daniel et. al [11] proposes an Optimum Green Plane Masking (OGPM) using Enhanced Genetic Algorithm for the contrast enhancement of retinal images. Firstly, the proposed approach is evaluated using the standard test images and real time images. Finally the proposed approach is used for the enhancement of retinal images. Results are analyzed using various performance measures and OGPM shows better enhancement results.
Pal el.al [12] discussed genetic algorithm as a class of highly parallel adaptive search processes for solving a wide range of optimization and machine learning problems.
Sabbah et.al [13] proposed a method based on steady state genetic algorithm( SSGA), with modified fitness function to enhance the colored images and to get more accurate result by removing the noise. Steady State Genetic Algorithm (SSGA) based on Simple Genetic Algorithm (SGA) and Adaptive Genetic Algorithm (AGA)
is developed. Experimental results show that SSGA yields better enhancement than the SGA.
Erlanki et.al [14] proposed genetic algorithm based image enhancement algorithm to improve the images' visual quality. The enhancement algorithm performed well and provided good results in terms of both luminance and contrast enhancement.
Saikrishna et.al [15] proposed a method based on the primitives of color moments. In the method, an image is divided into four segments and the color moments extracted from the segments. The distance between query image mean with the corresponding database images are calculated by using Sum-of-Absolute-Differences. The results lead to the conclusion that the proposed method based on color moments shows better performance than the local histogram method operators.
Orlinb et.al [16] suggested a genetic algorithm for Quadratic Assignment Problem (QAP). In the proposed method the genetic algorithm incorporates many greedy principles in its design and hence, it is referred as a greedy genetic algorithm.. The algorithm is tested on all the benchmark instances of QAPLIB, a well-known library of QAP instances. It is observed experimentally that out of the 132 total instances in QAPLIB of varied sizes, the greedy genetic algorithm obtained the best known solution for 103 instances, and for the remaining instances (except one) found solutions within 1 % of the best known solutions.
Usinskas et.al [17] explored genetic algorithms as the most powerful unbiased optimization techniques for sampling a large solution space. Because of unbiased stochastic sampling, they were quickly adapted in image processing.
Verma et.al [18] discussed image contrast enhancement in the spatial domain using genetic algorithm and its extension based on population based incremental learning (PBIL). Experimental results indicate that if time is not constraint then PBIL has better response as compared to GA.
Genetic algorithm (GA) to solve the Travelling Salesman problem with precedence constraints is given by Moon et.al [19]. TSPPC model using the two-commodity network flow model is developed. The main idea of the proposed GA is a topological sort (TS), which is defined as an ordering of vertices in a directed graph. For small and medium size problems, optimal solutions are obtained. On a larger size problem, the proposed GA approach generates best solutions. The numerical experiments show that the proposed GA produces an optimal solution and shows better results as compared to the traditional algorithms.
Sharma et.al [20] put forward and discusses applications of Genetic algorithm in different types of software testing techniques such as white box testing, path testing, mutation testing etc. The GA is also used with fuzzy as well as in the neural networks in different types of testing. It is concluded that by using GA, the results and the performance of various testing techniques are improved.
Copyright © 2016 IJECCE, All right reserved optimization depends on the chromosome encoding
scheme and involvement of genetic operators as well as on the fitness function. However, it is observed that the quality of image segmentation can be improved by selecting the parameters in an optimized way.
Furtadol et.al [22] discussed image classification using Genetic algorithm. The use of different number of classes to classify an image shows not to be effective once the pixels in some of the images can be noted. The time shows to interfere in the classification maximum score. The experiment shows that the time seems to affect the classification more than the number of classes.
The validity and effectiveness of the alternate binary valued Genetic Algorithm coding for structural shape optimization is given by Woon et.al [23]. The developed method is able to identify and remove material that do not significantly contribute to stifness as well as add material to regions in order to effectively increase the structure’s fitness with minimal cost to weight. The research also underscores the ability of this method to design both optimal local details as well as global shapes
Husainy [24] describes the application of Genetic Algorithm for sound compression. Mixing GA with Vector Quantization (VQ) method results in good enhancement for the performance of the proposed method by increasing the compression ratio and saving the SNR in the acceptable level.
Lakshmi et.al[25] deal with medical image enhancement using Genetic Algorithm (GA) and the Morphological filter to sharpen the detected edges thus improving the contrast of the image. The proposed paper uses the concept of Genetic Algorithm which was proved to be the most powerful unbiased optimization techniques for sampling a large solution space.
Mundhada et.al[26] describes image enhancement as the task of applying certain alterations to an input image to obtain a more visually pleasing image. The alteration usually requires interpretation and feedback from a human evaluator of the output resulting image. Enhancement techniques such as alpha rooting operate on the transform domain.. However, these techniques bring about tonal changes in the images and can also generate unwanted artifacts in many cases.
Genetic algorithm used for the weights optimization on a pre-specified neural network applied to decide the value of hello interval of the Ad-hoc on Demand Distance Vector routing protocol of the Mobile Ad-Hoc is given by Dharmistha et.al [27]. Comparative analysis of the algorithm with traditional trained ANN shows that the difference between the two is very much minor approximately less than 0.2.
Garg et al. [28] has provide that the different enhancement methods like gray scale manipulation, filtering and HE are used to enhancing an image.. In this paper comparison different enhancement methods on the basis of the performance analysis methods like PSNR, MSE, NAE, CPSNR and normalized correlation is done.
Roomi and Prabhu et al. [29] provided that for better visualization of low contrast images contrast enhancement method has been used .A new method of histogram equalization that tries to found foreground and background
pixels of an image is applied. Its outcomes show that this algorithm preserves the original image better as compared to other techniques.
Thien Huynh and Thuong Le-Tien [30] have provided a method for preserving the intensity and visual artifacts. For sorting out the original histogram, intensity. The outcome has exposed enhanced the contrast and also preserves the brightness. The outcomes proved the technique superior to others methods in overall brightness, the discrete entropy, the local contrast.
V. PERFORMANCE ANALYSIS
The various parameters such as mean square error, peak signal to noise ratio, root mean square error ,bit error rate has been used for the analysis of images.
1. Mean Square Error Evaluation
In image processing mean square error is the most general measure for performance measurement of the existing method and the coded images. It is straightforward method to design system that decrease the MSE but cannot capture the impurities like blur artifacts. It is computed by using Eq. (3).
MSE =MN fi, jl
− f′i, j 3
Where f (i, j) represents the original (reference) image and f’ (i, j) represents the distorted (modified) image and i and j are the pixel position of the M×N image. MSE is zero when x (i, j) = y (i, j).
2. Peak Signal to Noise Ratio
Peak signal to noise ratio measures the degree of image distortion. It is used to measure the quality between the original image and compressed image. If the value of PSNR is higher, then the quality of reconstructed image is better. PSNR represent the peak error. To measure the PSNR first complete the MSE. Signal in the case of image is the original data and when noise is introduced in the image it becomes error. Peak signal to noise ratio can be calculated by using Eq. (4).
= 10. log"#$%&'( %) *
= 20. log"#,-./-1203 (4)
3. Root Mean Square Error
The root mean square error is a generally used to compute of the difference among values predicted by a model and values actually observed from the surroundings that is being modelled. The RMSE of a model total with respect to the estimated variable '45678 is defined as the square root of the mean squared error by using Eq. (5)
RMSE = :" ∑ ∑ fi, j − f ′i, j
"
" (5)
4. Bit Error Rate
Copyright © 2016 IJECCE, All right reserved
<ER Total number of bits sent 6Number of errors
V. RESEARCH METHODOLOGY
Fig. 1. Flowchart of Proposed Algorithm
Step 1. Select an input image.
Step 2. Apply RGB 2 HSV TRNSFORM on an input
image.
Step 3. Then apply weighted histogram equalization on S
and V components.
Step 4. Then apply genetic algorithm based adaptive
intensity transfer function on S and V, then do boundary smoothing on H, S and V components separately.
Step 5. Then H,S, and V components will be fused means
to combine the decomposed image into a single one. Then apply HSV2RGB transform.
Step 6. After that Adaptive histogram equalization
technique has been applied.
Step 7. Result has been shown in the form of enhanced
image.
VI.
R
ESULTS ANDD
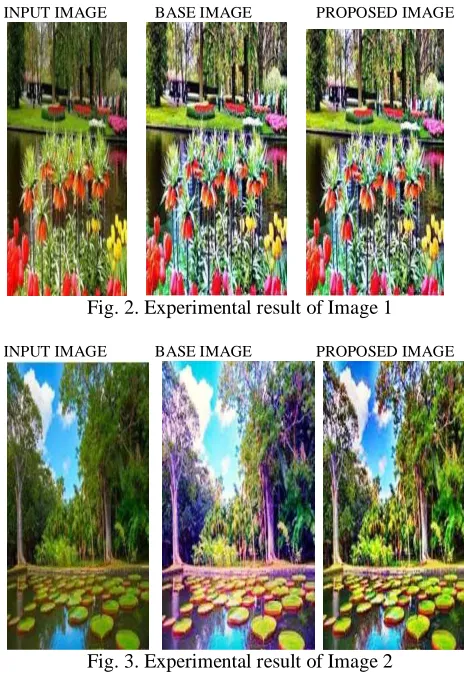
ISCUSSIONIn this research work, total 10 colored images (natural and infrared) are taken in the database for evaluating the algorithm. All images in database are taken in JPG format. The results of applying proposed integrated AHE based GA method over the existing GA technique has clearly shown in the form of images. These images are shown in fig 2.
The MATLAB software used for algorithm
development works on a 2.53 GHz processor with 4 GB RAM. Table 1 shows description of various images which are used in this research work. Images are given along with their formats.
Table1: Images taken for experimental analysis
Image Format Size(KB)
1 .jpg 47.5
2 .jpg 39
3 .jpg 38
4 .jpg 25.3
5 .jpg 42.2
6 .jpg 19.4
7 .jpg 29
8 .jpg 32
9 .jpg 22.7
10 .jpg 35.6
INPUT IMAGE BASE IMAGE PROPOSED IMAGE
Fig. 2. Experimental result of Image 1
INPUT IMAGE BASE IMAGE PROPOSED IMAGE
Fig. 3. Experimental result of Image 2
INPUT IMAGE BASE IMAGE PROPOSED IMAGE
Fig. 4. Experimental result of Image 3
INPUT IMAGE BASE IMAGE PROPOSED IMAGE
Copyright © 2016 IJECCE, All right reserved
INPUT IMAGE BASE IMAGE PROPOSED IMAGE
Fig. 6. Experimental result of Image 5
INPUT IMAGE BASE IMAGE PROPOSED IMAGE
Fig. 7. Experimental result of Image 6
INPUT IMAGE BASE IMAGE PROPOSED IMAGE
Fig. 8. Experimental result of Image 7
INPUT IMAGE BASE IMAGE PROPOSED IMAGE
Fig. 9. Experimental result of Image 8
INPUT IMAGE BASE IMAGE PROPOSED IMAGE
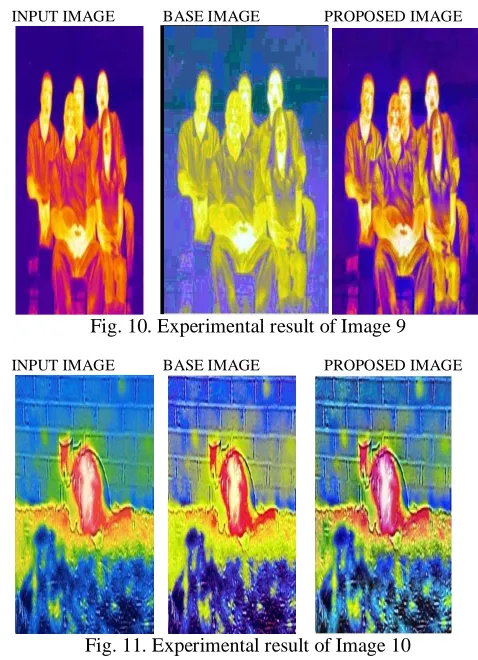
Fig. 10. Experimental result of Image 9
INPUT IMAGE BASE IMAGE PROPOSED IMAGE
Fig. 11. Experimental result of Image 10
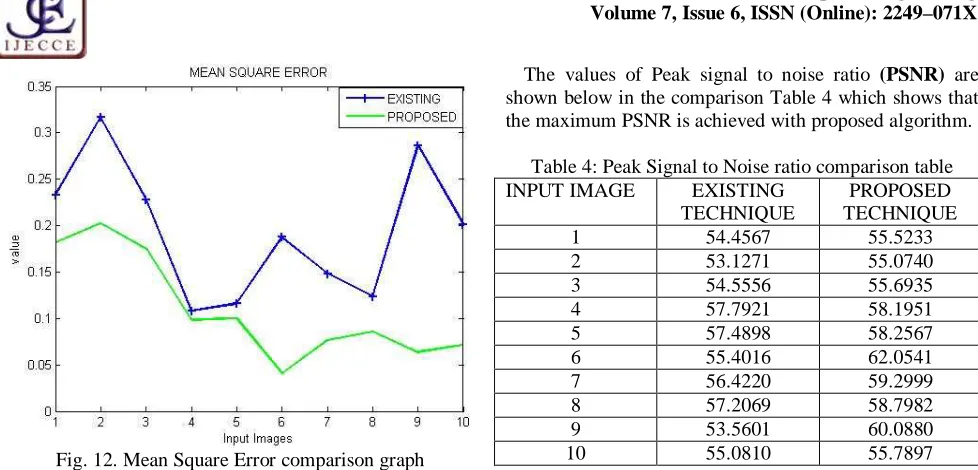
The values of Mean square error (MSE) are shown
below in the comparison Table 2. The proposed algorithm is showing the better results than the existing one as mean square error is reduced in every case.
Table 2: Mean square error comparison table INPUT IMAGE EXISTING
TECHNIQUE
PROPOSED TECHNIQUE
1 0.2330 0.1823
2 0.3165 0.2022
3 0.2278 0.1753
4 0.1081 0.0985
5 0.1159 0.1001
6 0.1875 0.0405
7 0.1482 0.0764
8 0.1237 0.0858
9 0.2865 0.0637
Copyright © 2016 IJECCE, All right reserved Fig. 12. Mean Square Error comparison graph
From the Fig.12, it is revealed that the proposed method show the lower values for mean square error than existing methods.
The values of Root Mean square error (RMSE) are
shown below in the comparison Table 3.Table 3 clearly shows that the RMSE is minimum in the case of the proposed algorithm.
Table 3: Root Mean square error comparison table INPUT
IMAGE
EXISTING TECHNIQUE
PROPOSED TECHNIQUE
1 0.4827 0.4269
2 0.5626 0.4496
3 0.4773 0.4187
4 0.3288 0.3139
5 0.3404 0.3223
6 0.4330 0.2013
7 0.3850 0.2764
8 0.3517 0.2928
9 0.5352 0.2524
10 0.4489 0.4141
Fig. 13. Root Mean Square Error comparison graph
From the Fig. 13, it is revealed that the proposed method shows the lower values for root mean square error than existing method.
The values of Peak signal to noise ratio (PSNR) are
shown below in the comparison Table 4 which shows that the maximum PSNR is achieved with proposed algorithm.
Table 4: Peak Signal to Noise ratio comparison table
INPUT IMAGE EXISTING
TECHNIQUE
PROPOSED TECHNIQUE
1 54.4567 55.5233
2 53.1271 55.0740
3 54.5556 55.6935
4 57.7921 58.1951
5 57.4898 58.2567
6 55.4016 62.0541
7 56.4220 59.2999
8 57.2069 58.7982
9 53.5601 60.0880
10 55.0810 55.7897
Higher value of PSNR leads to high quality of reconstructed image and PSNR is high in proposed technique and as shown in Table 5.
Fig. 14. Peak Signal to Noise Ratio comparison graph
From the Fig. 14, it is revealed that the proposed technique shows the higher values for peak signal noise ratio than existing method.
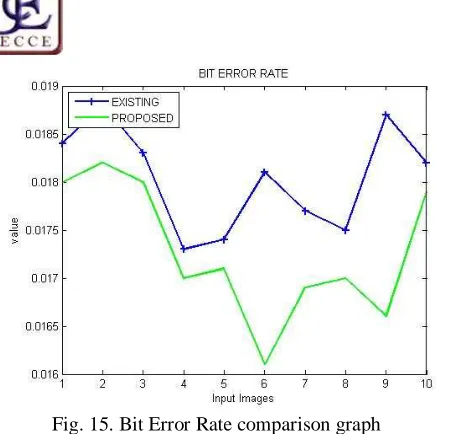
The values of Bit error rate (BER) are shown below in
the comparison Table 5. Table 5 clearly shows that the BER is minimum in case of the proposed algorithm.
Table 5: Bit error rate comparison table
INPUT IMAGE EXISTING
TECHNIQUE
PROPOSED TECHNIQUE
1 0.0184 0.0180
2 0.0188 0.0182
3 0.0183 0.0180
4 0.0173 0.0170
5 0.0174 0.0171
6 0.0181 0.0161
7 0.0177 0.0169
8 0.0175 0.0170
9 0.0187 0.0166
Copyright © 2016 IJECCE, All right reserved Fig. 15. Bit Error Rate comparison graph
From the Fig.15, it is revealed that the proposed method shows the lower values for error than existing method.
VII. CONCLUSION AND FUTURE SCOPE
The image enhancement has been successfully used for improving the quality of poor images by using the various linear and non-linear techniques. The review has shown that most of existing techniques may introduce the color artifacts in case of infrared images.
In order to overcome the above stated limitations, a new algorithm is proposed which utilises genetic algorithm to enhance the results. Also to reduce ringing artifacts further adaptive histogram equalization has been used. The proposed technique has been applied for analysis of infrared images. The design and implementation has been done in MATLAB using image processing toolbox and various parameters like MSE, PSNR, RMSE, BER have been used to evaluate the performance of enhanced images. The comparison among the existing and proposed technique has shown that the proposed technique outperforms over the genetic algorithm based image enhancement.
In near future, dynamic histogram stretching as a post processing technique can be used. Also,the issue of noise has not been considered in this work, so in near future some well-known filter like trilateral filter can be used to remove the effect of the noise from the enhanced images.
REFERENCES
[1] Ahirwar, V. , Yadav, H. and Jain, A.(2013), "Hybrid model for
preserving brightness over the digital image processing,"
Computer and Communication Technology (ICCCT), 4th International Conference on Allahabad, , pp. 48-53.
[2] H. Al-Ghaib and R. Adhami, "An E-learning interactive course
for teaching digital image processing at the undergraduate level in engineering," Interactive Collaborative Learning (ICL),
2012, 15th International Conference on, Villach, 2012, pp. 1-5. [3] Maini, R. and Aggarwal ,H.(2010) , “A Comprehensive
Review of Image Enhancement Techniques” Journals of
Computing, Vol. 2, Issue3, ISSN 2151-9617, pp.8.
[4] Rafael C. Gonzalez, and Richard E. Woods, “Digital Image
Processing”, 2nd edition, Prentice Hall, 2002.
[5] Umbauugh, Scott E. (1998), “Computer Vision and Image
Processing”, PH , New Jersey , pp209.
[6] Jain, A. K (2005), “Fundamentals of Digital Image
Processing” Pearson Prentice Hall, pp.23-285.
[7] Lavania , K.K ,Shivali and Kumar, R. (2012) “ Image
Enhancement using Filtering Techniques” International
Journal on computer Science and Engineering, Vol 4,No 1 ,pp.14-20.
[8] Chein-I Chang and Heinz, D.C.(2000), "Constrained subpixel
target detection for remotely sensed imagery," in Geoscience
and Remote Sensing, IEEE Transactions on , vol.38, no.3, pp.1144-1159.
[9] Jaiswala. A., Upadhyayb. J. and Somkuwar. A.(2014)" Image
denoising and quality measurements by using filtering and wavelet based techniques", in Int. J. Electron. Commun.
(AEU) .
[10] Holland , John H. (1992) ‘Genetic Algorithms’ , Scientific American Journal.
[11] Daniel, E.and Anitha, J. (2015)" Optimum Green Plane
Masking for the Contrast Enhancement of Retinal images using Enhanced Genetic Algorithm”, International Journal for
Light and Electron Optics .
[12] Pal, S.K. , Bhandari, D. and Kundu, M. K. (1995) , “Genetic
algorithms for optimal image enhancement”, Pattern
Recognition Letters 15, pp.261-271.
[13] Sabbah, A.A. and Naoum, R. (2012), "Color Image
Enahncement using Steady State Genetic Algorithm," World of
Computer Science and Information Technology Journal, Vol. 2, No. 6, pp. 184-192.
[14] Erkanli, S., Li, J. and Oguslu, E. (2012), "Fusion of Visual and
Thermal Images using Genetic Algorithm," Bio Inspired
Computational Algorithms and their Applications. Available: www.intenchopen.com, pp. 182-212.
[15] Saikrishna, T.V., Yesubabu,V.A., Anandarao.A and Rani,T.S. (2012), "A Novel Image Retrieval Method Using Segmentation and Color Moments ," Advanced Computing
International Journal, Vol. 3, No. 1, pp. 75-80.
[16] Orlinb, J.C., Tiwaric, A. and Ahujaa, R.K. (2000), "A Greedy
Genetic Algorithm for the Quadratic Assignment Problem,"
Computers & operations Research, Vol. 27, pp. 917-935. [17] Usinskas, A. and Paulinas, M. (2007), "A Survey of Genetic
Algorithms Applications for Image Enhancement and Segmentation," Information Technology and Control, Vol. 36,
No. 3, pp. 278-285.
[18] Verma, A. and Archana (2012), "A Survey on Image Contrast
Enhancement Using Genetic Algorithm," International Journal
of Scientific and Research Publications, Vol. 2, No. 7, pp. 1-5. [19] Moon, C., Kim, J., Choi,G. and Seo, Y. (2002), "An Efficient
Genetic Algorithm for the Travelling Salesman problem with Precedence Constraints," European Journal of Operational
Research, pp. 606-617.
[20] Sharma, C., Sabharwal, S. and Sibal, R. (2013), "A Survey on
Software Testing Techniques using Genetic Algorithm,"
International Journal of Computer Science Issues, Vol. 10, No. 1, pp. 381-393.
[21] Hole, K.R., Gulhane,V.S. and Shellokar,N.D. (2013), "Application of Genetic Algorithm for Image Enhancement
and Segmentation," International Journal of Advanced
Research in Computer Engineering & Technology, Vol. 2, No. 4, pp. 1342-1346.
[22] Furtadol, J.J.,Cail,Z.and Xiaobol,L.(2010), "Digiital Image
Processing:Supervised Classification Using Genetic Algorithm in Matlab Toolbox," Report and Opinion, Vol.2,
No.6, pp.53-61.
[23] Woon, S.Y., Querin, O.M. and Steven, G.P. (2001), "Structural
Application of a Shape Optimization Method based on a Genetic algorithm," in Struct Mutidisc Optimum, Verlag, pp.
57-65.
[24] Mohammed A. F. Al-Husainy(2007)” Sound Data Compression Method Using Genetic Algorithm” Damascus
Univ. Journal Vol. (23)-No. (2).
[25] B.Lakshmi, G.Lingaiah, S.S.Madhavi” An Enhanced Approach
for Medical EDGE ImageEnhancement using Genetic Algorithm” IJCST Vol. 3, Issue 1, Jan. - March 2012.
Copyright © 2016 IJECCE, All right reserved
[27] Dharmistha and Vishwakarma, D. (2012), "Genetic Algorithm Based Weights Optimization of Artificial Neural Networks," International Journal of Advanced Research in Electrical,Electronics and Instrumentation Engineering, Vol. 1, No. 3, pp. 206-211.
[28] Garg, Bhawna Mittal, Sheetal Garg” Histogram Equalization
Techniques for Image Enhancement” International Journal of
Electronics & Communication Technology, 2011
[29] Maragatham, G., S. Md Mansoor Roomi, and T. Manoj Prabu.
"Contrast enhancement by object based Histogram Equalization." Information and Communication Technologies
(WICT), 2011 Wor1d Congress on. IEEE, 2011
[30] Huynh-The, Thien, and Thuong le-Tien. "Brightness preserving weighted dynamic range histogram equalization for image contrast enhancement." Advanced Technologies for
Communications (ATC), 2013 International Conference on. IEEE, 2013
[31] Bhattacharjya, R.K. (2012), "Introduction To Genetic Algorithms," IIT Guwahati, Guwahati, Lecture Notes.
[32] Goldberg, D.: Genetic algorithms in search, optimization, and