69
POWER FACTOR CORRECTION USING STATIC CAPACITOR: A CASE STUDY OF
NIGERIAN 330KV GRID SYSTEM
1Adebayo, I.G. , 2Olaomi A.A. 3Akinkunmi, M. and 4Olayonwa, Paul
1,2,3,4Department of Electronic and Electrical Engineering,
Ladoke Akintola University of Technology, Ogbomoso. P.M.B. 4000, Ogbomoso, Nigeria.
Correspondence:[email protected]
ABSTRACT
This paper work is concerned with the power factor correction using static capacitor being a case study of Nigerian 330kV Grid System. The research involves collection of various data relevant to the study from National Control Centre (NCC), Osogbo. The analysis is limited to the generator buses that have low power factors. Presented in this paper work is also the mathematical modeling of equations involving system monthly and annual savings. Simulations were done using MATLAB software package. The value of the static capacitor adopted and injected in each of the generator buses is 30kVar which is within the acceptable range of 25kVar to 40kVar. Where low power factors were noticed at the generator bus, static capacitor is injected to correct the low power factors especially at those buses. Typical examples are buses 2 (Jebba), 3 (Shiroro), 4 (Sapele), 5 (Delta) and 6 (Afam). The injection of static capacitor further leads to reduction in the load current in each of the generator buses and consequently, an increase in the system annual savings.
Keywords: Power factor, Static capacitor, Generating station, MATLAB, Apparent power, Plant efficiency.
INTRODUCTION
The electrical energy is almost exclusively generated, transmitted and distributed in the form of alternating current. Hence, the question of power factor immediately comes into mind. Most of the loads (e.g. induction motors, arc lamps) are inductive in nature and therefore, have low lagging power factor. Wasted energy capacity, also known as poor power factor, is often overlooked. It can result in poor reliability, safety problems and higher energy costs .Low power factor is also highly undesirable as it causes an increase in current, resulting in additional losses of active power in all the elements of power system from power station generator down to the utilization devices (Mehta and Mehta, 2005, Pamela, 2007). The motors and other inductive equipment in a plant require two types of electric powers. One type is active power (i.e. working power) measured in kilowatt (kW). This is what actually powers the equipment and performs useful work. Another type is the magnetizing power which produces the flux necessary for the operation of inductive devices. The unit of measurement of magnetizing or reactive power is the kilovar (kVAR). The working power (kW) and reactive power (kVAR) together made up apparent power which is measured in
kilovolt-amperes (kVA) (Leon Wasser, 2009, Ray and Davis, 1988, Tse, 2003).
However, the power factor of a circuit is the ratio of active power to the apparent power.
kVA kW power Apparent
power Active factor
Power
(1)
In an inductive circuit, the current lags behind the voltage and the power factor is said to be lagging. However, in a capacitive circuit, current leads the voltage and power factor is leading.
In order to ensure most favorable conditions for a supply system from engineering and economic standpoint, it is important to have power factor as close to unity as possible.
POWER FACTOR CORRECTION
70
larger. (Jason Starck, 2000). In order to correct the power factor, some devices taking leading power should be connected in parallel with the load (Mehta and Mehta, 2005). One of such devices is static capacitor (Hedin and Strump, 1981, Khoudiakev and Nivakin , 1981,). Other devices are synchronous motor, tuned harmonic filters and phase advancers. The capacitor draws a leading current and party or completely neutralizes the lagging reactive component of load current. This raises the power factor of the load (Mehta and Mehta, 2005).ACTIVE, REACTIVE AND APPARENT POWER
It is a known fact that reactive loads such as inductors and capacitors dissipate zero power. However, the fact that they drop voltage and draw current gives the deceptive impression that they actually dissipate power (Jim Lux, 2006). This power is called reactive power and it is measured in Volt-Amps-Reactive (VAR) or Kilovolt-Volt-Amps-Reactive (kVAR) rather than watts (W). The capital letter Q is the mathematical symbol for this reactive power (Theraja and Theraja, 1999).
However, the actual amount of power being used or dissipated in a circuit is the active power and it is measured in Watts (W) or kilowatts (kW). It is symbolized by the letter P. The combination of reactive power and active power is the apparent power and it is the product of a circuit‟s voltage and current without reference to phase angle. Apparent power is measured in the unit of Volt-Amps (VA) or kilovolt-Amps (kVA) and it is symbolized by the capital letter S (Jim Lux, 2006).
As a rule, active power is a function of a circuit‟s dissipative elements, usually resistances (R). Reactive power is a function of a circuit‟s reactance (X). Apparent power is a function of circuit‟s total impedance (Z). There are several power equations relating the three types of power to resistance, reactance and impedance (all using scalar quantities) (Jim Lux, 2006).
R E P R I P power Active P
2 2
,
,
(2)
The unit of active power is W or kW.
X E Q X I Q power active Q
2 2
, ,
Re
(3)
The unit of reactive power is VAR or kVAR.
IE Z E S Z I S power Apparent
S
2 2
,
, (4)
The unit of apparent power is VA or kVA. where
P = Active power Q = Reactive power
S = Apparent power I = Current
R = Resistance X = Reactance Z = Impedance E = Voltage
POWER FACTOR TRIANGLE
Calculation of power factor correction can be illustrated from power triangle. In figure 1, the power
triangle OAB is for the power factor
cos
1, whereas power triangle OAC is for the improved power factor2
cos
. It could be seen that real or active power (OA) does not change with power factor improvement. However, the lagging reactive power (kVAR) of the load is reduced by the power factor correction equipment. Therefore, the improved powerfactor is
cos
2
KVAR2 KVAR1 A
B C
O kW
kVA 1 kVA
2
2
1
Figure 1: Power Factor Correction
Triangle
From figure 1, the leading kVAR supplied by the power factor correction equipment is
AC AB
BC (5)
2
1 kVAR
kVAR
(6)
tan
1tan
2
OA (7)
tan
1
tan
2
kW
(8)Knowing the leading kVAR supplied by the power factor correction equipment, the desired results can be obtained.
Mathematical formulation of equations used in estimating annual savings for installing the power factor correction unit
An inductive load taking a lagging current
I
and a71
which takes a leading reactive component and partly cancels the lagging reactive component of the load.
1 2
1
1
cos
tan
tan
S
kVar
(9)
1 2
1 1
tan
tan
cos
S
kVar
(10) 1 1 1 2cos
tan
tan
S
kVar
(11) 1 1 1 1 2 cos tan tan S kVar (12)
1 1 1 1 1 2 cos cos tan tan S kVar pf (13) 2 2cos
pf (14)where
kVar = injected capacitor and is from 25kVar to 40kVar.
S1 = uncorrected apparent power.
1
lagging angle before capacitor is automatically injected.1 1
cos
pf
= uncorrected power factor. Also,1 1
cos
S
P
(15)1
S
factor
power
d
uncorrecte
at
kVA
2 2 2cos
pf
P
P
S
factor
power
corrected
at
kVA
(16) 3 2 1S
S
S
correction
factor
power
to
due
nullified
kVA
(17)Monthly savings = N332.10 x S3 = K (18) Annual savings = 12 x K (19) where,
P = active power
1
lagging angle before capacitor is automatically injected.
2
lagging angle after capacitor is automatically injected.S1 = uncorrected apparent power. S2 = corrected apparent power.
S3 = nullified apparent power due to power factor correction.
K = monthly savings in naira
2 2
cos
pf
= corrected power factorN332.10 = the kVA rating for three phase commercial power consumption.
Mathematical formulation of percentage reduction in current
1 1
cos
S
P
1
1cos
3VI
P (20)
1 1
cos
3
V
P
I
(21)2 2
cos
3V
P
I (22)
100 Re % 1 2 1 X I I I current induction (23)
where,
P = active power
1
lagging angle before capacitor is automatically injected.
2
lagging angle after capacitor is automatically injected.S1 = uncorrected apparent power. V = 0.415kV = three phase voltage
I1 = load current at uncorrected power factor
I2 = expected load current at corrected power factor
RESULTS AND DISCUSSION
DATA COLLECTED FROM NATIONAL
CONTROL CENTRE (NCC), OSOGBO
Table 1 shows the rated apparent power and their corresponding power factors for seven generating stations.
From Table 1, it is observed that five (5) generating stations (generator buses) have low power factors and hence, the need for improvement.
THE RESULTS OF IMPROVED POWER FACTOR OF EACH GENERATING STATIONS
72
Table 1: Rated Apparent Power and Power Factor of Generating Stations (Base Case)
S/N GENERATING STATIONS
RATED APPARENT POWER (kVA)
POWER FACTOR
01 KAINJI 145.0000 0.9500 02 JEBBA 119.0000 0.8500 03 SHIRORO 176.5000 0.8500 04 EGBIN 276.9000 0.9000 05 SAPELE 110.0000 0.8000 06 DELTA 133.7500 0.8500 07 AFAM 110.0000 0.8000
Table 2: Results obtained when static capacitor was injected compared with the Base case results
S/N Generating stations (Generator Buses)
Apparent power (KVA) Without Static capacitor
Apparent power (KVA) With Static capacitor
Power Factors (Without static capacitor)
Power Factors (With static capacitor)
01 JEBBA 119.0000 106.3004 0.8500 0.9515 02 SHIRORO 176.5000 162.7072 0.8500 0.9221 03 SAPELE 110.0000 95.0789 0.8000 0.9255 04 DELTA 133.7500 120.6716 0.8500 0.9421 05 AFAM 110.0000 95.0789 0.8000 0.9255
Figure 2: Comparism of Apparent Power with and without Static Capacitor
Figure 3:Comparism of power factor with and without Static capacitor
THE RESULTS OF ANNUAL SAVINGS OF EACH GENERATING STATION
Table 3 shows the monthly and annual savings of each generating station.
Table 3: Monthly and Annual Savings of each Generating Station
S/N GENERATIN
G STATIONS
MONTHLY SAVINGS (N)
ANNUAL SAVINGS (N)
01 JEBBA 4,218.00 50,611.00
02 SHIRORO 4,581.00 54,967.00
03 SAPELE 4,955.00 59,464.00
04 DELTA 4,343.00 52,120.00
05 AFAM 4,955.00 59,464.00
THE RESULTS OF PERCENTAGE REDUCTION IN CURRENT OF EACH GENERATING STATIONS
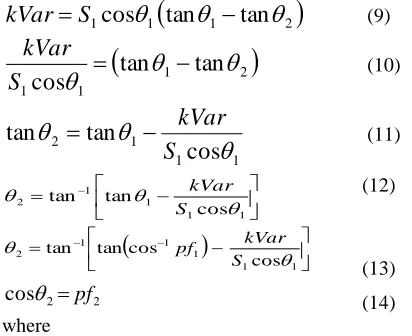
Table 4 shows the load currents at uncorrected power factors, the expected load currents at corrected power factors and the percentage reduction in current for each generating station.
Table 4: Percentage Reduction in Current of each Generating Station
S/N GENERATING STATIONS
LOAD CURRENT AT UNCORRECTED POWER FACTOR (A)
LOAD CURRENT AT CORRECTED POWER FACTOR (A)
REDUCTION IN CURRENT (%)
01 JEBBA 165.5535 147.8857 10.6719
02 SHIRORO 245.5478 226.3591 7.8146
03 SAPELE 153.0326 132.2743 13.5646
04 DELTA 186.0737 167.8790 9.7783
05 AFAM 153.0326 132.2743 13.5646
Figure 4: Comparism of load current with and without static capacitor
0 20 40 60 80 100 120 140 160 180 200
AP
P
AR
E
NT
P
OWE
R
(k
VA
)
WITHOUT STATIC CAPACITOR WITH STATIC CAPACITOR
0.7 0.75 0.8 0.85 0.9 0.95 1
Po
w
er
fa
ct
o
r
WITHOUT STATIC CAPACITOR WITH STATIC CAPACITOR
0 50 100 150 200 250 300
JEBBA SHIRORO SAPELE DELTA AFAM
Load
cur
re
nt
(A
)
73
KAINJI GB1
B1
BIRNIN-KEBBI
B8
GB3
B3
SHIRORO JEBBA (T.S)
JEBBA (G.S)
B9
GB2
B2
OSOGBO B14
AYEDE
B15
IKEJA-WEST
B18 B16
AKANGBA
B23
EGBIN B7
GB7 B24
AJA
OKPAI
B26
GB6
AFAM IV B6 ALAOJI B21
ONITSHA NEW HAVEN
B19 B22
DELTA IV
B5
GB5
ALADJA
B20
SAPELE GB4
B4
AJAOKUTA
B17
KATAMPE
B25
JOS
B12
GOMBE
B13
KANO
B11
KADUNA
B10
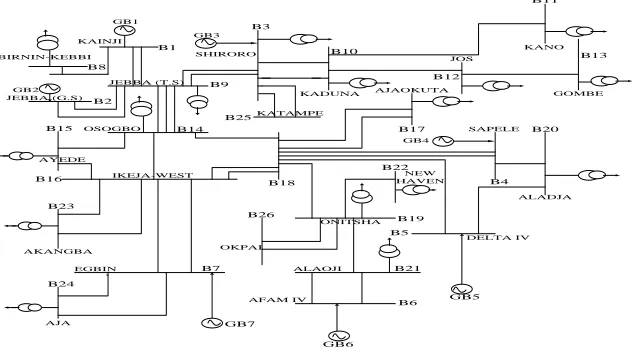
Figure 5: The single line diagram of the current 330kv Transmission Network
Source: (National Control Centre, Power Holding Company of Nigerian, Nigeria, 2007 )
DISCUSSION OF RESULTS
Five generating stations (generator buses) were taken into consideration among other generating stations due to their low power factors. These include Jebba (0.85), Shiroro (0.85), Sapele (0.80), Delta (0.85) and Afam (0.80). Also, the range of injected capacitor which was used in this work is between 25kVar to 40kVar. The provision of automatic control for capacitors below 25kVar is not usually economical. In the course of this analysis, the value of injected capacitor used is 30kVar.
By comparing the uncorrected apparent power with the corrected ones as shown in figure 2, it is observed that the corrected apparent powers are lower than the uncorrected ones in each generating stations. Also, by comparing uncorrected power factors with the corrected ones as shown in figure 3, it is observed that power factors with static capacitor are higher than the uncorrected ones in each generating station. Moreover, by comparing the load currents at uncorrected power factors with the load currents at corrected power factors as shown in figure 4, it is observed that the load currents at corrected power factors are lower than the load currents at uncorrected power factors in each generating station. In addition, the annual savings of each generating station after power factor correction are of reasonable values.
CONCLUSION
Power factor correction using static capacitor which is a case study of Nigerian 330kV grid system has been successfully carried out. The power factors of the generator buses considered that is, Shiroro (0.92),
Sapele (0.93), Afam (0.93), Delta (0.94) and Jebba (0.95) improved with the application of the static capacitor when compared with the initial values (base case) of those buses. Also, apparent powers are lower than the uncorrected ones. Both the apparent powers and power factors obtained in the course of reinforcing the system with static capacitor were used to calculate the annual savings of each generating station. Also, the load currents at corrected power factors are lower than the load currents at the uncorrected ones, specifically between 7-14% reduction in load current in each generating station. Hence, with the injection of static capacitor for power factor correction, the overall performance of the power system which can increase switchgear, starter, and motor life is improved. The bottom line of which is protection, efficiency, and maximum savings.
REFERENCES
Hedin R.A. and Strump K.B. (1981) “Series capacitor – a new scheme for damping subsynchronous resonance in compensated a.c. transmission system” Electric power research institute, USA, pubn 205, pp. 60.
Jim Lux (2006), „Lessons in Electric Circuit‟, HTML documents, vol. II, pp. 6- 21, Washington.
Khoudiakev V.V. and Nivakin V. (1981) “Static compensators for power system and industries”, All-union Electrotechnical Inst, USSR, Pubn 205, pp. 25.
74
Mehta V.K. and Mehta R. (2005), „A Textbookofprinciples of power system‟, First Multicolour Illustrative and Thoroughly Revised Edition,S. Chad and company Ltd., Ram Nagar, New Delhi-110055, pp. 100- 117.
Obais and Pasupuleti (2012). “Design of almost continuously controlled three-phase static VAR compensator for power fctor correction purposes”, vol.7 (2), pp.219-230. Available from: ww.academicjournals.org/ SRE [Accessed 9 March, 2012].
Pamela, A. (2007) “Power Factor Correction for power systems” Department of Electrical and computer Engineering, Colorado state University, Fort collins, Colorado.
Ray W. F. and Davis Rd. M. (1988) “The definition and importance of power factor for power electronics converters” Proc. European conference on Power Electronics and Applications (EPE) , pp. 799 – 805.
Theraja B.L. and Theraja A.K. (1999) “ A textbook of Electrical Technology” first edition, Chand S. and company Ltd. pp.433, New Delhi.
Tony R.K. (2000), „Power Factor Correction‟ HTML documents,vol. II pp. 6 – 21, Washington .
Tse C. K. (2003).‟‟International Journal of Circuit Theory and Applications”, vol.31: pp.157-198.