Volume 3 Issue 3 Article 5
2016
Schooling Attainment’s Influence on Internet Adoption:
Schooling Attainment’s Influence on Internet Adoption:
Education’s Role in the Cross-National Development of the
Education’s Role in the Cross-National Development of the
Mass-Media Knowledge Gap
Media Knowledge Gap
Bryan A. Mann
The Pennsylvania State University, [email protected]
William C. Smith
UNESCO, [email protected]
David Baker
The Pennsylvania State University, [email protected]
Follow this and additional works at: https://preserve.lehigh.edu/fire
Part of the Educational Sociology Commons, International and Comparative Education Commons, and the Sociology of Culture Commons
Recommended Citation Recommended Citation
Mann, B. A., Smith, W. C., & Baker, D. (2017). Schooling Attainment’s Influence on Internet Adoption: Education’s Role in the Cross-National Development of the Mass-Media Knowledge Gap. FIRE: Forum for International Research in Education, 3(3). http://dx.doi.org/10.18275/fire201603031114
Abstract Abstract
Research about innovation adoption underplays the role of educational attainment in the individual consumption of technology; consequently, past research underestimates the importance education plays independent of wealth in diffusion, particularly as absolute levels of formal education rise worldwide. Using data from the Programme for International Student Assessment (PISA), this study employs clustered logistic regression to show how educational attainment of adults independently relates to household Internet adoption, net of wealth and other social factors. The results nuance and enhance discussions about the Digital Divide and the mass media knowledge gap hypothesis, showing, through a unique, cross-national dataset, that indeed there is an independent association between education and Internet adoption, creating a disadvantage for those with lower educational attainment.
Keywords Keywords
Educational Attainment, Innovation, Internet, Technology
SCHOOLING ATTAINMENT’S INFLUENCE ON
INTERNET ADOPTION: EDUCATION’S ROLE IN THE
CROSS-NATIONAL DEVELOPMENT OF THE MASS
MEDIA KNOWLEDGE-GAP
Bryan A. Mann
1Pennsylvania State University, USA
William C. Smith
2Pennsylvania State University, USA
David P. Baker
Pennsylvania State University, USA
Purpose
Arguments about innovation adoption, especially growth patterns of the Internet, suggest the primary variable relating to the consumption of new technology is socioeconomic status, particularly wealth (Baliamoune-Lutz, 2003; Chinn & Fairlie, 2007; Cruz-Jesus, Oliveira, & Bacao, 2012; Kiiski, & Pohjola, 2002). The argument suggests that individuals with the financial capital to purchase a new technology often do so. But increasingly, socioeconomic status is influenced by educational attainment, and previous innovation adoption studies tend to combine variables into models of socioeconomic status, conflating wealth and educational attainment. As a result, past research underestimates the independent effect education has on the diffusion and adoption of new technologies, an essential understanding as absolute levels of formal education rise worldwide.
This study analyzes the effect education has on adoption of the Internet, answering the questions: Is educational attainment related to Internet adoption in the early stages of diffusion? Does this effect hold when controlling for other variables related to socio-economic status? Do these findings hold at a later time point? How do these findings relate to educational expansion overall? Accounting for the limitations of previous research, the findings presented here challenge claims that wealth is the primary factor that drives innovation, while using a unique dataset that considers adoption traits and patterns at the unit of the individual. These
1Correspondence: Educational Theory and Policy, 301 Rackley Bldg., University Park, PA, 16802; [email protected]
2Currently Senior Research Officer at United Nations Educational, Scientific and Cultural Organization
level data are more sensitive than previous studies that tend to use aggregate, country-level data. And while the findings do not necessarily dispute the claim that technologies like the Internet grow faster in societies with high levels of financial capital, they do nuance the claim that socioeconomic status drives innovation, showing that educational attainment has an independent effect.
The values and skills promoted by formal schooling have greatly changed contemporary societies and advanced the rapid expansion of information-based technologies. Schooling attainment helps drive the patterns found in Rogers’ Innovation Adoption Curve (2003) and explain reasons for the Digital Divide, the social divide between those who have and do not have access to essential technology. Additionally, it is assumed in our research that educational attainment and Internet adoption are both net positives for developing societies. Research on education’s relationship with health and other social problems has shown that over time educational attainment decreases individual exposure to health risks and increases life quality and longevity (Smith, Anderson, Salinas, Horvatek, & Baker, 2015). Additionally, while there is a growing critique about how the Digital Divide is conceptualized and how to parse out definitions of “use” and “access” (Hargittai, 2008; Selwyn, 2004), the analysis here is important in that, although it does not look specifically at use, it uniquely examines worldwide adoption patterns and nuances past studies that underplay the role of the education effect on adoption worldwide.
Necessary to this conversation is the “knowledge gap hypothesis” and how it relates to educational expansion. The hypothesis states,
as the infusion of mass media information into a social system increases, segments of the population with higher socioeconomic status [SES] tend to acquire this information at a faster rate than lower status segments, so that the gap in knowledge between these segments tends to increase rather than decrease. (Tichenor, Donohue, & Olien, 1970, p. 159-60)
The findings here indicate that when SES is parsed out into specific variables, education plays an independent role in adoption, creating an important corollary to the knowledge gap hypothesis— that not only is the knowledge gap related to socio-economic status generally, but there is also an independent education effect. This illustrates a paradox raised by the knowledge gap hypothesis: That while those most likely to adopt technology are the most educated, it is the least educated who have the most to gain. Other scholars have found within specific countries a “use-gap” related to education (Bonfadelli, 2002; Hargittai, 2008), but again, this new analysis, while limited to access, adds to this literature by showing the international and cross-national relationship education has with the knowledge gap.
Why Use the Internet
Since its release to widespread public audiences in the 1990s, the Internet has become an innovation that has transformed the way members of global society behave. The knowledge attainment and information activities enabled and promoted by Internet ubiquity have permeated culture in the developed world. This influence is so evident that The World Bank uses the indicator “Internet users per 1000 people” as an indicator of economic development (The World Bank, 2014). The activities rooted in the Internet have become normative to the point that terms such as the “Information Age” and “Knowledge Society” are invoked to describe contemporary society. Implicit in these names are the values of a society that is highly schooled and comprised of individuals who accept the notion that schooling attainment and knowledge acquisition are worthwhile endeavors (Baker, 2014).
Because no innovation better represents the culture, values, and norms of the Information Age than Internet adoption, it serves as an ideal topic for examining the relationship between education and technological diffusion. Additionally, the Internet has been in existence long enough for researchers to examine adoption patterns at different historical moments. Because of the design of the survey data used in this study, the analysis presented is not longitudinal, but the data do allow an examination of the adoption of the Internet at 2000 and 2009, two markedly different points in Internet diffusion. These points are captured in the 2000 and 2009 samples of the Programme for International Student Assessment (PISA) data. For example, Figures 1 and 2 plot global World Bank data illustrating how 2000 and 2009 are key moments for the Internet and its spread. Circa 2000 was a time when the Internet was concentrated in specific areas, mainly highly educated and wealthy western nations, while by 2009 the Internet became a more global phenomenon.
Figure 1: Internet Users per 1000 people across the world according to the World Bank in 2000.
Note: This map is an adaption of a template provided by Robert Mundigl under a Creative Commons attribution non-commercial license.
Note: This map is an adaption of a template provided by Robert Mundigl under a Creative Commons attribution non-commercial license.
Literature Review
Researchers have examined demographic variables that relate to those who do not have access to information technology. This literature labels non-consumers as living in “information poverty” (Norris, 2001). These Digital Divide studies have explained that Internet growth relates to a number of factors: competition in the telecommunications sector, world-system status, democracy and cosmopolitanism (Guillén & Suárez, 2005); socioeconomic status (Baliamoune-Lutz, 2003; Chinn & Fairlie, 2007; Cruz-Jesus, Oliveira, & Bacao, 2012; Kiiski, & Pohjola, 2002); and human capital and other social forces (Korupp, & Szydlik, 2005; Wilson, Wallin & Reiser, 2003). These studies largely underplay the role formal education has on growth patterns of the Internet and have three limitations.
traits from a range of nations, our study more specifically pinpoints traits of consumers at the individual level to fill the void left by studies that look at aggregate data.
The second limitation is that some Digital Divide studies have used individual-level data; however, they tend to be limited in other dimensions, the main being generalizability. For example, Plowman, Stephen, & McPake (2009) show cultural differences in ICT use and adoption in a qualitative study in Scotland; Willis & Tranter (2006) and Lloyd & Hellwig (2000) show strong educational effects in Australia; Vicente & López (2006) show that levels of education influence the likelihood of Internet and communications technology use in the European Union; and Schleife (2010) and Korupp & Szydlik (2005) show that highly educated employees and students relate to a higher proportion of Internet users in Germany. There are several studies within a United States context that provide mixed results of the education effect on Internet consumption (Wilson, Wallin, & Reiser, 2003; Victory & Cooper, 2002). The PISA data used in this study enhance findings of previous single, region-centered research by capturing user traits more globally.
The third limitation in the Digital Divide literature can be found in studies that have used data as robust as PISA, but do not include variables related to education in a specific enough manner and/or do not employ the controls needed to separate confounding variables from the education-specific effect on Internet consumption. Chen & Wellman (2004) focus on socioeconomic status, gender, life stage, and region and show within-country differences and the effect that these factors have on Internet consumption. Their study analyzes eight countries, combining wealth and education into the same category of “socioeconomic status.” Notten, Peter, Kraaykamp, & Valkenburg (2009) conducted an individual-level analysis that examines PISA 2003 data, but had modeling that did not include stepwise controls such as urbanicity and region. The study also focused on occupational status and did not consider relative effects of wealth and education. Our research accounts for these limitations and includes appropriate statistical controls and two time points while focusing primarily on the unique relationship between educational attainment and Internet adoption.
In addition to this discussion framed within the Digital Divide literature, there are studies that have looked at the education and its effect on technology use in the workplace. Education increases the likelihood employees will use new technology to complete job-related tasks (Riddell & Song, 2012; Lleras-Muney & Lichtenberg, 2002; Krueger, 1993; Wozniak, 1987). These studies help provide impetus for our research because they highlight the effect of education on technology adoption in a different context. Our study adds to this because instead of viewing the use of technology through the lens of “human capital” (educated workers possess the skills and talents to use technology and better perform their job), we suggest that education has a normalizing effect on individuals that is likely reflected through their household adoption of the Internet.
Guiding Frameworks
There are two frameworks that guide this study, one describes consumer patterns and the other describes why consumers behave in a manner to produce these patterns. The first is Rogers’ (2003) widely cited innovation framework which describes five criteria that influence the likelihood of adoption: “relative advantage,” “compatibility,” “complexity,” “triability,” and “observability.” Increased levels of schooling may influence a user’s likelihood to meet these criteria when considering the adoption of certain technologies. In the case of the Internet, schooling can specifically promote “relative advantage” because both schools and the Internet employ practices of disseminating and retrieving information. The Internet can be seen as helpful in knowledge acquisition; schools ease burdens of “compatibility” and “complexity” because they teach basic skills required for understanding what information on the Internet means; and schools allow for “triability” and “observability” because they are likely to have computers in their buildings and are hubs where users come together to discuss experiences. In early adoption of the Internet, these ideas are especially prevalent when considering universities and their promotion of Rogers’ factors of adoption.
Another core component of Roger’s explanation is the labels he ascribes to different stages of adoption. Groups at each stage of adoption are labeled innovators, early adopters, early majority, late majority, and laggards. In particular, this study looks at the traits of the early majority, or the first 35% of those who adopt a new technology, and laggards, who are the last 20% to adopt technology. The use of the 2000 PISA data in this study will explain the characteristics of the early majority, while use of 2009 PISA data will explain characteristics of laggards. These benchmarks were chosen due to the rate of Internet adoption observed within those years of the data.
The second framework used here is the role schooling has had on contemporary society by viewing schools on a macro-level and recognizing their position as a dominant institution that has shaped world culture. This idea maintains that massive, mandatory enrollments have created a schooled society that has transformed human culture in the 20th century. This transformation includes knowledge acquisition not only as a worthwhile endeavor, but necessary for survival within a globally schooled society (Baker, 2014). In the context of this study, schooling credential acquisition is viewed as a signal of those who reflect greater levels of achievement and have bought into the latent values associated with a schooling culture. Those who have higher schooling credentials are more likely to be the early majority, have the knowledge, and see relative advantages of consuming the Internet. This understanding assumes that trends like the mass-media knowledge gap (Tichenor, Donohue, & Olien, 1970) are partially driven (and thus confounded) by different levels of educational attainment.
Data and Methods
Data and Variable Classifications. The 2000 and 2009 cross-sectional PISA data are the primary sources of data for this study. PISA is a cross-national assessment that tests students’ knowledge of literacy, numeracy, and science. A nationally representative sample of 15-year-old students is selected in each country and background questionnaires are administered to students providing unique individual-level data on Internet availability and use. The presence of the Internet is our dependent variable (1=present in household, 0=not present in household). The students self-report the data during administered testing. The survey they complete includes the presence of Internet adoption in their household and the level of education of their parents.
categories: finished less than lower secondary school (having no school or only primary school, or ISCED 0 and 1), finished lower secondary school (junior high or middle school for U.S. audiences, or ISCED 2), finished secondary school (includes high school and vocational high school, ISCED 3), and finally finished post-secondary or higher (ISCED 4, 5, 6). The inclusion of parents’ level of education is important because parents are the likely decision-makers on purchasing the Internet for the family.
To classify each student’s socioeconomic status (hereafter: SES), we created a wealth index on a 13-point scale. The composite variable included artifacts that reflect a family’s purchasing power, such as a dishwasher, television, and automobile. To avoid confounding SES with Internet adoption, education and the presence of the Internet in the home were omitted from this index. The high correlation (r=.909) between the wealth proxy variable and the PISA 2000 index of economic, social, and cultural status adds validity to the derived measure.
Additional control variables included urbanicity and region. Urbanicity is a proxy for infrastructure, allowing us to control for more urban areas where access to the Internet is more likely. Urbanicity categories included village (less than 3,000 people), small town (3,000 to 15,000), town (15,000-100,000), and city (greater than 100,000). To explore whether the effects of education were contingent on a minimal level of wealth, an interaction term was included in the analysis (wealth*education). Despite challenges in interpreting the significance of interaction terms in non-linear models (e.g. Ai & Norton, 2003), the inclusion of an interaction term in our model allowed us to identify the multiplicative effect which distinguishes the relative education effect between individuals with education and little or no wealth and wealthy, educated individuals (see Buis, 2010 for more on interpreting interaction terms in non-linear models).
United Nation (UN) classifications were used to inform our categorization of regions. Exceptions from the UN categorization scheme included the collapsing of Central and South America due to the limited Central America sample, and the installation of Israel into Southern Europe because of relative regional proximity (See Appendix A for a full country list with number of each cases in the sample per country in both years). Countries that did not ask about Internet use were omitted, yielding a sample size of 100,526 in 2000 and 304,071 in 2009. List-wise deletion was used for missing data. Additional descriptive statistics are in Appendix B for the year 2000 and Appendix C for the year 2009.
Analytic Strategies. Our first three questions focused on the relationship between educational attainment and Internet adoption in early stages of diffusion, later stages of diffusion, and whether the relationship holds with controls. The strategy for answering these questions started with a five-step additive logistic regression that estimates the likelihood (reported in odds ratios) a participant would have the Internet in their household. All analyses address between school heterogeneity by taking into account the clustered nature of students in schools. The first, or null model, estimated only the relationship between education and Internet adoption. In succession, control variables were added to distinguish the education effect from wealth and regional factors. The second model adds the wealth proxy. The third model adds urbanicity and the fourth model adds regional dummy variables to capture regional differences. The final model adds the interaction term to explore how the combination of education and wealth accelerate the potential benefits of each variable independently.
infrastructure determinants (Billon, Marco, & Lera-Lopez, 2009; Flamm & Chaudhuri, 2007). Additionally, despite our effort to create an index that applies across countries and regions, our measure of SES could be the product of country-level differences. By running the analysis by each region and country, we examine how frequent a relationship between education and Internet adoption occurred, helping overcome potential confounding variables.
To identify potential changes in the education effect over time, the statistical models were replicated with the 2009 data. Differences in the magnitude of the education effect between 2000 and 2009 illuminate how the role of education changed as Internet availability and educational adoption became more common globally. The Diffusion of Innovations framework (Rogers, 2003) was used to label these time points, as the rate of Internet penetration based on the responses in PISA 2000 data was characterized as “the early majority,” while PISA 2009 data was characterized as “the laggards.”
To answer the final question of our research, “How do these findings relate to educational expansion overall?” we consider the findings of the previous steps in sum, adding descriptive statistics to help interpret the findings within the educational expansion frameworks. This analytical step is less technical than the others, but it summarizes the findings, leading into the discussion of the implications that our findings have for scholars and policymakers alike.
Results
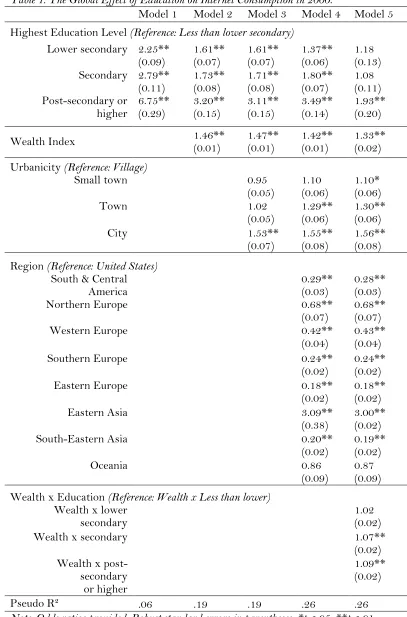
The Global Education Effect on Internet Adoption in 2000. More than 35% of students in the 2000 PISA sample had home access to the Internet, which is on par with describing the “early majority” and even segments of the “early adopters” in the Innovation Adoption Curve. Stark regional differences were present as more than 70% of students in the Eastern Asia region had access while less than 10% of students in the South-Eastern Asia region had access. Despite this, as depicted in Table 1, there is a robust global education relationship with Internet consumption in 2000.
Results are reported in odds ratios, meaning that when compared to families whose lowest parental level of education is less than lower secondary school, the magnitude of the education effect increases at higher levels of education. For example, as shown in Model 4 in Table 1, a family with the highest educational attainment level is 3.49 times more likely to acquire the Internet than someone with less than lower secondary levels of education, even when controlling for wealth, urbanicity, and region of the world.
Table 1: The Global Effect of Education on Internet Consumption in 2000.
Model 1 Model 2 Model 3 Model 4 Model 5 Highest Education Level (Reference: Less than lower secondary)
Lower secondary 2.25**
(0.09) 1.61** (0.07) 1.61** (0.07) 1.37** (0.06) 1.18 (0.13) Secondary 2.79**
(0.11) 1.73** (0.08) 1.71** (0.08) 1.80** (0.07) 1.08 (0.11) Post-secondary or
higher 6.75** (0.29) 3.20** (0.15) 3.11** (0.15) 3.49** (0.14) 1.93** (0.20)
Wealth Index 1.46** (0.01) 1.47** (0.01) 1.42** (0.01) 1.33** (0.02)
Urbanicity (Reference: Village)
Small town 0.95
(0.05)
1.10 (0.06)
1.10* (0.06)
Town 1.02
(0.05) 1.29** (0.06) 1.30** (0.06)
City 1.53**
(0.07) 1.55** (0.08) 1.56** (0.08) Region (Reference: United States)
South & Central
America 0.29** (0.03) 0.28** (0.03)
Northern Europe 0.68**
(0.07) 0.68** (0.07)
Western Europe 0.42**
(0.04)
0.43** (0.04)
Southern Europe 0.24**
(0.02) 0.24** (0.02)
Eastern Europe 0.18**
(0.02) 0.18** (0.02)
Eastern Asia 3.09**
(0.38) 3.00** (0.02)
South-Eastern Asia 0.20**
(0.02) 0.19** (0.02)
Oceania 0.86
(0.09) 0.87 (0.09) Wealth x Education (Reference: Wealth x Less than lower)
Wealth x lower
secondary 1.02 (0.02)
Wealth x secondary 1.07**
(0.02) Wealth x
post-secondary or higher
1.09** (0.02)
Pseudo R² .06 .19 .19 .26 .26
Table 2: The Global Effect of Education on Internet Consumption in 2009.
Model 1 Model 2 Model 3 Model 4 Model 5 Highest Education Level (Reference: Less than lower secondary)
Lower secondary 2.40**
(0.00) 1.47** (0.00) 1.38** (0.02) 1.16** (0.02) 1.17* (0.00) Secondary 12.16**
(0.00) 5.18** (0.06) 5.08** (0.09) 2.08** (0.06) 1.74** (0.08) Post-secondary or
higher 10.87** (0.00) 3.72** (0.33) 3.37** (0.35) 2.35** (0.01) 1.38 (0.28)
Wealth Index 1.69** (0.00) 1.72** (0.01) 1.56** (0.02) 1.48** (0.00) Urbanicity (Reference: Village)
Small town 1.63**
(0.09) 1.82** (0.05) 1.82** (0.06)
Town 2.06**
(0.22) 2.64** (0.13) 2.65** (0.13)
City 3.00**
(0.71) 3.78** (0.21) 3.78** (0.20) Region (Reference: United States)
South & Central
America 0.37** (0.02) 0.37** (0.02)
Northern Europe 4.75**
(0.28) 4.83** (0.33)
Western Europe 5.81**
(0.90) 5.93** (0.14)
Southern Europe 0.90**
(0.01) 0.93 (0.01)
Eastern Europe 1.13
(0.11) 1.16 (0.12)
Eastern Asia 18.96**
(1.10) 18.27** (0.29)
South-Eastern Asia 0.19**
(0.03) 0.19** (0.03)
Oceania 1.71**
(0.07) 1.72** (0.08) Wealth x Education (Reference: Wealth x Less than lower)
Wealth x lower
secondary 1.02 (0.00)
Wealth x secondary 1.03*
(0.01) Wealth x
post-secondary or higher
1.08** (0.02)
Pseudo R² .12 .30 .32 .40 .40
The Global Education Effect on Internet Adoption in 2009. In 2009, nearly 80% of the sample used the Internet, which means that those who do not have the Internet in this portion of the data are considered “laggards” in the Innovation Adoption Curve. Yet, as Table 2 shows, findings from the analysis of the 2009 PISA data indicate that the global effect of education on Internet consumption remains strong. The same stepwise steps as used in the analysis of 2000 were used here, but while an educational effect remains, there are some nuances particular to the 2009 analysis that were not seen in 2000.
In 2009, a student who has a family member that has completed at least post-secondary education is 2.35 times more likely to have secured the Internet at home, relative to peers in the lowest level of education (Table 2, Model 4). This represents a slight decrease in the odds ratio from 2000, but still a statistically significant, robust effect. Results from the interaction terms (see Model 5) indicate that education and wealth tend to act in unison, but, again, while the interaction is statistically significant, the multiplicative effect is extremely low.
Some of the models, such as Model 3, show a magnitude of the global effect of completing secondary education (OR=5.09) now greater than that of completing post-secondary or higher (OR=3.38). When examining the models together with the regional and country tables, it seems the increasing importance of secondary education between the two samples is due to regional fluctuation. These differences will be discussed in the following section, but, generally, the findings from 2000 and 2009 support the claim that educational attainment relates to adoption patterns of the Internet even at later stages of adoption.
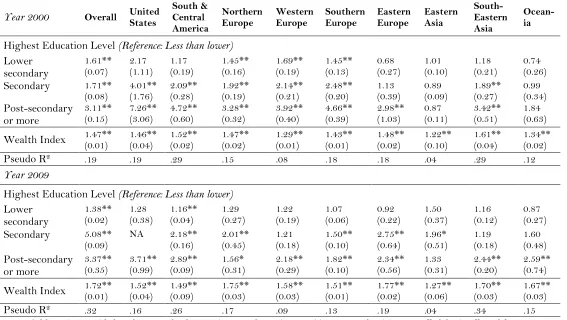
Table 3: The Effect of Education on Internet Consumption across Regions in 2000 and 2009.
Year 2000 Overall United States South & Central America
Northern
Europe Western Europe Southern Europe Eastern Europe Eastern Asia
South-Eastern Asia
Ocean-ia
Highest Education Level (Reference: Less than lower)
Lower secondary
1.61**
(0.07) 2.17 (1.11) 1.17 (0.19) 1.45** (0.16) 1.69** (0.19) 1.45** (0.13) 0.68 (0.27) 1.01 (0.10) 1.18 (0.21) 0.74 (0.26)
Secondary 1.71**
(0.08) 4.01** (1.76) 2.09** (0.28) 1.92** (0.19) 2.14** (0.21) 2.48** (0.20) 1.13 (0.39) 0.89 (0.09) 1.89** (0.27) 0.99 (0.34)
Post-secondary or more
3.11**
(0.15) 7.26** (3.06) 4.72** (0.60) 3.28** (0.32) 3.92** (0.40) 4.66** (0.39) 2.98** (1.03) 0.87 (0.11) 3.42** (0.51) 1.84 (0.63)
Wealth Index 1.47** (0.01) 1.46** (0.04) 1.52** (0.02) 1.47** (0.02) (0.01) 1.29** 1.43** (0.01) 1.48** (0.02) 1.22** (0.10) 1.61** (0.04) 1.34** (0.02)
Pseudo R² .19 .19 .29 .15 .08 .18 .18 .04 .29 .12
Year 2009
Highest Education Level (Reference: Less than lower)
Lower secondary
1.38**
(0.02) 1.28 (0.38) 1.16** (0.04) 1.29 (0.27) 1.22 (0.19) 1.07 (0.06) 0.92 (0.22) 1.50 (0.37) 1.16 (0.12) 0.87 (0.27)
Secondary 5.08**
(0.09) NA 2.18** (0.16) 2.01** (0.45) 1.21 (0.18) (0.10) 1.50** 2.75** (0.64) 1.96* (0.51) 1.19 (0.18) 1.60 (0.48)
Post-secondary or more
3.37**
(0.35) 3.71** (0.99) 2.89** (0.09) 1.56* (0.31) 2.18** (0.29) 1.82** (0.10) 2.34** (0.56) 1.33 (0.31) 2.44** (0.20) 2.59** (0.74)
Wealth Index 1.72** (0.01) 1.52** (0.04) 1.49** (0.09) 1.75** (0.03) (0.03) 1.58** 1.51** (0.01) 1.77** (0.02) 1.27** (0.06) 1.70** (0.03) 1.67** (0.03)
Pseudo R² .32 .16 .26 .17 .09 .13 .19 .04 .34 .15
In 2009, examining the effect of education by region illuminates multiple trends. First, the effect of education on Internet adoption is now positive and significant at some level in all nine of the regions, suggesting that across the majority of geographical locations, greater levels of parental education are associated with increased access to the Internet. Second, the variance of the post-secondary and higher effect has decreased between 2000 and 2009. This is due in part to the reduction in the magnitude of the effect in the U.S. (2000 OR=7.26; 2009 OR=3.71) and in part to the significant positive effect found in Oceania in 2009 (OR=2.59), relative to 2000 (ns). Finally, in 2009 the magnitude of the secondary education effect at times is greater than that of post-secondary or higher, contributing to its greater overall odds ratio. This is a marked shift from 2000 where seven out of the nine regions with a significant education effect had a greater magnitude at the post-secondary or higher level. Changes in Eastern Asia appear to be driving this shift. In 2000, education was not significantly related to Internet consumption in Eastern Asia. In 2009, those in families that have completed the secondary level were nearly two times more likely to have home access to the Internet than those in families that completed the lowest level of education; post-secondary education was not significant. However, although the magnitude of the secondary effect is greater than post-secondary or higher overall, both increased between 2000 and 2009, suggesting that education is becoming more important for Internet consumption.
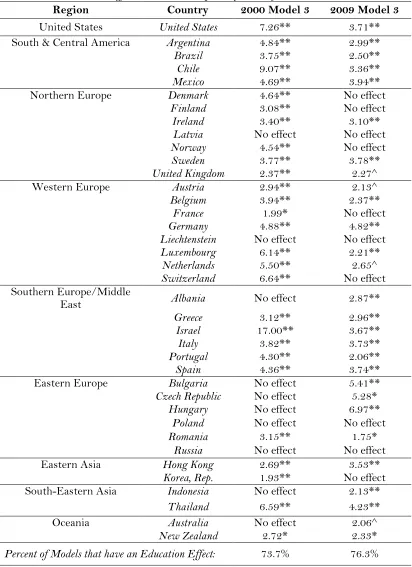
Education Effect by Country in 2000 and 2009. As an added measure to ensure the validity of our findings, we ran Model 3 from Tables 1 and 2 separately for each country in the dataset. The purpose of this was to examine if the relationship for education and Internet adoption occurred in each country context, as to contest counterfactuals that suggest differences relate to conditions and markets within each country.
As indicated in Table 4, there is a relationship between education and Internet adoption in 73.7% of the countries in 2000 at the p <.05 level, and 61.5% in 2009 (or 76.3% when including p <.10). There seems to be two changes from 2000 to 2009 in the existence of an education effect. The first is in areas such as Northern Europe and Western Europe where the educational effect goes away, perhaps because educational attainment and Internet adoption have both reached high levels, limiting variation and thus the ability to detect patterns. The second is that educational effects that were absent in 2000 emerged in other countries in 2009 in places such as Eastern Europe, suggesting perhaps they have reached a stage in development where the other regions were in years prior. A possibility of this may be linked to having no availability of the Internet in 2000 to now having that capability.
Table 4: The Education Effect on Internet Adoption by Country, 2000 and 2009.
Region Country 2000 Model 3 2009 Model 3
United States United States 7.26** 3.71**
South & Central America Argentina 4.84** 2.99**
Brazil 3.75** 2.50**
Chile 9.07** 3.36**
Mexico 4.69** 3.94**
Northern Europe Denmark 4.64** No effect
Finland 3.08** No effect
Ireland 3.40** 3.10**
Latvia No effect No effect
Norway 4.54** No effect
Sweden 3.77** 3.78**
United Kingdom 2.37** 2.27^
Western Europe Austria 2.94** 2.13^
Belgium 3.94** 2.37**
France 1.99* No effect
Germany 4.88** 4.82**
Liechtenstein No effect No effect
Luxembourg 6.14** 2.21**
Netherlands 5.50** 2.65^
Switzerland 6.64** No effect Southern Europe/Middle
East Albania No effect 2.87**
Greece 3.12** 2.96**
Israel 17.00** 3.67**
Italy 3.82** 3.73**
Portugal 4.30** 2.06**
Spain 4.36** 3.74**
Eastern Europe Bulgaria No effect 5.41**
Czech Republic No effect 5.28* Hungary No effect 6.97**
Poland No effect No effect
Romania 3.15** 1.75*
Russia No effect No effect
Eastern Asia Hong Kong 2.69** 3.53**
Korea, Rep. 1.93** No effect
South-Eastern Asia Indonesia No effect 2.13**
Thailand 6.59** 4.23**
Oceania Australia No effect 2.06^
New Zealand 2.72* 2.33*
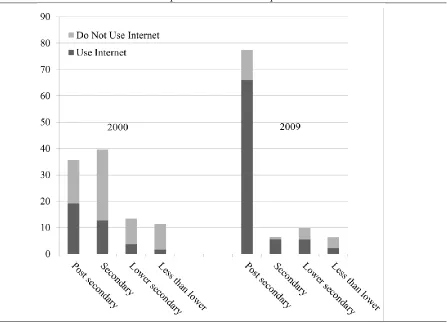
Figure 3: Educational Attainment and Proportional Internet Adoption in 2000 and 2009.
Note: The histograms represent the percentage of each level of educational attainment, while the shaded area represents the proportion of that level of families who had the Internet at home.
Apparent in Figure 3 is the change in those at the highest level of education. In 2000, those with parents who completed some post-secondary education or higher represented approximately 35% of the sample with just over 50% having home access to the Internet. In 2009, the highest educated group represented over 70% of the sample with over 85% of that group having access to the Internet. The mobility across education levels, however, appears to be limited as most expansion is happening at the top of the education spectrum with more individuals moving from secondary to the post-secondary or higher category. For example, in 2000 approximately 24.5% of individuals had parents who had completed less than secondary education and in 2009 that percentage remained more than 20%. In contrast, the number that stopped their education after completing secondary and not moving onto post-secondary education declined sharply from 39.6% to 8.4%. This suggests that the laggards are at a greater relative disadvantage as the more educated world leaves them behind.
Limitations of Findings
The data depicted in Figure 1 and 2 in the introduction come from The World Bank and explain Internet adoption across the entire world. However, the PISA data is more selective, focusing on three-dozen countries and tends to over-represent the number of Internet users relative to actual worldwide Internet users. In particular, the Eastern Asia region represents wealthy areas of that region. Although inflated, the national level correlation between The World Bank 2000 data of Internet rates and the Internet penetration found in PISA was extremely high (r = .958). So, despite an inflation of Internet users in the PISA data, when compared to world usage at the time, the inflation is consistent throughout the data. Additionally, the PISA sample from 2009 tends to oversample some countries and under-sample others. This has the possibility of influencing results in the pooled 2009 analysis.
The data inflation in the PISA survey and sampling issues in 2009 may limit overall generalizability; however, the education relationship with Internet adoption is robust throughout every portion of our analysis, suggesting that this limitation does not necessarily obscure results. Decomposing the findings at the region and country level demonstrate this robustness. The relationship between education and Internet adoption occurs in the pooled, region, and country analyses, suggesting findings are consistent.
Further, as always, there exists unobserved variable biases in this study. Perhaps some unobserved variable relates to both education expansion and Internet adoption. Although wealth is captured through our measure of SES, and we capture urbanicity and regional variation through country dummy variables and the country-specific analysis, there may still be an omitted variable that drives education and Internet adoption. The endogeniety of education also clouds claims of causality, as temporal ordering cannot be established with cross sectional data; it is possible that internet adoption spurred greater levels of education (although this is less likely as parental education is used as the education measure).
Another limitation is that this study considers adoption patterns but does not look at use. A next step would be to create a study that looks at use as suggested by Bonfadelli (2002) and Hargittai (2008), but to do so with a cross-national, individual dataset like the one incorporated here. If results are consistent, then a primary intervention to inequities related to adoption and use would be to promote higher levels of education, which paradoxically would become difficult if the goal of the innovation is to solve educational inequality.
Discussion, Implications, and Conclusion
This study helps provide a new way of thinking about technology adoption and does so starting with the innovation that is the focal point of the Information Age: The Internet. The questions asked at the onset of the study were: Does educational attainment have an effect on Internet in the early stages of diffusion? Does this effect hold when controlling for other variables related to socio-economic status? Do these findings hold at a later time point? How do these findings relate to educational expansion overall? The answers to these questions, as related to the Internet, are that education plays a significant, independent role in consumption patterns of the Internet at different points in time. These patterns have occurred as educational attainment rates have expanded globally, doing so while perpetuating inequality in that those who are highly educated are more likely to obtain the tools to help enhance their ability to acquire knowledge.
wealth. This understanding that schooling has a strong, independent relationship on the consumption of the Internet has important implications, especially in how researchers and policymakers understand the nature of inequality in education and technology diffusion.
The tendency for higher educated individuals to acquire the Internet first and less educated individuals to acquire it last creates a paradox related to the mass-media knowledge gap. This paradox is that the relationship between education and Internet acquisition create a dilemma where those with higher levels of educational attainment are simultaneously more likely to take advantage of the technology and less likely to be those who need it most. It is lower educated populations who need equitable interventions related to the stratification of knowledge acquisition. Assuming that access to the Internet assists in pursuits of educational achievement (i.e. knowledge acquisition, content-based skills, supplemental materials) the findings presented in this article suggest that Internet adoption patterns based on educational attainment creates a paradoxical disadvantage for those with lower educational attainment.
A lack of understanding of this paradox creates a difficult situation for technological enthusiasts and policymakers. In one regard, a superficial understanding of curing ailments of the Digital Divide has been to enact policy that, for example, provides free Internet to those populations who cannot afford to purchase it. However, results presented here suggest that it is not only wealth (or cost) that drives individual access the Internet. This means that in addition to a cost-based intervention, it is crucial to find mechanisms to promote educational attainment. An obvious dilemma emerges when a policymaker tries to push arguments that the Internet might be an efficient way to try to promote educational attainment (i.e. Massive Open Online Courses, or MOOCs).
To be cautious, this study is only about Internet adoption, so what is not known and needs to be studied further is if adoption trends linked to education relate to other technologies or if it is isolated to the Internet. There also is a need to study use patterns. As of now, there is additional emerging evidence to suggest that this paradox has occurred in the implementation of other technologies. For example, MOOC providers offered free courses to the public with the hope that traditionally disadvantaged people would flock to them as a cheap way to enhance skills and improve life situations. What happened, though, was that courses have been used mostly by those already with a college degree (Emanuel, 2013). While the verdict is still out on MOOCs and the platform promises to have interesting developments, those who hoped that MOOCs would be a quick fix to solving educational inequality are likely disappointed with initial results that could have perhaps been predicted by the findings of this article.
ubiquity in adoption. But, as summarized before, the irony in these situations tends to be that expansion related to education comes with the caveat that it can be both a stratifying agent and an essential remedy. Targeting education will probably mean those who already have it will get more and differences in inequality will persist.
While elevating these concerns, this study also illustrates the power of educational expansion and how technology has spread at a time when global educational attainment has also spread. This means that while the early majority in 2000 tended to be more highly educated, by 2009 more people completed greater levels of education and Internet use was also more saturated. Time is a key factor in spreading both educational credentials and the Internet, so some issues with technology implementation may be short-lived. This understanding leads to the conclusion that in some regards, promoting traditional educational expansion in disadvantaged populations may be the best way to provide access to technology and innovation.
References
Ai, C., & Norton, E.C. (2003). Interaction terms in logit and probit models. Economics Letters, 80, 123–129.
Baker, D.P. (2014). The schooled society: The educational transformation of global culture. Stanford, CA: Stanford University Press.
Baliamoune-Lutz, M. (2003). An analysis of the determinants and effects of ICT diffusion in developing countries. Information Technology for Development,10(3), 151–169.
Billon, M., Marco, R., & Lera-Lopez, F. (2009). Disparities in ICT adoption: A multidimensional approach to study the cross-country digital divide. Telecommunications Policy, 33(10), 596– 610.
Bonfadelli, H. (2002). The Internet and knowledge gaps a theoretical and empirical investigation. European Journal of Communication, 17(1), 65–84.
Buis, M. (2010). Interpretations of interactions in nonlinear models. The Stata Journal, 10(2), 305– 308.
Chen, W., & Wellman, B. (2004). The global digital divide–within and between countries. IT & Society,1(7), 39–45.
Chinn, M. D., & Fairlie, R.W. (2007). The determinants of the global digital divide: A cross-country analysis of computer and Internet penetration. Oxford Economic Papers,59(1), 16– 44.
Cruz-Jesus, F., Oliveira, T., & Bacao, F. (2012). Digital divide across the European Union. Information & Management,49(6), 278–291.
Emanuel, E. J. (2013). Online education: MOOCs taken by educated few. Nature,503(7476), 342– 342.
Erumban, A. A., & De Jong, S.B. (2006). Cross-country differences in ICT adoption: A consequence of culture? Journal of World Business,41(4), 302–314.
Flamm, K., & Chaudhuri, A. (2007). An analysis of the determinants of broadband access. Telecommunications Policy, 31(6), 312–326.
Guillén, M. F., & Suárez, S.L. (2005). Explaining the global digital divide: Economic, political and sociological drivers of cross-national Internet use. Social Forces,84(2), 681–708. Hargittai, E. (2008). Digital inequality: Differences in young adults’ use of the
Internet. Communication Research,35(5), 602–622.
Korupp, S. E., & Szydlik, M. (2005). Causes and trends of the digital divide. European Sociological Review, 21(4), 409–422.
Krueger, A. B. (1993). How computers have changed the wage structure: Evidence from microdata, 1984-1989. Quarterly Journal of Economics,108 (February), 33–60.
Lleras-Muney, A., & Lichtenberg, F. (2002). The effect of education on medical technology adoption: Are the more educated more likely to use new drugs?” NBER Working Paper #9185.
Lloyd, R., & Hellwig, O. (2000). Barriers to the take-up of new technology. National Centre for Social and Economic Modelling.
Norris, P. (2001). Digital divide: Civic engagement, information poverty, and the Internet worldwide. Cambridge, UK: Cambridge University Press.
Notten, N., Peter, J., Kraaykamp, G., & Valkenburg, P.M. (2009). Research note: Digital divide across borders—A cross-national study of adolescents’ use of digital technologies. European Sociological Review,25(5), 551–560.
Plowman, L., Stephen, C., & McPake, J. (2009). Growing up with technology: Young children learning in a digital world. London, UK: Routledge.
Riddell, W.C., & Song, X. (2012). The role of education in technology use and adoption: Evidence from the Canadian workplace and employee survey. Institute for the Study of Labor. Discussion Paper No. 6377.
Rogers, E. M. (2003). Diffusion of innovations (5th edition). New York, NY: The Free Press. Schleife, K. (2010). What really matters: Regional versus individual determinants of the digital
divide in Germany. Research Policy,39(1), 173–185.
Selwyn, N. (2004). Reconsidering political and popular understandings of the digital divide. New Media & Society, 6(3), 341–362.
Smith, W. C., Anderson, E., Salinas, D., Horvatek, R., & Baker, D. P. (2015). A meta-analysis of education effects on chronic disease: The causal dynamics of the Population Education Transition Curve. Social Science & Medicine,127, 29–40.
The World Bank: Internet users (per 100 people). (2014). Retrieved April 19, 2014, from http://data.worldbank.org/indicator/IT.NET.USER.P2.
Tichenor, P. J., Donohue, G. A., & Olien, C. N. (1970). Mass media flow and differential growth in knowledge. Public Opinion Quarterly,34(2), 159–170.
Vicente, M. R., & López, A.J. (2006). Patterns of ICT diffusion across the European Union. Economics Letters,93(1), 45–51.
Victory, N. J., & Cooper, K.B. (2002). A nation online: How Americans are expanding their use of the Internet. Economics and Statistics Administration and National Telecommunications and Information Administration, 16, 17.
Willis, S., & Tranter, B. (2006). Beyond the ‘digital divide’: Internet diffusion and inequality in Australia. Journal of Sociology,42(1), 43–59.
Wilson, K. R., Wallin J.S., & Reiser, C. (2003). Social stratification and the digital divide. Social Science Computer Review,21(2), 133–143.
About the Authors
Bryan A. Mann earned his PhD from the Educational Theory and Policy program at Penn State University and is a managing editor for the American Journal of Education. His dissertation focuses on the influence that school choice has on traditional public schools, particularly through the emergence of charter schools and online learning platforms. His other research interests include educational policy & leadership, sociology of education, charter schools, and GIS and quantitative methods.
William C. Smith is a Senior Research Officer at UNESCO’s Global Education Monitoring Report. Prior to joining UNESCO, William helped develop and pilot the Right the Education Index as a Senior Associate at RESULTS Educational Fund and was a Thomas J. Alexander Fellow at the Organization for Economic Co-operation and Development (OECD). He completed a dual title PhD in Comparative International Education and Education Theory and Policy at the Penn State University, and William's research focuses on education’s role in economic and social development with special interests in national testing policies, educator based accountability, population health, and equity in educational inputs and outcomes. He has published over 20 academic articles including his recently released edited book titled The Global Testing Culture: Shaping Education Policy, Perceptions, and Practice.
Appendix A: Countries, Regions, and Sample Sizes in PISA 2000 and 2009 Surveys.
Region Country 2000
Sample Sample 2009
United States United States 2,004 5,138 South & Central America Argentina 2,110 4,514
Brazil 2,562 18,916
Chile 2,672 5,542
Mexico 2,436 37,235
Northern Europe Denmark 2,304 5,810
Finland 2,699 5,774
Ireland 2,109 3,739
Latvia 2,081 4,457
Norway 2,260 4,617
Sweden 2,424 4,528
United
Kingdom 5,088 11,977
Western Europe Austria 2,649 6,446
Belgium 3,651 8,403
France 2,547 4,273
Germany 2,790 4,608
Liechtenstein 175 327
Luxembourg 1,899 4,597 Netherlands 1,388 4,720 Switzerland 3,359 11,743 Southern Europe/Middle
East Albania 2,656 4,453
Greece 2,505 4,916
Israel 2,168 5,592
Italy 2,749 30,784
Portugal 2,508 6,273
Spain 3,389 25,617
Eastern Europe Bulgaria 2,417 4,359
Czech Republic 3,014 6,017
Hungary 2,771 4,583
Poland 1,980 4,876
Romania 2,577 4,692
Russia 3,473 5,126
Eastern Asia Hong Kong 2,432 4,823
Korea, Rep. 2,739 4.967 South-Eastern Asia Indonesia 3,799 4,940
Thailand 2,945 6,189
Oceania Australia 2,826 13,926
Appendix B: Descriptive Characteristics of Regions in the 2000 PISA Survey.
Overall United States South & Central America
Northern
Europe Western Europe Southern Europe Eastern Europe Eastern Asia
South-Eastern
Asia Oceania
Internet
Consumption 36.43% 66.12% 18.14% 55.72% 43.64% 27.79% 14.56% 72.19% 9.33% 63.70% Finished less
than lower secondary
11.26% 2.62% 25.27% 3.61% 5.15% 13.90% 1.35% 15.94% 48.40% 1.51%
Finished lower secondary
13.38% 4.46% 18.86% 9.21% 14.24% 17.31% 3.89% 27.86% 17.90% 11.67%
Finished
secondary 39.64% 44.82% 28.19% 37.54% 40.56% 34.88% 61.78% 37.76% 22.16% 37.17% Finished
post-secondary or higher
35.72% 48.10% 27.69% 49.63% 40.04% 33.90% 32.97% 18.43% 11.54% 49.65%
Mean and std. deviation on 13-point wealth scale
6.70
(2.75) 8.56 (2.56) 4.67 (2.55) 8.03 (2.42) 7.92 (2.12) 7.06 (2.55) 4.99 (2.20) 6.33 (1.91) 4.11 (2.24) 8.26 (2.33)
Village (less than 3,000 people)
10.47% 6.74% 5.94% 20.74% 6.34% 5.50% 9.82% 2.31% 23.50% 8.92%
Small town (3,000 to 15,000 people)
21.24% 27.03% 16.36% 25.81% 31.30% 21.46% 14.93% 4.39% 23.90% 10.00%
Town (15,000 to 100,000 people)
32.56% 32.58% 27.48% 28.95% 38.59% 41.53% 34.10% 11.94% 25.96% 26.64%
City (More than 100,000 people)
35.74% 33.65% 50.23% 24.49% 23.77% 31.51% 41.14% 81.37% 26.64% 54.42%
Appendix C: Descriptive Characteristics of Regions in the 2009 PISA Survey.
Overall United States South & Central America
Northern
Europe Western Europe Southern Europe Eastern Europe Eastern Asia
South-Eastern
Asia Ocean
Internet
Consumption 77.47% 89.16% 44.37% 96.26% 96.66% 83.52% 80.61% 97.51% 26.01% 94.24%
Finished less than lower secondary
8.15% 2.85% 19.84% 1.20% 2.89% 5.85% 0.50% 7.83% 35.03% 0.63%
Finished lower secondary
12.59% 4.39% 22.52% 4.02% 7.41% 17.22% 3.24% 13.12% 16.42% 2.73%
Finished
secondary 8.36% 0.00% 1.97% 9.87% 15.44% 5.07% 16.30% 17.19% 3.65% 13.03%
Finished post-secondary or higher
70.89% 92.76% 55.66% 84.90% 74.26% 71.86% 79.97% 61.86% 44.90% 83.62%
Mean and std. deviation on 13-point wealth scale
8.39
(2.57) 10.09 (2.08) 6.22 (2.69) 9.44 (1.86) 9.49 (1.67) 9.30 (1.99) 7.87 (1.91) 6.70 (2.16) 5.81 (2.70) 10.05 (1.81)
Village (less than 3,000 people)
8.43% 13.55% 7.66% 14.43% 6.96% 5.76% 11.51% 0.71% 18.17% 4.41%
Small town (3,000 to 15,000 people)
22.68% 17.36% 17.57% 28.63% 34.48% 22.81% 20.40% 2.38% 29.94% 13.39%
Town (15,000 to 100,000 people)
33.24% 30.83% 28.08% 31.54% 41.31% 42.41% 33.01% 3.54% 26.67% 20.35%
City (More than 100,000 people)
35.65% 38.26% 46.68% 25.40% 17.25% 29.02% 35.08% 93.38% 25.22% 61.84%