Vol. 5, No.2, 2014, 183-191
ISSN: 2279-087X (P), 2279-0888(online) Published on 4 March 2014
www.researchmathsci.org
183
Annals of
Wiener Index of a Cycle in the Context of
Some Graph Operations
K. Thilakam1 and A. Sumathi2
1
PG and Research Department of Mathematics
Seethalakshmi Ramaswami College, Tiruchirappalli – 620 002, India 2
Department of Mathematics, Seethalakshmi Ramaswami College Tiruchirappalli – 620 002, India. Email: [email protected]
Received 31 January 2014; accepted 16 February 2014
Abstract. The Wiener index is one of the oldest molecular-graph-based structure-descriptors. It was first proposed by American Chemist Harold Wiener in 1947 as an aid to determining the boiling point of paraffin. The study of Wiener index is one of the current areas of research in mathematical chemistry. It also gives good correlations between Wiener index (of molecular graphs) and the physico-chemical properties of the underlying organic compounds. That is, the Wiener index of a molecular graph provides a rough measure of the compactness of the underlying molecule. The Wiener index W(G) of a connected graph G is the sum of the distances between all pairs (ordered) of vertices of G. ∑ , , . In this paper, we give theoretical results for calculating the Wiener index of a cycle in the context of some graph operations. These formulas will pave the way to demonstrate the Wiener index of molecular structures.
Keywords: Cycle, Distance, Wiener index
AMS Mathematics Subject Classification (2010): 05C12, 05C85
1. Introduction
Molecular descriptor is a final result of a logic and mathematical procedure which transforms chemical information encoded with in a symbolic representation of a molecule into a useful number or the result of some standardized experiment. The Wiener index
W(G) is a distance-based topological invariant is also a molecular descriptor, it much
used in the study of the structure-property and the structure-activity relationships of various classes of biochemically interesting compounds introduced by Harold Wiener in 1947 for predicting boiling points (. ) of alkanes based on the formula . ,where , , are empirical constants, and w(3) is called path number. It is defined as the half sum of the distances between all pairs of vertices of G[1,11,12]
1
184
Notation:
12 ,
,
,
, !
Our notation is standard and mainly taken from standard books of graph theory [2, 6]. All graphs considered in this paper are simple and connected. The vertex and edge sets of a graph G are denoted by V(G) and E(G) respectively. The distance d(u,v) between the vertices u and v of the graph G is equal to length of the shortest path that connects u and v. The Wiener index of the cycle is defined by
"# $
1
8 &' ()*& & +, **& 1
8 & - 1&& 1 ()*& & +, .
/
In this paper we have investigated some new resultson cycle in the context of some graph operations.
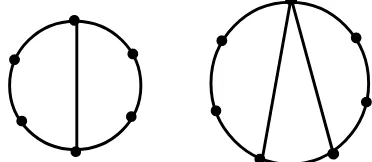
2. Cycle with one diameter and twin diameter[4]
Definition 2.1. A chord of cycle Cn is an edge joining two non-adjacent vertices.
Let V(Cn)={v1,v2…vn}and n be even then the chord (vi, vi+n/2),where1≤i≤ 2
n
of a cycle Cn
is called one diameter . It is denoted by C1d(n)
Definition 2.2. Two chords of a cycle Cnwith n odd vertices are said to be twin diameter ifthe chord between the vertices (vi, vi+(n-1)/2) and (vi, vi+(n+1)/2) of cycle Cn.( ie.) the chords are joining the vertices at diameter distance and they form a triangle with an edge of cycle Cn. It is denoted by C2d(n).
Figure 1: C6 with one diameterC7 with twin diameter
Theorem 1.Consider the cycle with n≥4 vertices
( )
(
)
[
3 18 143 1124]
, 1mod(4)32
1 3 2
2 n = n + n + n− n≡
C
W d when n be odd
[
1]
, 3mod( )
4 321 3+ 2 − − ≡
185
( )
(
)
[
3 ( 2 8) 32]
,32
1 2
1 n = n n + n− +
C
W d n≡0mod
( )
4 when n be even
[
]
( )
4 mod 2 , 8 ) 4 2 ( 3 321 2 + − + ≡
= n n n n
Proof: It follows immediately from the basic definition of W(G).
3. Vertex duplication [10]
Definition 3.1. Duplication of a vertex vkby a new edge = v′v′′ in a graph G produces a new graph G′ such thatN(v′) = {vk; v′′} and N(v′′) = {vk; v′}.
Figure 2: The graph obtained by duplicating all the vertices by edges in cycle C7
Theorem 2. Wiener index of the graph obtained by duplication of all the vertices bynew
edges in cycle Cn is
( )
(
VD C)
=W( )
C +n[n2+6n−4]W n n , when n be odd
( )
(
VD C)
=W( )
C +n[n2 +6n−3]W n n , when n be even
Proof: Let u1, u2…,un be vertices and e1, e2,….,enbe edges of cycle Cn. Let the graph obtained by duplicating all the vertices by edges in cycle Cn is G. Then |V (G)| = 3n,
|E (G)| = 4n.
We can consider the following two cases
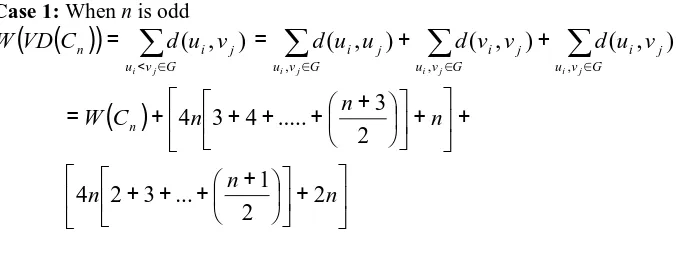
Case 1: When n is odd
( )
(
)
∑
∈ < = G v u j i n j i v u d C VDW ( , )
∑
∑
∑
186
( )
+ [ 2 +6 −4]=W Cn nn n
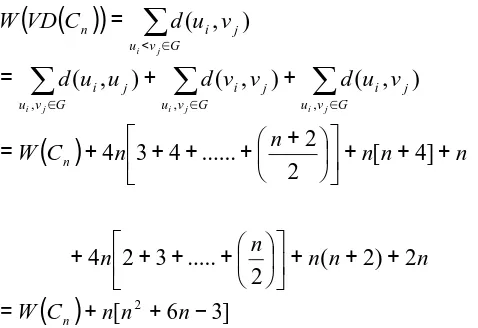
Case 2: When n is even
( )
(
)
∑
∈ < = G v u j i n j i v u d C VDW ( , )
∑
∑
∑
∈ ∈ ∈ + + = G v u j i G v u j i G v u j i j i j i j i v u d v v d u u d , , , ) , ( ) , ( ) , (( )
C n n nn nW n + + +
+ + + + +
= [ 4]
2 2 ... 4 3 4 n n n n
n ( 2) 2
2 ... 3 2
4 + + +
+ + + +
( )
+ [ 2 +6 −3]=W Cn nn n
Note: In Particular, the duplication of all the vertices bynew edges in cycle Cn is also called as corona product Cn o K2, where the corona product G o H is obtained by taking one copy of Gand |V(G)| copies of H; and by joining each vertex of the i-th copy of H to the i-th vertex of G, i = 1, 2, …, |V(G)|.
4. Edge duplication [10]
Definition 4.1. Duplication of an edge e = vivi+1 by avertex v′ in a graph G produces a new graph G′ such that N(v′) = {vi ; vi+1}.
Figure 3: The graph obtained by duplicating all the edges by vertices in cycle C5
Theorem 3.Wiener index of the graph obtained by duplication of all the edges by new
vertices in cycle Cn is
( )
(
ED C)
4W( )
C n2W n = n + , when n be odd
( )
n n C W n 2 14 + 2 −
187
Proof: Let u1, u2……, unbe vertices and e1, e2,…. enbe edges of cycle Cn. Let the graph obtained by duplicating all the edges by vertices in cycle Cn is G. Then |V (G)| = 2n and |E(G)| = 3n.
We can consider the following two cases
Case 1: When n is odd
( )
(
)
∑
∈ < = G v u j i n j i v u d C EDW ( , )
∑
∑
∑
∈ ∈ ∈ + + = G v u j i G v u j i G v u j i j i j i j i v u d v v d u u d , , , ) , ( ) , ( ) , (( )
( )
22 1 2 + + + +
=W Cn W Cn n n n [8
( )
4 ]4
1 3 2
n n n C
W n + + −
=
( )
(
)
( )
24W C n C
D
W Ε n = n +
Case 2: When n is even
( )
(
)
∑
∈ < = Ε G v u j i n j i v u d C DW ( , )
∑
∑
∑
∈ ∈ ∈ + + = G v u j i G v u j i G v u j i j i j i j i v u d v v d u u d , , , ) , ( ) , ( ) , (( )
( )
+ + + + = 4 2 2 2 n n n C W CW n n [8
( )
4 2 ]4
1 3 2
n n n C
W n + + −
=
( )
(
DC)
W( )
C n nW n n
2 1
4 + 2 −
= Ε
5. Alternative method
In this paper, we characterize the cycle graph with respect to the duplication of a molecule, molecular bond, in continuation of the paper [9]. Let G be a graph with n vertices. Let λ1,λ2…….λn be its eigen values, then Energy of the graph G is defined by
E=E(G)=
∑
= n i i 1λ
. A graph G on n vertices is said to be hyperenergeticif E >2n − 2. Agraph G on n vertices is said to be hypoenergetic if E(G) < n. Graphs for which E(G) ≥n are said to be non-hypoenergetic.In theoretical chemistry, the π-electron energy of a
conjugated carbon molecule, computed using the Huckel theory, coincides with the energy as defined here. Henceresults on graph energy assume special significance [3,7].
If G is a molecular graph with n nodes, then its adjacency matrix Aij is a square matrix of order n defined as
188
The eigenvalues of the adjacency matrix of G are usually called to be the eigenvalues of G .The largest eigenvalue of G, referred to as the spectral radius of G, will be labeled by λ1. Using λ1as a measure of branching was proposed by one of the present authors as early as in 1977. For decades this branching index has not attracted much attention of theoretical chemists. Recently, studies of the spectral radius as the measure of branching became attractive again. W depends on the size (number of carbon atoms) of the molecules examined, it is purposeful to restrict the consideration to classes of alkane isomers. Our investigation of the relation between W and λ1is being performed on certain class of graphs with respect to the duplication of a molecule,molecular bond of the graph [8].
5.1. Programme
The following MATLAB program illustrates the characterization of Cycle with one, twin chords with Wiener Index, with the extension of the earlier finding [9].
clc clear all
n= input('Cycle with vertices n='); d1 = zeros(1,n-1);
d2 = ones(1,n-2);
C= diag(d1) + diag(d2,1) + diag(d2,-1); if rem(n,2)==0
D=zeros(1,n-1); for i=1:n-1 D(1,1)=1; D(1,n-1)=1; D(1,n/2)=1; end
D;
A1=[0 D;D' C] disp('Eigen value1') EV1=eig(A1)
SpectralRadiusofG =max(EV1) E1 = abs(EV1);
Energy1=sum(sum(E1)) G1 = sparse(A1); disp('Distance matrix')
DM1 = graphallshortestpaths(G1,'directed',false) M1=sum(sum(DM1));
fprintf('Wiener index of cycle with one dia: W = %d \n' , M1/2); UG1 = tril(G1 + G1');
view(biograph(UG1,[],'ShowArrows','off','ShowWeights','off')) if Energy1>(2*n)-2
disp('G1 is Hyper energetic') elseif Energy1<=(2*n)-2
189 end
if Energy1<n
disp('G1 is Hypo energetic') elseif Energy1>=n
disp('G1 is Nonhypo energetic') end
else
E=zeros(1,n-1); for i=1:n-1 E(1,1)=1; E(1,(n-1)/2)=1; E(1,(n+1)/2)=1; E(1,n-1)=1; end
E;
A2=[0 E;E' C] disp('Eigen value2') EV2=eig(A2)
SpectralRadiusofG =max(EV2) E2 = abs(EV2);
Energy2=sum(sum(E2)) G2 = sparse(A2); disp('Distance matrix')
DM2 = graphallshortestpaths(G2,'directed',false) M2=sum(sum(DM2));
fprintf('Wiener index of cycle with Twin dia: W = %d \n' , M2/2) UG2 = tril(G2 + G2');
view(biograph(UG2,[],'ShowArrows','off','ShowWeights','off')) if Energy2>(2*n)-2
disp('G2 is Hyper energetic') elseif Energy2<=(2*n)-2
disp('G2 is NonHyper energetic') end
if Energy2<n
disp('G2 is Hypo energetic') elseif Energy2>=n
disp('G2 is Nonhypo energetic') end
end
6. Discussion
1. W(Cid(n))<W(Cn)<W(ED(Cn))<W(VD(Cn)), where i=1,2 2. C1d(n), C2d(n)arenonhyper, nonhypo energetic for all n≥4 3. VD(Cn) is hyperenergetic for all n≥3
VD(Cn) is nonhypoenergetic for all n≥3
190 4. ED(Cn) is hyperenergetic for all n≥3
ED(Cn) is nonhypoenergetic for all n≥3
ED(Cn) has constant spectral radius 3.2361 for all n≥3
Structural Relation between Cn, C1d(n), C2d(n), VD(Cn), ED(Cn) graphs
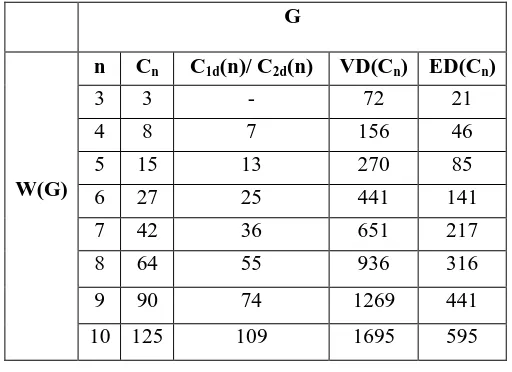
Table 1. Comparing W(Cn) with the Wiener index of C1d(n), C2d(n), VD(Cn) , ED(Cn) graphs
Table 2. Illustrates Wiener indices for n =3 ≤10
7. Conclusion
In this paper, we have determined the Wiener index of a cycle in the context of some graph operations such as Cycle with one diameter and twin diameter, Vertex duplication, Edge duplication and classified its characterization like Energy, Spectral radius using MATLAB.
REFERENCES
1. Ante Graovac and Tomaz Pisanski, On the Wiener index of a graph, Journal of Mathematical Chemistry, 8 (1991) 53-62.
Graph Class Notation Total no. of vertices Total no. of edges
G G G
Cycle graph Cn N N
Cycle with one diameter C1d(n) N n+1
Cycle with twin diameter C2d(n) N n+2
Vertex duplication of a cycle VD(Cn) 3n 4n
Edge duplication of a cycle ED(Cn) 2n 3n
G
W(G)
n Cn C1d(n)/ C2d(n) VD(Cn) ED(Cn)
3 3 - 72 21
4 8 7 156 46
5 15 13 270 85
6 27 25 441 141
7 42 36 651 217
8 64 55 936 316
9 90 74 1269 441
191
2. R.Balakrishnan and K.Renganathan, A Text Book of Graph Theory, Springer-Verlag, New York, 2000.
3. R.Balakrishnan, The energy of a graph, Linear Algebra and its Applications, 387 (2004) 287–295.
4. G.V. Ghodasara and J.P. Jena, Prime cordial labeling of the graphs related to cycle with one chord, twin chords and triangle, Intern. J. Pure and Applied Mathematics, 89(1) (2013) 79-87.
5. I.Gutman and O.E.Polansky, Mathematical Concepts in Organic Chemistry, Springer-Verlag, Berlin, 1986.
6. F. Harary, Graph Theory, Addison –Wesley, Reading, MA, 1971.
7. Ivan Gutman and Dragoˇs Cvetkovi´c, Selected Topics on Applications of Graph Spectra, Beograd :Matematick institut SANU, 2011.
8. Slavko Radenković and Ivan Gutman, Relation between Wiener index and spectral radius, Kragujevac J. Sci.,30 (2008) 57-64.
9. K. Thilakam and A.Sumathi, How to Compute the Wiener index of a graph using MATLAB, Intern. J. Applied Mathematics and Statistical Sciences, 2(5) (2013) 143-148.
10. S.K.Vaidya and C.M.Barasara, Product cordial labeling for some new graphs, Journal of Mathematics Research, 3(2) (2011) 206-211.
11. H. Wiener, Structural determination of paraffin boiling points, J. Am chem. Soc., 6 (1947) 17-20.