251 Copyright © 2011-15. Vandana Publications. All Rights Reserved.
Volume-5, Issue-1, February-2015
International Journal of Engineering and Management Research
Page Number: 251-259
Study on the Behaviour of High Strength Concrete Beam under Combined
Bending and Torsion with and without Hybrid Fibres
T. Sakthi Subramanian1, C. Arun Kumar2
1
Student, SRM University, Department of Civil Engineering, INDIA
2
Assistant Professor, SRM University, Department of Civil Engineering, INDIA
ABSTRACT
The reinforced concrete structural elements such as the peripheral beams in each floor of multi storied buildings, ring beams at the bottom of circular tanks, edge beams of shell roofs, the beams supporting canopy slabs and the helical staircases are subjected to significant torsional loading in addition to flexure. So it becomes necessary to investigate the behaviour of beam under combined bending and torsion in an experimental way. In this project high strength beams will be subjected to combined bending and torsion. In addition to that hybrid fibres are added to the concrete and subjected to combined bending and torsion. The behaviour of reinforced beams under combined bending and torsion with and without hybrid fibre are investigated
.
Keywords— Bending, Hybrid fibre, Reinforced Concrete, Torsion.
I.
INTRODUCTION
High-strength concrete leads to more economical structures. It also leads to reduction in overall building height and dead load, because of the use of thinner slabs and shallower beams. The reinforced concrete (RC) structural elements such as the peripheral beams in each floor of multi storied buildings, ring beams at the bottom of circular tanks, edge beams of shell roofs, the beams supporting canopy slabs and the helical staircases are subjected to significant torsional loading in addition to flexure. Therefore, for understanding the behaviour of reinforced high strength beam, it is necessary to study the beam under combined bending and torsion.
In this project the high strength concrete beam will be subjected to combined bending and torsion. In addition to that hybrid fibres are added to the concrete and it will be subjected to combined bending and torsion.
The effect of concrete strength and behaviour of combined bending and torsion will be investigated in reinforced concrete beams. Thesignificant effect of concrete strength on stiffness and torsional capacity of the beams have been investigated
.
II.
MATERIAL PROPERTIES AND
MIX PROPORTIONS
A. Concrete Mix Concrete is a composite product
produced by mixing cement, aggregates and water. Each constituent has its own role in contributing strength to the composite element. The strength of concrete and steel and deformations of the beam define the limits of strength of reinforced concrete beams. The cracking of the specimens and that of a ductile material like steel define the strength of a brittle material like concrete by yielding. Concrete being a poly-phase material, its properties depend on the properties of the constituent materials. Raw materials listed below were used for preparation of the specimens
i Ordinary Portland Cement (OPC) 53 grade
ii Coarse aggregate with 12.5 mm maximum size
iii Fine aggregate
iv Superplasticizer
v Steel fibres
vi Polypropylene fibres
252 Copyright © 2011-15. Vandana Publications. All Rights Reserved.
aggregate (CA). They have crushing value as 18.8%, Aggregate impact value as 30.23% and specific gravity of 2.72.Fineness modulus of CA is 6.7 River sand of zone II according to IS 383-1970 was used for fine aggregate (FA) with specific gravity of 2.62 and fineness modulus of 2.78
B. Fibre Properties Fibres used are of two
types of fibres namely steel and polypropylene were used and details are given below. Table 2 shows the details of steel fibres and polypropylene fibres. Table 3 shows the properties of polypropylene fibres. Table 4 shows the properties of steel fibres.
C. Compressive strength results Compressive strengths
were measured using a Compression Testing Machine (CTM) with a maximum capacity of 2000 kN. For all tests, each value was taken as the average of three samples. Test results for conventional concrete and Hybrid fibre reinforced concrete after 28 days of curing period was tabulated in Table 5
Figure 1 Hybrid fibres (Polypropylene and steel fibres )in concrete
III. SPECIMEN DETAILS
253 Copyright © 2011-15. Vandana Publications. All Rights Reserved.
studied. The mode of failure of the beam is studied. The results are compared with the conventional and hybrid fibre reinforced concrete beams.
Eight full size beams were tested under combined bending and torsion. These eight beams were divided into two sets A andA1. Set A contains four beams
A, B, C and D with strength of concrete M50 conventional concrete and the beams have cantilever projections at edge , L/3, L/4, L/2 distance along the length of beam respectively.
Set A1 contains four beams A1, B1, C1 and
D1 with strength of concrete M50 Hybrid fibre reinforced
concrete and the beams have cantilever projections at edge , L/3, L/4, L/2 respectively.
The investigated parameters under this study were each beam has cantilever projection varying from other and the results are compared with the hybrid fibre reinforced concrete.
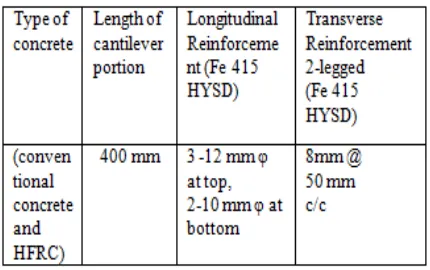
The cross sectional dimension of beam is taken as 150 x 200 mm and length of the beam is taken as 1500 mm for both conventional and hybrid fibre reinforced concrete beams. In both the cases the grade of concrete has been considered as M50. The reinforcement percentage for both conventional and HFRC concrete has been presented in Table 6 and Table 7
Table7 Details of reinforcements for conventional high strength concrete and HFRC (Cantilever portion) for all
specimens
The plan of the beam specimen is shown in Figure 4.1. Cross section of the specimens A, and A1 is
shown in Figure 4.2. Cross section of the specimen B, and B1 is shown in Fig 4.3.cross section of the specimen C,
and C1 is shown in Figure 4.4 cross section of the
specimen D, and D1 is shown in Figure 4.5. The cross
section of A, B, C, D and A1, B1, C1 and D1 and the
cantilever beam are shown in Figure 4.6 respectively.
Figure 2 Plan of the beam specimen A&A1 (Cantilever at
edge)
Figure. 3 Plan of the beam specimen B&B1
254 Copyright © 2011-15. Vandana Publications. All Rights Reserved.
Figure 4 Plan of the beam specimen C& C1 (Cantilever at
L/4 distance along the length of beam)
Figure 5 Plan of the beam specimen D& D1
(Cantilever at L/2 distance along the length of beam)
Figure. 6 Cross section of beam section
Figure 7: Cross section of cantilever beam
IV. MAKING OF SPECIMEN
A. MAKING OF MOULD AND CASTING:
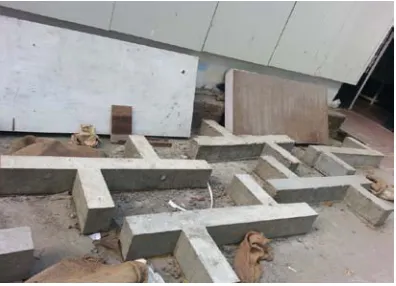
The reinforcement bars were cut to the required lengths. Plywood moulds for the beams were made as shown in the Figure 8. The inner surfaces of the mould were coated with a thin film of oil to prevent adhesion of concrete to the mould. All the ingredients of the mix were weighed and machine mixed. The concrete was placed in the plywood moulds in three layers and internally compacted using a needle vibrator. Care was taken to give uniform compaction in the specimens. The reinforcement with moulds is shown in figure below.
Figure.8 shows beam specimens with cantilever portion at
different points along the length
B. CURING OF SPECIMEN:
255 Copyright © 2011-15. Vandana Publications. All Rights Reserved.
Figure 9 Cured specimens after 28 days
V. CONDUCT OF EXPERIMENT
The testing was done in a loading frame of capacity 40 tones. Load was applied by means of a hydraulic jack of capacity 25 tones. The load was measured using a proving ring of 20 tones capacity.Twists of the beam were measured by using dial gauges which are fixed at both the sides of twist meter and near the mid-point of the beam with a least count of 0.01 mmThe beam to be tested was lifted and kept in the loading platform as shown in Figure. 10. ISMB 175 was placed diagonally and seated on the top surfaces of the cantilever beam.
Cantilever beam was specially designed and cast monolithically with the two ends of the main beam. The steel saddles were made ready to be placed under the beams on both edges to allow the twist when torque is applied.12 mm MS rods have been used in the saddles. Hydraulic jack of 25 T capacity was placed above the ISMB I75 for application of load. 20 T capacity proving ring was placed above the hydraulic jack in the center.The beam was so adjusted that the centers of the proving ring and beams are in the same line by using plumb-bob. Two dial gauges were fixed at two opposite sides of the cantilever in vertical direction and at the midpoint to measure the angle of twist.
Now the arrangement has been made ready for performing the experiment and the dial gauges were also set for zero reading. Torque was constantly applied through the hydraulic jack. ISMB transferred the load to its edges equally. The concrete beam was subjected to a constant torque till the ultimate torque was reached. Spiral cracks were visible all-round the beams as shown in Figures 11 and 12.
Figure 10 Side view of the loading frame with testing specimen
Figure 11 Specimen A1 during testing (spiral crack)
Figure 12 Front view of specimen C during testing (spiral crack)
VI.
RESULTS AND DISCUSSION
A. TORQUE AND TWIST
MEASUREMENTS: During the test for each increment
256 Copyright © 2011-15. Vandana Publications. All Rights Reserved.
are noted and the angle of twist in radians are calculated and are tabulated in Table 8 for the specimens A, B C and A1, B1, C1 respectively.
Table 8 Ultimate torque Vs Twists for specimens A, A1,B,
B1, C,C1
Speci men . Ulti mate Load W, in T Le ver ar m in m Ulti mate Torq ue in kNm Dial gua ge read ing in mid -poin t in mm Aver age dial gaug e readi ng in divis ion Aver age dial gaug e readi ngs in mm Twist (θ) x 10-3 radia ns/m
A 5.5 0.3 8.2 2.68 1280 12.8 85.33
A1 6.5 0.3
9.75 4.45 2047 20.4 7
136.4
6
B 6 0.3
9.0 6.24 2130 21.3 0
142.0
0
B1 7 0.3
10.5 9.37 2340 23.4
0 156.0
C 7 0.3
10.5 6.45 2658 26.5 8
177.2
0
C1 8.5 0.3 12.7 7.00 1784 17.8 118.9
Table 9 Load Vs Deflection measurements for specimens D & D1
Specimen . Applied Load W, in T Dial guage reading in mid-point in mm Average dial gauge reading in division Average dial gauge reading division in mm
D 7.5 24.55 2520 25.20
D1 8.75 15.86 2906 29.06
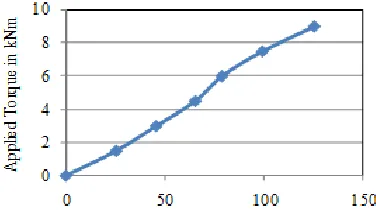
B. GRAPHS FOR TORQUE Vs TWIST
MEASUREMENTS: The corresponding individual
graphs are drawn for torque Vs twist for specimens A, B, C, and A1, B1, C1 and load Vs Deflection for specimens D
257 Copyright © 2011-15. Vandana Publications. All Rights Reserved.
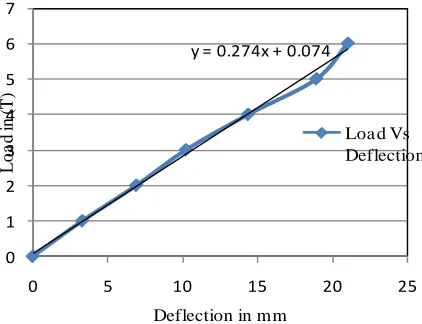
C. GRAPHS FOR LOAD AND DEFLECTION MEASUREMENTS:
During the test for each increment of applied load corresponding dial gauge readings are noted and the deflection in mm are calculated and the graphs are drawn for specimens B C D and B1, C1, D1
y = 0.274x + 0.074
0 1 2 3 4 5 6 7
0 5 10 15 20 25
L
o
a
d
in
(T
)
Deflection in mm
Loa d Vs Deflection
respectively
258 Copyright © 2011-15. Vandana Publications. All Rights Reserved.
y = 0.354x + 0.317
0 1 2 3 4 5 6 7 8 9 10
0 5 10 15 20 25
L oa d in (T )
Deflection in mm
Load Vs Deflecti on
Figure 18 Load Vs Deflection for beam specimen B
y = 0.261x + 0.638
0 1 2 3 4 5 6 7 8
0 10 20 30
L oa d in (T )
Deflection in mm
Load Vs Defl…
1
Figure 19 Load Vs Deflection for beam specimen C
y = 0.443x + 0.570
0 1 2 3 4 5 6 7 8 9 10
0 5 10 15 20
L o a d in (T )
Deflection in mm
Loa d Vs Deflect ion
Figure 20 Load Vs Deflection for beam specimen C1
y = 0.281x + 0.255
0 1 2 3 4 5 6 7 8
0 10 20 30
L oa d in (T )
Deflection in mm
Load Vs Deflection
Figure 21 Load Vs Deflection for beam specimen D
y = 0.280x + 0.436
0 2 4 6 8 10
0 10 20 30 40
L oa d in (T )
Deflection in mm
Load V s Deflectio n
259 Copyright © 2011-15. Vandana Publications. All Rights Reserved.
D.FAILURE CURVE:
The specimens A, A1 are subjected to pure
torsion. The specimens B, B1, C, C1 are subjected to
combined bending and torsion. The specimens D, D1 are
subjected to bending alone. The failure curve shows the mode of failure for specimens A, B, C, D in Figure 23 and for specimens A1, B1, C1, D1 in Figure 24
Fi g u r e 2 3 Mod e o f fa i l u r e for sp e ci m en s A, B, C , D
Fi g u r e 2 4 Mod e o f fa i l u r e for sp e ci m en s A1,
B1, C1, D
In this study, behaviour of beam under combined bending and torsion have been studied for both conventional concrete and Hybrid fibre reinforced concrete. From the experiment it has been found that the beam specimens A, A
1
V.
CONCLUSION
1 experience pure torsional load
whereas specimens B, B1, C, C1 experiences both
combined bending and torsion. The specimens D, D1
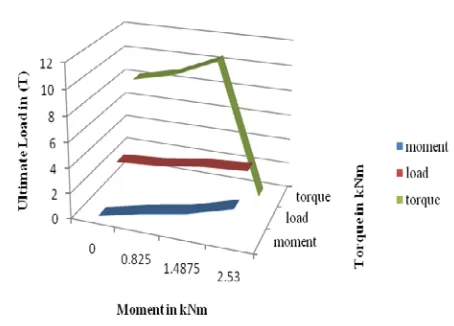
It has been found that among the specimens without fibre the highest ultimate load was in specimen D. This is due to the fact that the specimen experiences bending alone. The specimens C and B experiences both combined bending and torsion and therefore specimen C takes more load compared to B. The specimen A takes less load because it experiences pure torsion. Similarly, the same pattern is found in specimens with fibres. Specimen D
are subjected to bending alone.
1 takes more load compared to C1 followed by B1 and
A1.The addition of hybrid fibres increases the ultimate
load of specimen A1 by 16.5 %, specimen by 21.5 %,
specimen C1 by 16.5%, specimen A1 by 18.2%.
REFERENCES
[1] Pawlak .W, Kaminski M, ‘Cracking of reinforced concrete beams under torsion-Theory and Experimental research’. Archives of Civil and Mechanical Engineering 12(2012)
[2] Tan. E.L, Uy . B, ‘Experimental study on straight composite beams subjected to combined flexure and torsion’.Journal of Construction Steel Research 65 (2009) [3] Hao-Jan Chiu, I-Kuang Fang, ‘Behaviour of Reinforced concrete beams with minimum torsional reinforcement’,Engineering Structures 29 (2007)
[4] Faisal F. Wafa, Sabri Shihata. A, ‘Pre-stressed High strength concrete beams under torsion’, J. Struct. Eng. 1995.