66
Copyright © 2018. IJEMR. All Rights Reserved.
Volume-8, Issue-2, April 2018
International Journal of Engineering and Management Research
Page Number: 66-73
DOI:
doi.org/10.31033/ijemr.v8i02.11960
Fabrication and Characterisation of Aluminium Based Silicon Carbide
Composite
Biswajeet Sahoo1, Biswajit Nayak2 and Rashmi Ranjan Panda3
1PG Scholar, Department of Mechanical Engineering, Centurion University of Technology and Management, Odisha, INDIA 2,3
Associate Professor, Department of Mechanical Engineering, Centurion University of Technology and Management, Odisha, INDIA
1Corresponding Author: [email protected]
ABSTRACT
In this work aluminium based silicon carbide composite material with different percentage of silicon carbide and magnesium has been fabricated. Various tests such as XRF, hardness test, roughness test, tensile test, compressive test have been conducted to determine the various properties of the composite material. From the various tests it has been observed that with the addition of silicon carbide the hardness of composite material increases. This material is suitable for the manufacturing of gears for low and medium load application.
Keywords— Aluminium, Silicon, Magnesium, Composite
I.
INTRODUCTION
Composite materials are important engineering materials due to their outstanding mechanical properties. Composites are materials in which the desirable properties of separate materials are combined by mechanically or metallurgically binding them together. Each of the components retains its structure and characteristic, but the composite generally possesses better properties. Composite materials offer superior properties to conventional alloys for various applications as they have high stiffness, strength and wear resistance.
The development of these materials started with the production of continuous-fiber reinforced composites. Due high cost and difficulty of processing these composites restricted their application and led to the development of particulate reinforced composites. Aluminum and its alloys possess excellent properties such as low density, good plasticity and ductility and good corrosion resistance. They find extensive applications in aeronautics, astronautics, and automobile and high speed
train fields. However, low hardness and poor impact resistance results in their limited application in heavy duty environments. Like all composites, aluminum-matrix composites are not a single material but a family of materials whose stiffness strength, density, thermal and electrical properties can be tailored.
The matrix alloy, the reinforcement material, the volume and shape of the reinforcement, the location of the reinforcement, and the fabrication method can all be varied to achieve required properties. Regardless of the variations, however, Al composites offer excellent thermal conductivity, high shear strength, excellent abrasion resistance, high temperature operation, non-flammability, minimal attack by fuels and solvents, and the ability to be formed and treated on conventional equipment. Silicon carbide (SiC) is composed of tetrahedral of carbon and silicon atoms with strong bonds in the crystal lattice. This produces a very hard and strong material. SiC is not attacked by any acids or alkalis or molten salts up to 800 ᵒC. In air, SiC forms a protective silicon oxide coating at 1200 ᵒC and is able to be used up to 1600 ᵒC. The high thermal conductivity coupled with low thermal expansion and high strength gives this material exceptional thermal shock resistant qualities. SiC ceramics with little or no grain boundary impurities maintain their strength to very high temperatures, approaching 1600 ᵒC with no strength loss.
67
Copyright © 2018. IJEMR. All Rights Reserved.
sinks, automotive drive shafts, or explosion enginecomponents.
Aluminium is a chemical element with symbol Al and atomic number 13. It is a silvery-white, soft, nonmagnetic and ductile metal in the boron group. By mass, aluminium makes up about 8% of the Earth's crust; it is the third most abundant element after oxygen and silicon and the most abundant metal in the crust, though it is less common in the mantle below. The chief ore of aluminium is bauxite. Aluminium metal is so chemically reactive that native specimens are rare and limited to extreme reducing environments. Instead, it is found combined in over 270 different minerals.
Aluminium is remarkable for its low density and its ability to resist corrosion through the phenomenon of passivation. Aluminium and its alloys are vital to the aerospace industry and important in transportation and building industries, such as building facades and window frames. The oxides and sulphates are the most useful compounds of aluminium.
Silicon carbide (SiC), also known as carborundum is a semiconductor containing silicon and carbon with chemical formula SiC. It occurs in nature as the extremely rare mineral moissanite. Synthetic silicon carbide powder has been mass-produced since 1893 for use as an abrasive. Grains of silicon carbide can be bonded together by sintering to form very hard ceramics that are widely used in applications requiring high endurance, such as car brakes, car clutches and ceramic plates in bulletproof vests. Electronic applications of silicon carbide such as light-emitting diodes (LEDs) and detectors in early radios were first demonstrated around 1907. SiC is used in semiconductor electronics devices that operate at high temperatures or high voltages, or both. Large single crystals of silicon carbide can be grown by the Lely method; they can be cut into gems known as synthetic moissanite. Silicon carbide with high surface area can be produced from SiO2 contained in plant material. Its density is 3210 kg/m3.
Magnesium is a chemical element with symbol Mg and atomic number 12. It is a shiny gray solid which bears a close physical resemblance to the other five elements in the second column (group 2, or alkaline earth metals) of the periodic table: all group 2 elements have the same electron configuration in the outer electron shell and a similar crystal structure.
Magnesium is the ninth most abundant element in the universe. It is produced in large, aging stars from the sequential addition of three helium nuclei to a carbon nucleus. When such stars explode as supernovas, much of the magnesium is expelled into the interstellar medium where it may recycle into new star systems. Magnesium is the eighth most abundant element in the Earth's crust and the fourth most common element in the Earth (after iron, oxygen and silicon), making up 13% of the planet's mass and a large fraction of the planet's mantle. It is the third
most abundant element dissolved in sea water, after sodium and chlorine.
Mao [1] has studied the dependent of gear performance on load. He noted that a sudden transition to high wear rates when the transmitted torque is increased to a critical value. This happens because the gear surface temperature of the material is reaching its melting point. He observed that for a given geometry of actual gear, a critical torque can be decided from its surface temperature calculation.
Mao [2] adopted the numerical approximation using finite different method for the analysis of the flash temperature for polymer composite gears. Also he has compared the results obtained by using semi-analytical method assuming no internal hysteresis and the material properties are constant.
Yakut et al [3] has investigated the Load carrying capacity and occurring damages of gears which are made of PC/ABS blends. In this study, usability of PC/ABS composite plastic materials as spur gear was investigated.
Moya and Machado [4] performed a theoretical analysis of the procedure to determine the Lewis Factor and also performed the contact analysis of spur gears to find the stress distribution between gear teeth.
Tsai brothers [5] established a characterization method for seven polyamide (PA) grades to determine the major material to manufacture an automotive worm gear. They measured the properties of the composite according to the worm gear loadings: tensile strength, Young's modulus, abrasion and impact resistance. The properties were also correlated to the PA moisture absorption and its glass fiber (GF) reinforcement.
Acilar and Gul [6] investigated a composite with Al–8.7 wt. % Mg matrix alloy reinforced with SiCp. It was added as dispersed particles by Vortex method. Better distribution of SiCp was obtained in matrix
Dong et al [7] studied the as-cast microstructures, the evolution of the microstructures during reheating, and the mechanical properties of thixoformed products of 7075 Al alloy cast by liquid us semi continuous casting (LSC).
Mitra et al [8] prepared the Al matrix composites reinforced with unoxidized or oxidized SiC and varying Mg concentrations were prepared using stir casting technique. The alloying of Al matrix with 0.5 or 1 wt.% Mg and its segregation at the interfaces has been found to be effective in restricting the formation of the Al4C3 at the interfaces during casting.
68
Copyright © 2018. IJEMR. All Rights Reserved.
The heat treatable 2024-T3 Al alloy werecharacterized by the use of modern metallographic and material treated techniques (e.g., EPMA and SEM). The microstructural characterization of the metallographic specimen involved use of an optical microscope linked with a computerized imaging system using MSQ software [10].
In this work the Al based silicon carbide composites have been prepared using electric arc furnace heating and sand mould casting technique. Various tests have been conducted to determine the properties of the composite.
II.
FABRICATION
In this section the aluminum silicon carbide composite material has been fabricated by various processes such as cutting, melting and casting. To fabricate the aluminum silicon carbide composite material, the considered constituent materials are aluminum, silicon carbide and magnesium. Various instruments are used to prepare the composite. In the following sections the details of the fabrication process has been explained.
Preparation of molten metal
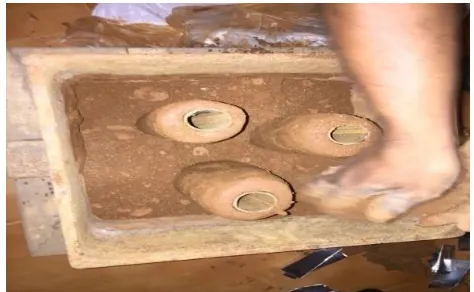
Initially the constituents of the composite material such as aluminum, silicon carbide and magnesium are procured as per the weight percentage of the composite material. Here to prepare the molten for to composite bars, the weight of various constituents is shown in the table 1. First the aluminum in the form of small pieces are put in the furnace (Electric arc furnace, 240 volt make Zephyrs interprieces) as shown in the figure 1. Then the temp is maintained at 700oC to melt the aluminum. Then the silicon carbide and magnesium are added to the molted aluminum to prepare the mixture of different constituent. Then the melting chamber of furnace is maintained at a temperature of 8000C in order to ensure the proper mixing of the three constituents. Then the molten metal is ready to make the composite bars.
TABLE 1
PERCENTAGE OF VARIOUS CONSTITUENTS TO PREPARE THE BARS OF COMPOSITE MATERIAL Sample Al(gm) Si(gm) Mg(gm)
1 1000 5 6.5
2 1000 10 12
Figure 1. Electric arc furnace for melting of various constituents of the composite
Preparation of composite bars
By casting process the composite bars are prepared. The process of preparation of composite bars is explained in the following sections.
Mould
To prepare the mould, the sand and the soil are mixed together in proportion. The bulk clay is added to the soil to increase the elasticity property of the soil. Then the sand mixture is put into the wooden mould box. To make the mixture very tight Rammer, strike of bar for label of soil, prowl, hammer are used. This mould is shown in figure 2.
Mould cavity
The sand is typically contained in a system of frames or mold boxes known as a flask. The mold cavities and gate system are created by compacting the sand around models called patterns, by carving directly into the sand. The pattern which is used to make the mould cavity is 180 mm length and 27mm diameter. This process is shown in figure 2.
Pouring of the molten
The pattern is removed and the mould cavity is filled with molten metal. With the help of ladle and funnel the molten metal is poured into the mould cavity. This process is shown in figure 3.
Figure 2. Mould and mould cavity to make the composite bars
69
Copyright © 2018. IJEMR. All Rights Reserved.
Cooling and the molten metal
In this process the hot metal which is being poured in the mould cavity is allowed to cool at room temperature. This process is being shown in figure 4. The metal is allowed to cool at room temperature. The mould is broken away and the bars of the composite material are removed.
Figure 4. Fabricated bars of aluminium silicon carbide composite (a) Sample 1 and (b) Sample 2
III. CHARACTERIZATION
X-ray fluorescence (XRF)
In this chapter the various properties of the aluminum silicon carbide composite material have been determined by conducting various tests. To conduct various test the equipment are available in the laboratory are used. The details procedure and determined properties are discussed in the following sections.
X-ray fluorescence (XRF) is the emission of characteristic "secondary" (or fluorescent) X-rays from a material that has been excited by bombarding with high-energy X-rays or gamma rays. The phenomenon is widely used for elemental analysis and chemical analysis, particularly in the investigation of metals, glass, ceramics and building materials, and for research in geochemistry, forensic science, archaeology and art objects such as paintings and murals.
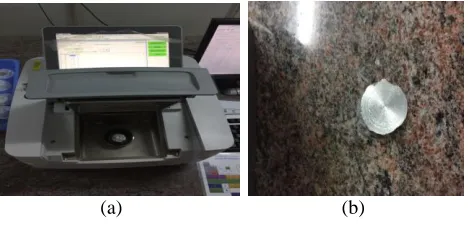
In this test the different elements of the composite material and their percentage have been observed. To conduct this test two sample specimens have been cut from the casted bars. The figure 5 shows the XRF test of the sample 1 and 2. Table 2 shows the different elements and their percentage present in the composite materials. Table 2 shows that the composite consists of 88% of Al, 4.3% of Sic and 4.8% of Mg. Similarly XRF test for the sample 2 has been conducted and the elements and their percentage are shown in the table 2. Table 2 shows that the composite consists of 88% of Al, 8.7% of Sic and 9.4% of Mg.
(a) (b)
Figure 5. (a) XRF machine (b) Specimen of sample 1
TABLE 2
ELEMENTS AND THEIR PERCENTAGE PRESENT IN THE SAMPLE 1 AND 2 OF THE COMPOSITE Composition Sample 1 Sample 2
Al 88.235% 88.121%
SiC 4.325% 8.754%
Mg 4.898% 9.425%
Hardness
Hardness is a measure of the resistance to localized plastic deformation induced by either mechanical indentation or abrasion [11]. Some materials (e.g. metals) are harder than others (e.g. plastics). Macroscopic hardness is generally characterized by strong intermolecular bonds, but the behaviour of solid materials under force is complex; therefore, there are different measurements of hardness: scratch hardness, indentation hardness, and rebound hardness.
Hardness is dependent on ductility, elastic stiffness, plasticity, strain, strength, toughness, visco-elasticity, and viscosity.
The Rockwell scale is a hardness scale based on indentation hardness of a material. The Rockwell test determines the hardness by measuring the depth of penetration of an indenter under a large load compared to the penetration made by a preload. There are different scales, denoted by a single letter, that use different loads or indenters. The result is a dimensionless number noted as HRF, where the last letter is the respective Rockwell scale (shown below). When testing metals, indentation hardness correlates linearly with tensile strength. This important relation permits economically important non destructive testing of bulk metal deliveries with lightweight, even portable equipment, such as hand-held Rockwell hardness testers.
70
Copyright © 2018. IJEMR. All Rights Reserved.
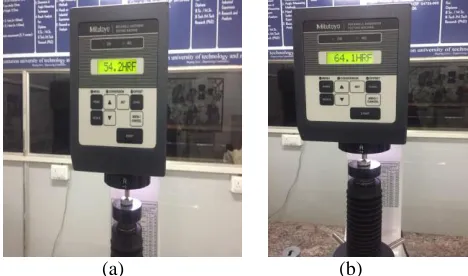
The figure 6 (a) and (b) shows the hardness test ofthe sample 1 and 2. The hardness values obtained from the test are presented in the table 3. It can be observed that with increase in SiO2 the hardness of the composite increases.
(a) (b)
Figure 6. (a) Hardness test of specimen 1 and (b) Hardness test of specimen 2
TABLE 3
HARDNESS VALUES OF TWO SPECIMENS Sample no Composition Hardness(hrf)
1 Al-Sic-Mg 54.2 2 Al-Sic-Mg 64.2
Roughness
Roughness is an important parameter when trying to find out whether a surface is suitable for a certain purpose. Rough surfaces often wear out more quickly than smoother surfaces. Rougher surfaces are normally more vulnerable to corrosion and cracks, but they can also aid in adhesion.
A roughness tester is used to quickly and accurately determine the surface texture or surface roughness of a material. A roughness tester shows the measured roughness depth (Rz) as well as the mean roughness value (Ra) in micrometers or microns (µm). Measuring the roughness of a surface involves applying a roughness filter. Different international standards and surface texture or surface finish specifications recommend the use of different roughness filters. For example, a Gaussian filter often is recommended in ISO standards. The figure 7 shows the TAYLOR HOBSON roughness checker machine and measurement of roughness of various specimens.
The most common and popular method amongst method among all is interpreting the average roughness indication. This is known as Ra in which R stands for Roughness and a stands for average. The other methods are Rz, Rt, Rmax etc.
(a) (b)
Figure 7. (a) TAYLOR HOBSON roughness checker machine (b) setup for checking roughness
The figure 8 shows the waviness profile and average roughness of the specimen 1 obtained from the roughness test. Similarly the same test has been conducted on the same surface at different locations on the surface of the specimen 1. The figure 9 shows the waviness profile and average roughness of the specimen 2 obtained from the roughness test. Similarly the same test has been conducted on the same surface at different locations on the surface of the specimen 2. The average roughness values obtained from the roughness tests for both the specimens are listed in the table 4. It has been observed that the average of roughness average values of specimen 2 is more than that of the specimen 1. It is due to the presence of more percentage of silicon carbide in specimen 2 compare to the specimen 1. With increase in percentage of silicon carbide in aluminum the hardness of the composite increases.
Tensile and Compressive Test
The tensile and compressive tests have been conducted using universal testing machine (UTM). To conduct the tensile and compressive tests four specimens have been prepared. The standard ASTM B209is followed to prepare the specimen and for conducting the test.
The tensile test of both the specimens is conducted on universal testing machine as shown in figure
Figure 8 (a) Waviness profile of the surface (b) average roughness of the surface of the specimen 1
Waviness profile, Gaussian Filter, cut-off 0.800 mm
0 0.5 1 1.5 2 2.5 3 3.5 4 4.5 5 5.5 6 6.5 7 7.5 mm
µm
-30 -20 -10 0 10 20 30 40 50 60
b
Length = 8.00 mm Pt = 65.3 µm Scale = 100 µm
0 0.5 1 1.5 2 2.5 3 3.5 4 4.5 5 5.5 6 6.5 7 7.5 mm
µm
-30 -20 -10 0 10 20 30 40 50 60
71
Copyright © 2018. IJEMR. All Rights Reserved.
Figure 9 (a) Waviness profile of the surface (b) averageroughness of the surface of the specimen 2
TABLE 4
AVERAGE ROUGHNESS OF THE SPECIMENS 1 AND 2
Specim en
Average roughness
Averag e Observati
on 1
Observati on 2
Observatio n 3
1 1.93 1.97 2.05 1.98 2 1.95 2.01 2.15 2.02
10. The dimensions of the specimens are measured using vernier caliper. In the software is set to the tensile test mode provided on the graphical display on computer. Then the specimens are fixed up in between upper cross head and lower cross head with the help of jaws on the loading side. The required data of specimens are feed in the controller. During the test the required data is measured and noted till the specimens are braked.
Figure10 Tensile test of the composites
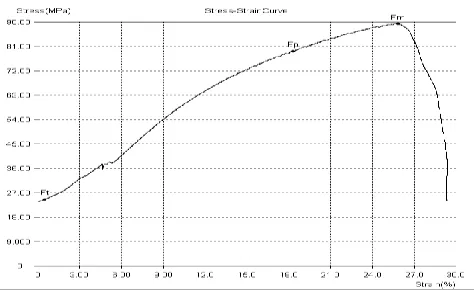
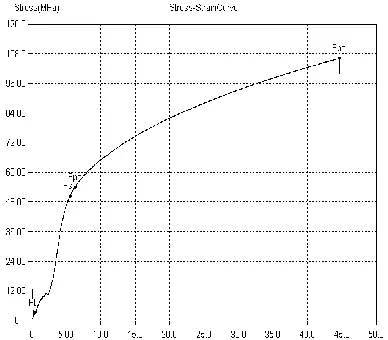
The figures 11 and 12 show the stress strain curves obtained from the tensile test. The Young’s moduli of both the specimens obtained from the stress strain diagram are shown in the table 5.
Figure 11 Stress-strain diagram of tensile test of specimen 1
Figure 12 Stress- strain diagram of tensile test of specimen 2.
From the table 5 it can be observed that the Young’s modulus of specimen 2 is more than that of the specimen 1. This is due to the presence of more silicon carbide in the specimen 2 which causes the decrease in elasticity property.
TABLE 5
YOUNG’S MODULI OF BOTH THE SPECIMENS
Specimen Young’s modulus (Mpa)
Specimen 1 10.7
Specimen 2 25
Compressive test
The compressive test of both the specimens is conducted on universal testing machine as shown in figure13. The dimension of test piece is measured at three different places along its height/length. The software is set to the compressive test mode. The ends of the specimens
Length = 8.00 mm Pt = 65.3 µm Scale = 100 µm
0 0.5 1 1.5 2 2.5 3 3.5 4 4.5 5 5.5 6 6.5 7 7.5 mm
µm
-30 -20 -10 0 10 20 30 40 50 60
a
)
Waviness profile, Gaussian Filter, cut-off 0.800 mm
0 0.5 1 1.5 2 2.5 3 3.5 4 4.5 5 5.5 6 6.5 7 7.5 mm
µm
-30 -20 -10 0 10 20 30 40 50 60
72
Copyright © 2018. IJEMR. All Rights Reserved.
are plane because ends are rested on a bearing plate. Thenthe specimen is placed centrally between the two compressions plates, such that the centre of moving head is vertically above the centre of specimen. Then load is applied on the specimen by moving the movable head. Then the required data of specimens are feed in to controller. During the test the required data is measured and noted till the specimens are failed.
Figure 13 Compressive test of the composites
The figure 14.and 15 show the stress strain curves obtained from the compressive test. The Young’s moduli of both the specimens obtained from the stress strain diagram are shown in the table 6.
Figure 14 Stress- strain diagram of compressive test of specimen 1
Figure 14 Stress- strain diagram of compressive test of specimen 2
From the table 6, it can be observed that the Young’s modulus of specimen 2 is more than that of the specimen 1. This is due to the presence of more silicon carbide in the specimen 2 which causes the decrease in elasticity property.
TABLE 6
YOUNG’S MODULI OF BOTH THE SPECIMENS.
Specimen Young’s Modulus (MPa)
Specimen 1 9.12
Specimen 2 12.9
IV.
CONCLUSION
In the present work the aluminum based silicon carbide composite has been fabricated with different percentage of silicon carbide and magnesium. Various tests such as XRF, hardness test, roughness test, tensile test, compressive test have been conducted to determine the various properties of the composite.
73
Copyright © 2018. IJEMR. All Rights Reserved.
REFERENCES
[1] K. Mao. (2006). A new approach for polymer composite gear design. Wear, 262(3-4), 432-441.
[2] K. Mao. (2007). A numerical method for polymer composite gear flash temperature prediction. Wear, 262 (11-12), 1321-1329.
[3] R.Yakut, H.Duzcukoglu, & M.T.Demirci. (2009). The load capacity of PC/ABS spur gears and investigation of gear damage. Archives of Materials Science and Engineering, 40(1), 41-46.
[4] J.L. Moya & A.S. Machado. (2007). A new approach for polyamide composite gear design. Wear, 262(324), 432-441. [5] M.H. Tsai & Y.C. Tsai. (1997). A method for calculating static transmission errors of plastic spur gears using FEM evaluation. Finite Elements in Analysis and Design, 27(4), PP- 345-357.
[6] Acilar M & Gul F. (2004). Effect of the applied load, sliding distance and oxidation on the dry sliding wear behaviour of Al–10 Si/SiCp composites produced by vacuum infiltration technique. Materials and Design, 25(3), 209-217. [7] Dong J, Cui Jz, Le Qc, & Lu Gm. (2003). Liquidus semi-continuous casting, reheating and thixoforming of a wrought aluminum alloy 7075. Materials Science and Engineering: A, 345(1-2), 234-242.
[8] Mita R, Chalapathi Roa Vs, Maiti R, & Chakraborty M. (2004). Stability and response to rolling of the interfaces in cast Al–SiCp and Al–Mg alloy–SiCp composite. Materials Science and Engineering: A, 379(1-2), 391-400.
[9] Mondal C & Mukhopadhyay A K. (2005). On the nature of T(Al2Mg3Zn3) and S(Al2CuMg) phases present in as-cast and annealed 7055 aluminum alloy. Materials Science and Engineering: A, 391(1-2), 367-376.
[10] Huda Z, Taib Ni, & Zaharinie T. (2009). Characterization of 2024-T3: an aerospace aluminum alloy. Materials Chemistry and Physics, 113(2-3), 515-517.