Volume 2011, Article ID 670637,12pages doi:10.1155/2011/670637
Research Article
Bit Error Rate Analysis for an OFDM System with
Channel Estimation in a Nonlinear and Frequency-Selective
Fading Channel
Amir Ligata,
1Haris Gacanin,
2, 3Fumiyuki Adachi,
4Miha Smolnikar,
5and Mihael Mohorcic
51IPSA Institute, 71000 Sarajevo, Bosnia and Herzegovina 2Alcatel-Lucent Bell N.V., 2018 Antwerpen, Belgium
3Communication Group at Energy and Communication Department, IPSA Institute, 71000 Sarajevo, Bosnia and Herzegovina 4Department of Electrical and Communication Engineering, Graduate School of Engineering, Tohoku University,
Sendai 980-8579, Japan
5Jozef Stefan Institute, 1000 Ljubljana, Slovenia
Correspondence should be addressed to Amir Ligata,[email protected]
Received 27 December 2010; Accepted 21 February 2011
Academic Editor: Ibrahim Develi
Copyright © 2011 Amir Ligata et al. This is an open access article distributed under the Creative Commons Attribution License, which permits unrestricted use, distribution, and reproduction in any medium, provided the original work is properly cited.
Orthogonal frequency division multiplexing (OFDM) is an effective technique for high-speed digital transmission over time-dispersive channels. However, for coherent detection, a reliable channel estimation (CE) is required. OFDM is characterized by its high peak-to-average power ratio (PAPR), which makes it very sensitive to nonlinear distortions that may affect the channel estimation accuracy leading to a bit error rate (BER) performance degradation. In this paper, we present closed-form BER expression for OFDM with a pilot-assisted CE in a nonlinear and frequency-selective fading channel. We discuss how, and to what extent, the nonlinear degradation affects the BER performance with the CE based on a time/frequency division-multiplexed (TDM/FDM) pilot. The analysis is based on a Gaussian approximation of the nonlinear noise due to both HPA amplitude limitation and quantization. We also evaluate the estimator’s mean square error (MSE) with both TDM and FDM pilots. Our results show that pilot-assisted CE using FDM pilot is more sensitive to nonlinear distortions than the CE using a TDM pilot, since its pilot subcarriers are affected by nonlinear noise due to both the HPA and the quantization.
1. Introduction
In a terrestrial radio channel, the transmitted signal reaches the receiver through multiple propagation paths, which all have a different relative delay and gain. This produces inter-symbol interference (ISI) and degrades the system’s per-formance [1]. Orthogonal frequency division multiplexing (OFDM) can be used to overcome the channel frequency selectivity, but it requires an accurate channel estimation (CE) for coherent detection. Various CE schemes have been proposed for OFDM [2–5], where the pilot signals are multiplexed either in the time (TDM pilot) or in the frequency domain (FDM pilot). In a fading channel, the performance of an OFDM system with CE using a TDM pilot
gets rapidly degraded whenever the channel has a significant time variance. On the other hand, the CE with an FDM pilot improves the tracking against a fast fading, but the performance degrades, since the noise is spread over all subcarriers due to interpolation.
to amplitude limitation (corresponding to the overloading distortion) can be neglected [6–8]. However, in a real imple-mentation, in order to keep the system complexity and the power consumption low, it is desirable to keep the resolution of the DA/AD converters as low as possible [9, 10]. It was shown, in [11], that the quantization requirements are higher at the receiver end, particularly for severely frequency-selective channels. The analysis of the nonlinear distortions due to amplitude clipping in an OFDMA system is presented in [12], where it was shown that users with less allocated power are subject to stronger nonlinear interference. In [13], the impact of the nonlinear degradation due to amplitude clipping on an OFDM system’s transmission performance was investigated with a computer simulation. To the best of the authors’ knowledge, closed-form BER expressions for an OFDM system with CE in a nonlinear and frequency-selective fading channel has not been presented.
In this paper, we present a theoretical analysis of an OFDM system with a pilot-assisted CE based on TDM and FDM pilots in a nonlinear and frequency-selective fading channel. We derive a closed-form BER and mean square error (MSE) expressions and discuss the sensitivity of both CE schemes to the nonlinear and channel impairments. Unlike previous papers, where nonlinear noise due to the HPA and the quantization is treated separately, we take into consideration the effects of both. Our analysis is based on a Gaussian approximation of the nonlinearity due to the HPA amplitude saturation and the insufficient resolution of the quantization. The results show that the BER performance with pilot-assisted CE based on an FDM pilot is more sensitive to the nonlinear distortion then a TDM pilot, since its pilot subcarriers are affected by nonlinear noise due to both the HPA and the quantization.
The rest of the paper is organized as follows. Section 2 gives an overview of the system model. A performance analysis is given inSection 3, while the numerical results and discussions are presented inSection 4. The conclusion of the paper is set out inSection 5.
2. System Model
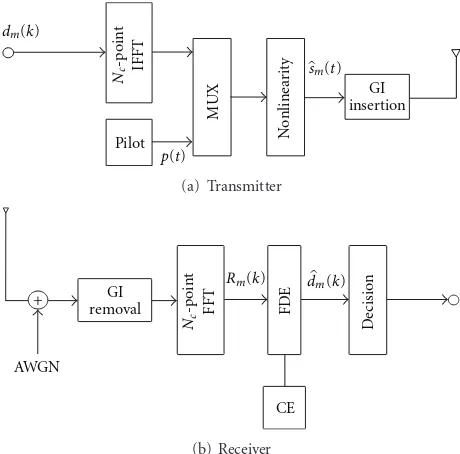
The OFDM transmission system model is illustrated in Figure 1. Throughout this paper, Tc-spaced discrete time
representation is used, whereTc represents the fast Fourier
transform (FFT) sampling period. The mathematical sig-nal representation and brief overview of pilot-assisted CE schemes are presented next.
2.1. Mathematical Signal Representation. Themth (m=. . ., −1, 0, 1,. . .) frame of the Nc data-modulated symbols
{dm(k); k = 0 ∼ Nc−1}withE[|dm(k)|2] = 1 is
trans-mitted during oneTs = NcTc signaling interval. The
data-modulated symbol sequence{dm(k)}is fed to anNc-point
inverse FFT (IFFT) to obtain the time-domain OFDM signal {sm(t); t=0∼Nc−1}.
The nonlinear noise is introduced to the system through an DA conversion and a HPA, as depicted in Figure 2. The OFDM signal is fed to a DA converter to transform
Pilot
GI insertion dm(k)
Nc
-point IFFT
p(t)
^ sm(t)
MUX
N
onl
inea
rit
y
(a) Transmitter
CE
^
dm(k)
Rm(k)
+
AWGN
Nc
-point FFT FDE
Decision
GI removal
(b) Receiver
Figure1: OFDM system model.
the signal from the digital to the analog domain. The DA conversion is represented by the quantization model given in [7]. For quantization with R-bit resolution (i.e., M = 2R quantization levels), the signal after the quantization is
expressed assDA
m (t)= {sDAm (t)}I+ j{sDAm (t)}Q. The in-phase
(I) and quadrature (Q) signal components are given as {sDA
m (t)}I = q[Re{sm(t)}] and {sDAm (t)}Q = q[Im{sm(t)}]
with the quantization function defined as
sDAm [|sm(t)|]
=
⎧ ⎪ ⎪ ⎪ ⎪ ⎪ ⎪ ⎨ ⎪ ⎪ ⎪ ⎪ ⎪ ⎪ ⎩
Qout, |sm(t)|> Qin, Qout
Qin
|
sm(t)|
Δ
Δ+Δ
2 −Qin≤ |sm(t)| ≤Qin, −Qout, |sm(t)|<−Qin,
(1)
where the ·represents the floor function (i.e., rounding to the largest integer not greater than the argument) and the quantization step size is given by Δ = Qin(2/2R −1), whereQin and Qoutdenote the quantizer input and output signal amplitudes, respectively. The required quantization levelsNDAper dimension can be derived asNDA=2C/Δ, withC =31 +σ2
n, whereσn2represents the variance of the
additive white Gaussian noise (AWGN) [7] and.denotes the ceiling function (i.e., rounding to the smallest integer not less than the argument). We assume that the DA converter may exceed the HPA amplitude saturation level as depicted inFigure 3.
The analog signal {sDA
m (t); t = 0 ∼ Nc−1} is fed to
D/A HPA Nonlinearity
sDA m (t)
sm(t) ^sm(t)
Figure2: Nonlinearity model.
HPA characteristic DA converter
characteristic
Input
Output
β
Δ
Figure3: DA converter and HPA input-output characteristics.
characteristic [14], which may be approximated as
sm(t)= ⎧ ⎪ ⎪ ⎪ ⎨ ⎪ ⎪ ⎪ ⎩
sDA
m (t), sDAm (t)< β,
β s DA
m (t) sDA
m (t)
, otherwise,
(2)
fort=0∼Nc−1, whereβdenotes the HPA amplitude
sat-uration level. We note that the relation between βand the input backoffIBO is given as IBO = 10 log10(β2/P
i), where
Pi denotes the average input power. We emphasize that we
introduce the clipping effect through an HPA, for which the input-output soft-limiter characteristic is approximated by (2). Thus, in this paper we refer to amplitude clipping as the amplitude saturation of the HPA. We also note that the PAPR at the output of the HPA is affected byβ, irrespective of the CE scheme; a lowerβwill give a lower PAPR and vice versa [15].
An Ng-sample guard interval (GI) is inserted at the
beginning of each OFDM frame, and the signal is multiplied by the power coefficient2Es/Tc, whereEsdenotes the
data-modulated symbol energy.
Using the Bussgang theorem [16], a nonlinear output can be expressed as the sum of the useful attenuated input replica and an uncorrelated nonlinear distortion as [16]
sm(t)=
2Es
TcNc
[αsm(t) +sm(t)], (3)
where α and sm(t), respectively, denote the attenuation
constant and noise due to the nonlinearity. The attenu-ation constant α is chosen so as to minimize the MSE E[|sm(t)−αsm(t)|2] [17]. It is shown in [17] that for the
amplitude saturation level β > 7 dB, α → 1. For lower β, α can be well approximated as α = 1 −exp(−β2) + (√π/2) erfc{β}[18], where erfc{·}denotes the complemen-tary error function. The nonlinear noise after quantization and HPA can be expressed as sm(t) = λm(t) +φm(t) for
t = 0 ∼ Nc − 1, where λm(t) and φm(t), respectively,
denote the noise due to HPA amplitude saturation, and the quantization. We assume that λm(t) is approximated
as a zero-mean random variable with the variance 2σ2
c =
E[λm(t)λ∗m(t)]=1/Nc(1−exp(−β2)−α2) [17]. Furthermore,
we assume that the quantization noise φm(t) is a
zero-mean random variable with the variance σ2
q given by
E[φm(t)φ∗m(t)]=Δ2/6 [7], whereΔdenotes the quantization
step as illustrated inFigure 3.
After removing the GI, the received signal is decomposed intoNc-subcarrier components{Rm(k); k = 0 ∼ Nc−1}
given by
Rm(k)=
2Es
TcNc
[αdm(k) +Λm(k) +Φm(k)]Hm(k) +
m
(k),
(4)
whereHm(k),Λm(k),Φm(k), and
m(k), respectively, denote
the Fourier transforms of the mth frame’s propagation channel gain, the distorted part of the output signal due to HPA saturation and the quantization and the additive zero-mean white Gaussian noise (AWGN) process with variance 2N0/Tc, whereN0denotes the single-sided power spectrum density. To compensate for the channel distortion on each subcarrier, one tap frequency domain equalization (FDE) is applied as dm(k) = Rm(k)wm(k), where wm(k) = Hm∗(k)
denotes the equalization weight [19]. Using (4), the equalized signal can be represented by
dm(k)=
2Es
TcNc
αdm(k)+Λm(k) +Φm(k)
Hm(k) +
m
(k),
(5)
with
Hm(k)=Hm(k)wm(k),
m
(k)=
m
(k)wm(k).
(6)
2.2. Channel Estimation Overview[2–5]. In this section, we first give a short overview of pilot-assisted CE with a TDM pilot, and then pilot-assisted CE with a FDM pilot is presented.
2.2.1. CE with TDM Pilot. In pilot-assisted CE with a TDM-pilot, the transmission block consists of a number of an (Nc+
Ng)-sample size frames (i.e., the pilot signal is transmitted in
the first (m=0) frame followed byNd−1 data frames) are
Time
Frequency
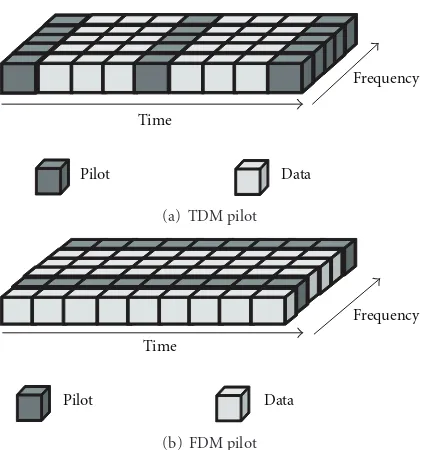
Pilot Data
(a) TDM pilot
Time
Frequency
Pilot Data
(b) FDM pilot
Figure4: Pilot arrangements.
Figure 5illustrates the block diagram for a pilot-assisted CE with a TDM pilot. Form=0, the instantaneous channel gain estimated at the kth frequency is obtained by reverse modulation asH0(k)=R0(k)/P(k) fork=0∼Nc−1, where
P(k) is thekth frequency component of the time-domain pilot signal p(t). In this case, we use the Chu pilot sequence given by {p(t) = exp(jπt2/N
c); t = 0 ∼ Nc −1} [20].
AnNc-point IFFT is performed on{H0(k); k = 0 ∼Nc−
1} to obtain the instantaneous channel impulse response {h0(t); t=0∼Nc−1}. Assuming that the channel impulse
response is present only within the GI, the estimated channel impulse response beyond the GI is replaced with zeros to reduce the noise [21], and an improved channel impulse response {h0(t); t = 0 ∼ Nc−1} is obtained. Then, the
Nc-point FFT is applied to obtain the improved channel gain
estimates{H0,e(k); k=0∼Nc−1}given by
H0,e(k)= Nc−1
t=0
h0(t) exp
−j2πk t Nc
=
2Es
TcNc
H0(k) +Φ0(k) P(k)
+
0(k) P(k)
(7)
fork = 0 ∼ Nc−1, whereΦ0(k) and
0(k), respectively, denote the distorted part of the channel gain estimates at the 0th frame due to the quantization and AWGN at thekth subcarrier.
2.2.2. CE with FDM Pilot. In pilot-assisted CE using the FDM pilot the frequency-domain interpolation is used overNm equally-spaced pilot subcarriers as a subset of Nc
subcarriers. In [22], it was shown that the optimum FDM-pilot scheme is the one with equally spaced inserted FDM-pilots. We also note here that the amplitude saturation levelβhas no effect on the optimal distribution of the pilot subcarriers, since the nonlinear noise is a random variable that is equally
Reverse
modulation Nc
-point IFFT
Nc-point
IFFT Windowing
{R0(k)}
{H˜0(k)} {˜h0(t)} {H0,e(k)}
{P0(k)}
Figure5: Block diagram for CE with TDM pilot.
distributed over all the subcarriers in the frequency domain by the receiver’s FFT.
The channel gain estimates{Hm(q); q= k/Nmfork=
0 ∼ Nc −1} obtained by the reverse modulation can be
expressed as
Hm
q=
2Es
TcNc
αdm
q+Λm
q+Φm
qHm
q Pq
+
m
q Pq ,
(8)
whereNm represents the number of pilot subcarriers. Since
q = k/Nm, the channel estimates are obtained only at
the frequencies k = 0,Nm, 2Nm,. . .,Nc − 1. Hence, an
interpolation is required to obtain the channel gains for all frequencies (i.e.,k=0∼Nc−1). First, theNm-point IFFT
is performed on{Hm(q); q = 0 ∼ Nm−1}to obtain the
instantaneous channel impulse response {hm(t); t = 0 ∼
Nm−1}.{hm(t)}is then fed to theNc-point FFT to obtain
the interpolated channel-gain estimates{Hm,e(k); k = 0 ∼
Nc−1}, which can be represented by
Hm,e(k)
=
Nm−1
q=0
Hm
qΨk,q
=
2Es
TcNc ⎡
⎣Hm(k) +Nm−1 q=0
Λm(k) +Φm(k)
P(k) Ψ
k,q
⎤ ⎦
+
Nm−1
q=0
m(k)
P(k) Ψ
k,q,
(9)
where
Ψk,q= sin
πNm
(Nm/Nc)q−k
/Nc
sinπ(Nm/Nc)q−k
/Nc
×exp−jπ(Nm−1)(Nm/Nc)q−k/Nc
, (10)
fork =0 ∼Nc−1. In (9),Λm(k) andΦm(k), respectively,
3. Performance Analysis
In this section, first the closed-form BER expressions for pilot-assisted CE with both TDM and FDM pilots in a non-linear and frequency-selective fading channel are presented, and then the estimator’s MSE under the same conditions is evaluated.
To date, there have been a lot of papers based on computer simulation for both TDM and FDM pilots, but the theoretical analysis in a nonlinear and frequency-selective channel has not been presented. The probability density functions (PDFs) of the channel estimation error for both TDM and FDM pilot CE are evaluated with computer simulation inFigure 6. It is evident fromFigure 6 that the standard deviation is higher for the FDM pilot, since the channel estimation error values are spread over a wider range. Since Chu sequence is used as TDM pilot with a constant (practicaly a very low) amplitudes in both the time and frequency domains, the channel estimator is only affected by pilot quantization giving the sharper shape on CE error’s PDF in Figure 6. On the contrary, the shape of CE error’s PDF for the FDM pilot is more spread, since the pilot subcarriers are affected by nonlinear noise due to both the HPA and the quantization. Naturally, this will have a negative effect on the FDM pilot performance in comparison with TDM pilot. This will be more discussed in details in Section 4.2.
3.1. BER. We note here that in this analysis, only uniform quantization is considered, since in the case of nonuniform quantization, the quantization errors may not be approxi-mated as Gaussian random variables, and the analysis may become very difficult if not impossible. Our analysis is based on the Gaussian approximation of the nonlinear noise, and the suitability of this approximation is confirmed by computer simulation as shown inFigure 7.
In the following, we assume the quadrature-phase shift keying (QPSK) for data modulation. The decision variables can be represented bydm(k)=XY∗ [1], whereX =Rm(k)
and Y = Hm,e(k) are assumed to be Gaussian random
variables fork = 0 ∼ Nc−1. Thus, the BER for themth
frame is obtained asPb,m =Prob[Re(XY∗)<0], while the
average BER is obtained by [1]
Pb=
1 Nd−1
Nd−1
m=1 1 2
⎛
⎝1− Realμ
1−Im2μ
⎞
⎠, (11)
where μ denotes the normalized covariance given by μ =
mxy/√mxxmy y. Here,mxx = E[|X|2], my y = E[|Y|2] and
mxy =E[XY∗] denote the second moments of the random
variables X, Y, and XY, respectively. Next, we derive the closed-form BER expression in a nonlinear and frequency-selective fading channel with both TDM and FDM pilots.
3.1.1. TDM Pilot. Using (4) and (7), the random variables XandYare given by
−1 −0.5 0 0.5 1
0 5 10 15 20 25 30 35 40 45
Channel estimation error
Eb/N0=25 dB β=0 dB
FDM pilot TDM pilot
Figure6: PDF of the estimator’s error.
X=
2Es
TcNc
[αdm(k) +Λm(k) +Φm(k)]Hm(k) +
m
(k),
Y =
2Es
TcNc
H0(k) +Φ0 (k) P(k)
+
0(k) P(k) ,
(12)
where0(k) denotes the AWGN at thekth frequency fork= 0∼Nc−1. Using (12), the second momentsmxx,my y, and
mxyare given by the appendix
mxx= 2Es
TcNc
α2+ 1 Nc
1−exp−β2−α2
+ 2Es TcNc
Δ2 6 +
2N0 TcNc
,
my y =
2Es
TcNc(A1+A2),
mxy = 2Es
TcNc
A3,
(13)
with
A1=1 +Δ 2
6 ,
A2=
Es
N0 −1
,
A3=αJ0
2π fDTsm
.
(14)
−1 −0.5 0 0.5 1
Figure7: PDF of the nonlinear noise.
gains at the first and the channel gain at the last frame of the block vary due to channel time selectivity caused by the user mobility. We note here that the propagation error effect is captured in (13) by the coefficient A3. After some manipulations, the normalized covarianceμTDMfor CE with the TDM pilot is given by
μTDM= A3
Finally, the average BER is obtained by (11).
3.1.2. FDM Pilot. Using (4) and (9), the random variablesX
given by the appendix
mxx=
Thus, the normalized covarianceμFDMfor CE with the FDM pilot is given by
μFDM= α+Nm(B1+B2) [α2+B
1+B2][1 +Nm(B1+B2)]
, (19)
where B1 and B2 are defined in Section 3.1.1. Finally, the average BER is obtained by (11). We note that in the case of CE with the FDM pilotNd → ∞.
3.1.3. Ideal CE. For the ideal CE, we haveHm,e(k)=Hm(k),
and consequently, using (4), the random variablesXandY are given by
X=
Thus, we obtain the normalized covarianceμIDEALas
3.2. MSE. We define the MSE of the mth frame at the kth subcarrier as MSEm(k) = E[|em(k)|2] = E[|Hm,e(k)−
Hm(k)|2] and assume that the HPA amplitude saturation
levelβis known at the receiver.
3.2.1. TDM Pilot. For CE based on the TDM pilot, the nonlinearity effects the estimation process to a small extent. Thus, it can be neglected, since the Chu pilot sequence with a constant amplitude in both the time and frequency domains is used (i.e., the attenuation constantα =1). However, the quantization noise is present in (7), and consequently, for the TDM pilot we obtain
MSETDM=Δ 2
6 + 1 2
&
1 +Ng Nc
'
Eb
N0 −1
, (23)
whereEb/N0=1/2(1 +Ng/Nc)(Es/N0). The first term in (23) denotes the negative effect of the nonlinearity due to the quantization, while the second term denotes the influence of AWGN.
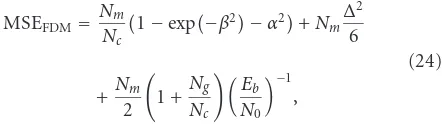
3.2.2. FDM Pilot. CE with the FDM pilot requires a fre-quency interpolation. Thus, the nonlinear noise due to the quantization and HPA amplitude saturation is spread over data subcarriers after the interpolation. Using (9), we obtain the average MSE of the channel estimator with the FDM pilot given by
MSEFDM=Nm Nc
1−exp−β2−α2+N
mΔ
2
6
+Nm 2
&
1 +Ng Nc
'
Eb
N0 −1
,
(24)
where the first, the second, and the last term denote the negative effect of the nonlinearity due to the HPA amplitude saturation, quantization, and AWGN, respectively.
4. Numerical Results and Discussions
The OFDM-based system assumptions used in the computer simulation are given inTable 1. We assume an OFDM signal with Nc = 256 subcarriers, Ng = 16, Nm = 16, and
QPSK data modulation. As the propagation channel, we assume an L = 8-path block Rayleigh fading channel with a uniform power-delay profile; {hl; l = 0 ∼ L−1} are
independent and identically distributed zero-mean complex Gaussian variables having the variance 1/8. It is assumed that the time delay of the lth path isτl = l samples (i.e., the
maximum delay difference is less than the GI length, since L < Ng). We have chosen fDTs=0.0001 for the normalized
Doppler frequency (where 1/Ts=1/[Tc(1 +Ng/Nc)]), which
corresponds to a terminal speed of 40 km/h for a 2 GHz carrier frequencyand a transmission data rate of 1/Ts =
Table1: Numerical parameters.
Data modulation QPSK
Transmitter IFFT/FFT size Nc=256
GI Ng=16
Channel L=8-path frequency-selective block Rayleigh fading
FDE MRC
Receiver Channel estimation TDM and FDM pilots
100 Msymbols/sec. We assume that the data rate is kept the same for both the TDM and FDM pilot schemes since an equal number of pilot subcarriers is transmitted within the transmission block (i.e., in totalNc = NmNd pilots are
transmitted overNd frames) irrespective of CE scheme. In
the case of CE with the TDM pilot, we use a Chu-sequence as a pilot given by{p(t) =exp(jπt2/N
c);t =0 ∼Nc−1}
[20]. We emphasize here that the case ofβ → ∞andΔ=0 represents a linear HPA and an ideal quantizer.
4.1. BER. First, we evaluate the BER performance with pilot-assisted CE using both TDM and FDM pilots in a nonlinear and frequency-selective fading channel. The analytical and simulation results in terms of the average BER performance as a function of the Eb/N0 with amplitude saturation level β as a parameter are illustrated inFigure 8(a) for Δ = 0, that is, without considering the quantization noise. When we include the quantization noise (Δ = 0.05), the BER performance is further degraded, as shown inFigure 8(b). However, the BER performance with CE using the FDM pilot becomes significantly worse. This is because with CE using a FDM pilot, the pilot subcarriers in addition to degradation due to quantization are affected by the HPA as well. Moreover, the frequency-domain interpolation will cause spreading of the nonlinear noise over all the subcarriers leading to a larger BER performance degradation in comparison with CE using the TDM pilot. However, the BER performance with pilot-assisted CE using the TDM pilot is degraded as well, since the nonlinear noise due to the quantization cannot be neglected. It is evident that fairly good agreement between the theoretical and simulated results is achieved, which confirms the validity of our theoretical analysis presented in this paper.
4.2. MSE. Next, we investigated the effect of nonlinearity on the channel estimator with both the TDM and FDM pilots by numerically evaluating its MSE. For the CE with the TDM pilot, we selectNd = 16, while Nm = 16 for the CE with
the FDM pilot, and consequently, the same transmission data rate is maintained.
0 10 20 30 40 50
10−6
10−5
10−4
10−3
10−2
10−1
100
Eb/N0
A
ver
age
BER
Ideal CE
Δ=0
L=8-path frequency-selective
fading channel
Nm=16
Nd=16
Computer simulation,β=0 dB
Computer simulation,β=4 dB
Computer simulation,β=8 dB
Computer simulation,β→ ∞
Theory, TDM pilot Theory, FDM pilot
(a)Δ=0
Δ=0.05
0 10 20 30 40 50
10−6
10−5
10−4
10−3
10−2
10−1
100
Eb/N0
A
ver
age
B
ER
Ideal CE
L=8-path frequency-selective
fading channel
Nm=16
Nd=16
Computer simulation,β=0 dB
Computer simulation,β=4 dB
Computer simulation,β=8 dB
Theory, TDM pilot Theory, FDM pilot
(b)Δ=0.05
Figure8: BER performance.
is because the performance is not affected by the HPA amplitude saturation for the CE using the TDM pilot, since we are using the Chu pilot sequence which has a constant amplitude in both the time and frequency domains.
The impact of the HPA amplitude saturation level βis presented inFigure 9(b)for valueEb/N0 = 35 dB in order to better observe the effect of parameter Δ. It is evident that the quantization noise represented through quantization step Δaffects more the MSE of the channel estimator for the FDM-based pilot-assisted CE. Finally, in Figure 9(c), the impact of Eb/N0 is plotted. In comparison with pilot-assisted CE with the TDM pilot, the MSE of the channel estimator with the pilot-assisted CE based on the FDM pilot is more affected by nonlinear noise. This is because for the CE with the TDM pilot the Chu pilot sequence is used with a constant (practically a very low) amplitudes in both the time and frequency domains, and consequently, the channel estimator’s performance using the TDM pilot is not affected by the HPA. The nonlinear degradations in this case are only due to the quantization. This is because of the fact that for pilot-assisted CE using the FDM pilot, the pilot signals are inserted onto dedicated (i.e., pilot) subcarriers in frequency domain within the OFDM signal. Consequently, the corresponding OFDM signal in the time domain may have a large PAPR causing a signal degradation due to nonlinear noise coming from both the HPA and quantization. After the FFT at the receiver, the nonlinear noise will spread over all the subcarriers and affect the pilot
subcarriers. Naturally, this will have a negative effect on the channel estimator’s performance in comparison with the pilot-assisted CE using the TDM pilot.
5. Conclusions
In this paper, we have presented closed-form BER expres-sions for OFDM with CE based on both TDM and FDM pilots in a nonlinear and frequency-selective fading channel. In our analysis the nonlinear noise is approximated with a Gaussian random variable, where unlike previous studies, we consider the impact of both the DA converter and the HPA. The results show that the pilot-assisted CE with the FDM pilot is affected by the nonlinear noise due to both the quantization and the HPA, while the pilot-assisted CE with the TDM pilot is only affected by nonlinear degradation due to quantization because of the pilot-sequence with low PAPR. Thus, the higher BER with FDM pilot in comparison with TDM pilot is observed. Furthermore, numerical results have confirmed the validity of the analytical derivations in terms of closed-form BER expressions, since a fairly good agreement between the simulation and the analytical results is observed.
Appendix
0.05 0.1 0.15 0.2 0.25 0.3 0.35 0.4 0.45 10−3
10−2 10−1
MSE
β=0 dB β=8 dB β→ ∞ Nd=16 Nm=16
L=8-path frequency-selective fading channel
Δ
TDM pilot FDM pilot
Eb/N0=25 dB
(a) Impact ofΔ
1 2 3 4 5 6 7 8
0 1 2 3 4 5 6 7 8 ×10⁻³
β(dB)
M
S
E
Δ=0.05 Δ=0.1
Nd=16
Nm=16
Δ=0.01 L=8-path frequency-selective
fading channel
Eb/N0=35 dB
TDM pilot FDM pilot
(b) Impact ofβ
15 20 25 30 35 40 45 50
10−5
10−4
10−3
10−2
10−1
100
Eb/N0(dB)
MSE
β=0 dB
β=8 dB
Nd=16
Nm=16
L=8-path frequency-selective
fading channel
Δ=0.01, TDM pilot
Δ=0.08, TDM pilot
Δ=0.01, FDM pilot
Δ=0.08, FDM pilot β→ ∞
(c) Impact ofEb/N0
(1) TDM pilot. Using (4) the second moment mxx of the
random variableXis given by
mxx
and after the expectation over the noise terms the, second momentmxxof the random variableXis obtained as
mxx=
is given by
my y =E the expectation over the noise terms, the second moment my yof the random variableYis obtained as
my y= 2Es
Finally, the second momentmxy of the random variablesX
andYis given by
Due to the fact that the nonlinear noise and the AWGN component at the 0th andmth frames are uncorrelated (i.e., E[Φm(k)Φ∗0(k)] = 0 and E[
m(k)
∗
0(k)] = 0), and the Jakes fading model assumption, the second momentmxy of
the random variablesXandYis obtained as
mxy = 2Es
random variableXis given by
mxx=E
and after the expectation over the noise terms, the second momentmxxof the random variableXis obtained as
Using (9), the second momentmy yof the random variableY
is given by
my y expectation over the noise terms, the second momentmy yof
the random variableYis obtained as
my y= 2Es
Finally, the second momentmxy of the random variablesX
andYis given by
After performing expectation over the noise terms, the second moment mxy of the random variables X and Y is
obtained as
This work was supported in part by Ministry of Civil Affairs of Bosnia and Herzegovina with support grant for preparation of EU FP7-related research projects.
References
[1] J. G. Proakis, Digital Communications, McGraw-Hill, New York, NY, USA, 3rd edition, 1995.
[2] S. Coleri, M. Ergen, A. Puri, and A. Bahai, “Channel estimation techniques based on pilot arrangement in OFDM systems,”IEEE Transactions on Broadcasting, vol. 48, no. 3, pp. 223–229, 2002.
[3] M. H. Hsieh and C. H. Wei, “Channel estimation for OFDM systems based on comb-type pilot arrangement in frequency selective fading channels,” IEEE Transactions on Consumer Electronics, vol. 44, no. 1, pp. 217–225, 1998.
[4] W. Zhang, X. G. Xia, and P. C. Ching, “Optimal training and pilot pattern design for OFDM systems in Rayleigh fading,”
IEEE Transactions on Broadcasting, vol. 52, no. 4, pp. 505–514, 2006.
[5] Y. S. Choi, P. J. Voltz, and F. A. Cassara, “On channel estimation and detection for multicarrier signals in fast and selective Rayleigh fading channels,” IEEE Transactions on Communications, vol. 49, no. 8, pp. 1375–1387, 2001. [6] H. Schmidt and K.-D. Kammeyer, “Quantization and its
effects on OFDM concepts for wireless indoor applications,” in
Proceedings of the 4th International OFDM-Workshop (InOWo ’99), Hamburg, Germany, 1999.
[7] S. Xiaoying and C. H. Slump, “Quantization effects in OFDM system,” inProceedings of the 29th Symposium on Information Theory in the Benelux, pp. 93–103, Leuven, Belgium, May 2008.
[8] D. Dardari, “Joint clip and quantization effects characteriza-tion in OFDM receivers,”IEEE Transactions on Circuits and Systems I, vol. 53, no. 8, pp. 1741–1748, 2006.
Conference (WCNC ’08), pp. 548–553, Las Vegas, Nev, USA, 2008.
[10] M. Sawada, H. Okada, T. Yamazato, and M. Katayama, “Influence of ADC nonlinearity on the performance of an OFDM receiver,”IEICE Transactions on Communications, vol. 89, no. 12, pp. 3250–3256, 2006.
[11] T. Araujo and R. Dinis, “Performance evaluation of quan-tization effects on multicarrier modulated signals,” IEEE Transactions on Vehicular Technology, vol. 56, no. 5, pp. 2922– 2930, 2007.
[12] T. Araujo and R. Dinis, “Analytical evaluation of nonlinear effects on OFDMA signals,” IEEE Transactions on Wireless Communications, vol. 9, no. 11, pp. 3472–3479, 2010. [13] H. G. Ryu, T. P. Hoa, N. T. Hieu, and J. Jianxue, “BER
analysis of clipping process in the forward link of the OFDM-FDMA communication system,”IEEE Transactions on Consumer Electronics, vol. 50, no. 4, pp. 1058–1064, 2004. [14] G. P. White, A. G. Burr, and T. Javornik, “Modelling of
non-linear distortion in broadband fixed wireless access systems,”
Electronics Letters, vol. 39, no. 8, pp. 686–687, 2003.
[15] X. Li and L. J. Cimini, “Effects of clipping and filtering on the performance of OFDM,”IEEE Communications Letters, vol. 2, no. 5, pp. 131–133, 1998.
[16] A. Papoulis, Probability, Random Variables, and Stochastic Processes, McGraw-Hill, New York, NY, USA, 3rd edition, 1991.
[17] D. Dardari, V. Tralli, and A. Vaccari, “A theoretical characteri-zation of nonlinear distortion effects in ofdm systems,”IEEE Transactions on Communications, vol. 48, no. 10, pp. 1755– 1764, 2000.
[18] P. Banelli and S. Cacopardi, “Theoretical analysis and perfor-mance of OFDM signals in nonlinear AWGN channels,”IEEE Transactions on Communications, vol. 48, no. 3, pp. 430–441, 2000.
[19] S. Hara and R. Prasad, “Overview of multicarrier CDMA,”
IEEE Communications Magazine, vol. 35, no. 12, pp. 126–144, 1997.
[20] D. C. Chu, “Polyphase codes with good periodic correlation properties,”IEEE Transactions on Information Theory, vol. 18, no. 4, pp. 531–532, 1972.
[21] O. Edfors, M. Sandell, J. J. D. Van Beek, S. K. Wilson, and P. O. Borjesson, “OFDM channel estimation by singular value decomposition,”IEEE Transactions on Communications, vol. 46, no. 7, pp. 931–939, 1998.