in the population sciences published by the Max Planck Institute for Demographic Research Konrad-Zuse Str. 1, D-18057 Rostock · GERMANY www.demographic-research.org
DEMOGRAPHIC RESEARCH
VOLUME 19, ARTICLE 22, PAGES 795-854
PUBLISHED 01 JULY 2008
http://www.demographic-research.org/Volumes/Vol19/22/ DOI: 10.4054/DemRes.2008.19.22
Research Article
Poland:
Fertility decline as a response to profound
societal and labour market changes?
Irena Kotowska
Janina Jó
ź
wiak
Anna Matysiak
Anna Baranowska
1 Introduction 796
2 Family changes in Poland 798
2.1 Fertility 798
2.1.1 Trends in period fertility 798
2.1.2 Completed fertility and parity distribution 805
2.1.3 Fertility intentions 812
2.1.4 Out-of wedlock births 813
2.2 Union formation and dissolution 815
2.2.1 Marriage 815
2.2.2 Cohabitation 818
2.2.3 Union dissolution 819
3 Determinants of childbearing trends in Poland 821
3.1 The socio-economic context 821
3.2 The labour market and the family 824
3.2.1 General trends 824
3.2.2 Female labour-force participation 825
3.2.3 Educational attainment 829
3.3 Family policy 830
3.3.1 Family benefits 832
3.3.2 Childcare 833
3.3.3 Maternity leave 834
3.3.4 Parental leave 834
3.3.5 Part-time employment 836
4 Remarks on ideational change 837
5 Policy measures intended to reverse the declining fertility in Poland 840
6 Concluding remarks 845
7 Acknowledgements 847
Poland:
Fertility decline as a response to profound
societal and labour market changes?
Irena Kotowska1 Janina Jóźwiak2 Anna Matysiak3 Anna Baranowska4
Abstract
This article opens with a review of the main trends in family-related behaviour, i.e. fertility decline and changes in fertility patterns, a decreasing propensity to marry, postponement of marriage, and a slowly increasing frequency of divorces and separations. The analysis takes into account urban and rural differences. We then aim to identify the main determinants of family changes within the general conceptual framework of the Second Democratic Transition (SDT) in Poland. However, contrary to mainstream interpretations of the SDT, the main emphasis of this study is on the structural components of change, which need to be reformulated to account for processes specific to the transition to a market economy. The focus is, therefore, on labour market developments and family policy, and to a lesser extent on ideational change.
1. Introduction
Family-related behaviour observed in Poland since the 1990s differs remarkably from the behaviour observed up to 1989. To demonstrate how specific recent developments are, we will refer to trends of previous decades. Moreover, due to the notable dissimilarity of fertility patterns and their changes between urban and rural regions special attention is devoted to their comparison
Fertility in Poland is strongly related to marriage; therefore declining nuptiality and postponement of starting a family contribute remarkably to fertility decline. However, developments in out-of-wedlock births, especially since 2000, seem to indicate that this relation is gradually weakening, particularly in urban regions.
This article focuses on a comparison of family-related behaviour in Poland with the main trends observed in other countries that have progressed further into the Second Demographic Transition (SDT). The interpretation uses a conceptual framework that refers to three main components of the modernisation process: structure (industralisation and development of services, urbanisation and other processes leading to the development of post-industrial society and the welfare state), culture (political and global changes, leading to the development of democracy and changes in values and norms), and technology (contraception, medicine, telecommunications, with the spread of information via television) (see, for example, van de Kaa 1994). In explanations of marital and procreative behaviour within the frame of the SDT, the main emphasis is usually placed on culture and technology. In our opinion, structural processes are intrinsically important for ideational change and technological advantage. Economic developments, the rising standard of living, the growing employment of women, and the development of the welfare state are associated with higher educational attainment and an increasing social and spatial mobility of the population. Taken together, these factors influence people’s capability to benefit increasingly from technological progress and to support ideational change.
the preferences and constraints of individuals and groups. In examining trends, we also look at the differences between urban and rural populations. The urban-rural analysis is important for two reasons. First, the family-related behaviours and their changes over time differ between urban and rural populations; at the beginning of the 1990s these differences still existed. It seems, however, that family-related behaviour in rural areas follows the behaviour observed in urban areas. Second, the rural population still accounts for a substantial share of the Polish population.
The main data used in the study include the following:
vital statistics, economic statistics, and labour force survey data (LFS);
results of analyses based on three basic data sources5:
o international data prepared under the DIALOG Project (PPAS data); o data from the representative survey ‘Reconciling work, family, and
education’, carried out in May 2005 on the LFS sub-sample;
o data from the representative survey ‘Reconciliation of work and
family’ recommended by Eurostat as a module to the LFS;
relevant findings of research in the field, including:
o the retrospective survey ‘Family-related attitudes and behaviours of
young and medium age females and males in Poland’ carried out in 2001 (Frątczak, Balicki 2003); and
o the survey ‘Changes in reproductive behaviours in Poland and their
consequences for family and household formation and dissolution’ carried out in 2006 (Frątczak et al. 2006).
Section 2 presents the main trends in family-related behaviour, i.e. fertility decline, changes in fertility patterns, the decreasing propensity to marry, the postponement of marriage, and the gradually increasing frequency of divorce and separation. Sections 3 and 4 address the main determinants of childbearing trends with a focus on the labour market, family policy, and ideational change. In Section 5 we discuss policy measures
5 The DIALOG Project, ‘Population policy acceptance study – the viewpoint of citizens and policy actors
that are supportive to reversing the downward fertility trend. In the final section (6) we offer some concluding remarks.
2. Family changes in Poland
In most general terms, during the last four decades family-related changes in Europe have been demonstrated through a decreasing propensity to marry, marriage and childbearing postponement, and even an increase in the decisions not to have children at all. The growing frequency of divorce and separation as well as the rising popularity of cohabitations and LAT relationships (living-apart-together) indicate that marriage has lost its instrumental significance in forming a family. These behaviours have contributed to the drop in fertility and shifts in fertility patterns: The decision to have a first child has been postponed and the number of extra-marital births has been rising. The depth and permanence of these changes has brought period fertility to a point well below the level that guarantees replacement of generations. The trend has also been observed in cohort fertility, though it has not been so pronounced.
2.1 Fertility
2.1.1 Trends in period fertility
One of the most distinctive features of demographic developments in Poland since 1989 has been a rapid decline in births. The overall number of births has dropped by 37%, from 564,400 in 1989 to 352,785 in 2003 (see Figure 1). Recent data seem to indicate that in urban areas the downward trend has come to a halt. As a result, a slight increase to 357,900 in 2004 and to 364,400 in 2005 was observed.
Figure 1: Live births by region, Poland, 1950–2005
0 100 200 300 400 500 600 700 800 900
1950 1955 1960 1965 1970 1975 1980 1985 1990 1995 2000 2005
Years
In
t
h
o
u
s
a
n
d
total urban rural
Source: CSO data.
Figure 2: Total fertility rate by region, Poland, 1950–2005
1.0 1.5 2.0 2.5 3.0 3.5 4.0 4.5
1950 1955 1960 1965 1970 1975 1980 1985 1990 1995 2000 2005
T
F
R
Intensive decrease in the TFR and the postponement of childbearing, observed in the 1990s constitute a new stage in the trend of long-term fertility decline in Poland. The TFR dropped from 2.07 in 1989 to 1.22 children in 2003 (1.23 in 2004 and 1.24 in 2005; see Figure 2). Within the 15-year period Poland moved from the group of high-fertility countries to the group of lowest-low high-fertility.
The significant fall in the number of children born to women in the first (20–24) and second (25–29) most fertile age groups shaped the shifts in fertility patterns by age. Since 1998 highest fertility has moved to the 25–29 age group (see Figure 3). Recent years showed a slight increase in the fertility of women aged 25–34.
The total contribution to the TFR of the age groups 20–34 did not change during the years 1989–2003 and accounted for 84% of the TFR. However, remarkable shifts occurred between particular ages: In 1989 the fertility of women aged 20–24, 25–29, and 30–34 accounted for 40%, 30%, and 14% of the TFR respectively, while in 2004 these figures were 25%, 36%, and 23%.
Figure 3: Age-specific fertility rates (per 1000 of women), Poland, 1950–2005 0 50 100 150 200 250
15-19 20-24 25-29 30-34 35-39 40-44 45-49
Age groups A g e -s p e c if ic f e rt ili ty r a te s ( p e r th o u s a n d ) 1950 1960 1970 1980 1990 2000 2005
Both fertility levels and patterns differed between urban and rural populations (see Figures 4 and 5). Fertility behaviour of urban women underwent more radical changes than the behaviour of rural women in the 1950–1970 period, especially in the 1950s. From 1963 fertility in urban regions remained below replacement level. It was only due to the high number of children in the rural population, which constituted the steadily declining share of Poland’s population until the 1990s, that overall fertility remained above replacement until 1988. The different pace of fertility changes in both regions resulted in increasing differences between the TFR values until 1970 and visibly different fertility patterns by age. The TFR in urban areas declined from 3.23 in 1950 to 1.7 in 1970, while that of rural regions fell from 4.03 to 2.88. Subsequently, the difference narrowed slightly to around 0.7 in 1989.
Under the recent transformation, the timing and intensity of fertility changes differed between the urban and rural populations; however, together they resulted in
Figure 4: Age-specific fertility rates (per 1000 women), Poland – urban areas, 1950–2005 0 50 100 150 200 250
15-19 20-24 25-29 30-34 35-39 40-44 45-49
Age groups A g e -s p e c if ic f e rt ili ty r a te s ,u rb a n a re a s (p e r th o u s a n d ) 1950 1960 1970 1980 1990 2000 2005
declining regional differences in terms of TFR values and fertility patterns by age. In total, the TFR in urban areas declined from 1.82 in 1989 to 1.11 in 2003. The rise started in 2004 (to 1.12 in 2004 and 1.15 in 2005). For rural areas a steady decline from 2.51 to 1.40 in 2004 was observed. From 1997 onward, urban women aged 25–29 have had the highest fertility; since 2000 the fertility of those aged 30–34 has been rising. In rural regions the maximum fertility shifted to the age group 25–29 in 2001. One can conclude that age-specific fertility changes of rural women followed patterns observed earlier in urban regions. Still, further transformations in age patterns can be expected.
The observed change of fertility reflects quantum as well as tempo effects. Analyses based on the Bongaarts-Feeney formula (Bongaarts, Feeney 1998) indicated that postponing the decision to have children had a significant role in the drop of the TFR in the 1990s (see Frątczak and Ptak-Chmielewska 1999, Frątczak 2003). By decomposing the birth decline into tempo, quantum, and age structure effects, Sobotka, Lutz, and Philipov (2005) showed that fertility postponement contributed markedly to that trend, but in the second half of the 1990s and the early 2000s (until 2003) the fertility quantum played the main role.
Figure 5: Age-specific fertility rates (per 1000 women), Poland – rural areas, 1950–2005 0 50 100 150 200 250
15-19 20-24 25-29 30-34 35-39 40-44 45-49
Age groups A g e -s p e c if ic f e rt ili ty r a te s , ru ra l a re a s (p e r th o u s a n d ) 1950 1960 1970 1980 1990 2000 2005
The postponement of parenthood is reflected in the rising mean age at motherhood from 26.3 in 1989 to 27.3 years in 2003. The mean age at first birth has increased even more, from 23.3 in 1989 to 25.6 years in 2005. Delays in the transition to parenthood were more evident among urban women – the mean age at first birth given by urban women increased to 26.1 years in 2005 while that of rural women was 24.6 years. The indicators are, however, still relatively low compared to other European countries.
Childbearing intensities, as specified by the age and parity-specific fertility index, based on life-table computations (PATFR, see e.g., Rallu and Toulemon 1994), declined for each birth order. The decline was stronger for higher-order births (Figure 6). While first-birth intensity fell from 0.89 in 1988 to 0.69 in 2003 (i.e. by 23%), second-birth intensity declined from 0.7 to 0.4 (i.e. by 43%), and the intensity for third-birth order decreased from 0.32 to 0.10 (i.e. by 70%). As a result, first third-births constituted 51% of live births in 2005 (55% and 46% in urban and rural regions, respectively), which was 13 percentage points more than in 1989. The share of first and second births increased as well, from 71% to 83% (87% and 78% in urban and rural regions, respectively).
Figure 6: Order-specific index of period fertility (PATFR), 1988–2003
0.0 0.1 0.2 0.3 0.4 0.5 0.6 0.7 0.8 0.9
1988 1990 1992 1994 1996 1998 2000 2002
B
ir
th
i
n
te
n
s
it
y
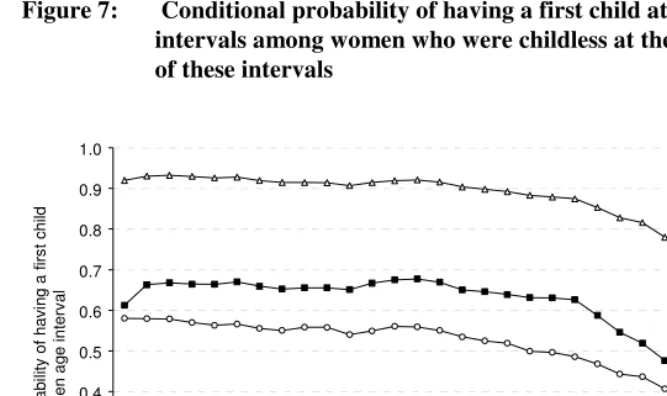
Analyses of conditional first-birth probabilities, computed for women remaining childless at the beginning of a given age interval, show that it was mainly the younger women (aged 25 or below) who contributed to the fall in first birth intensity (Figure 7). In 2003 the probability of having the first child before age 25 was less than half of that in 1989. Until the mid-1990s a fall in first birth intensities was also observed for older women. Since 1995, the conditional first birth probability, computed for women remaining childless at the beginning of a given age interval, stabilized at around 0.4 for women aged 25–30 (0.5 in 1989), 0.2 for women aged 30–35 (0.26 in 1989), and 0.1 for women aged 35 and above (0.15 in 1989). Recently, a slight increase in first birth intensities has been observed for women aged 30–35, which may indicate a tendency toward recuperation of postponed motherhood.
Figure 7: Conditional probability of having a first child at selected age intervals among women who were childless at the beginning of these intervals
0.0 0.1 0.2 0.3 0.4 0.5 0.6 0.7 0.8 0.9 1.0
1971 1976 1981 1986 1991 1996 2001
C o n d it io n a l p ro b a b ili ty o f h a v in g a f ir s t c h ild in g iv e n a g e i n te rv a l
below 25 25-30 30-35 35+ PATFR1
2.1.2 Completed fertility and parity distribution
Although the period fertility measures presented in the previous subsection show a remarkable decline in fertility, the decrease may partly be a period phenomenon caused by fertility postponement. Indeed, the Kohler-Ortega (2002) adjusted total fertility index (adjPATFR) shows that if the shift of childbearing to higher ages had been taken into account, fertility would have been higher by 0.2–0.3 children per woman for the whole period after 1993. This would mean a total fertility of 1.54 in 2002, as indicated by adjPATFR, which is, however, still low and represents a considerable decline when compared to 1990, when the adjPATFR was 2.08.
Figure 8: Period (1950–2004) and cohort (1930–1966) total fertility rates, Poland
0.0 0.5 1.0 1.5 2.0 2.5 3.0 3.5 4.0
1950 1955 1960 1965 1970 1975 1980 1985 1990 1995 2000 2005
T
F
R
,
C
T
F
R
,
a
d
jP
A
T
F
R
TFR
CTFR adjPATFR
1930 1935 1940 1945 1950 1955 1960 1965 Birth cohort
Year
Sources: Council of Europe 2006, AdjPATFR computed by T. Sobotka from the data of Eurostat (2006) and Bolesławski (1993). NOTE: The Adjusted PATFR index was computed according to the formula proposed by Kohler and Ortega (2002) for first and
Focusing only on women who reached the upper limits of their reproductive life, one can see that the cohorts born before 1966 gave birth to more than two children on average. After a gradual decline from the level of 2.78 for the cohort born in 1930, the completed total fertility stabilized at around 2.17–2.20 for women born in 1949–1959. Then, a further decline was observed, and the cohort total fertility dropped below replacement for women born after 1966.
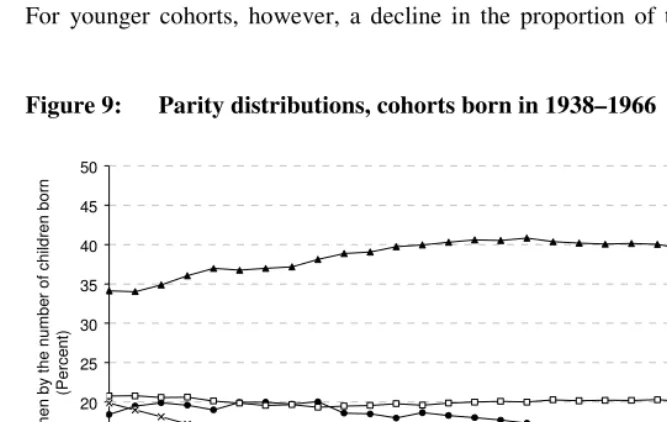
The gradual decrease in the fertility of cohorts born after 1938 was linked to the steady decrease in fertility at fourth and higher birth order. This decline was most pronounced for cohorts born in 1938–1946. It stopped for women born in the 1953– 1959 period, i.e. those who entered their most reproductive ages in the 1970s, and continued again among the youngest cohorts. At the cost of fourth and higher parities, initially a constant increase in the proportion of women with two children was observed. Among women born in the 1950s, around 40% gave birth to two children. For younger cohorts, however, a decline in the proportion of two-child families was
Figure 9: Parity distributions, cohorts born in 1938–1966
0 5 10 15 20 25 30 35 40 45 50
1938 1942 1946 1950 1954 1958 1962 1966
Birth cohort P ro p o rt io n o f w o m e n b y t h e n u m b e r o f c h ild re n b o rn (P e rc e n t)
childless one child two children three children four children or more
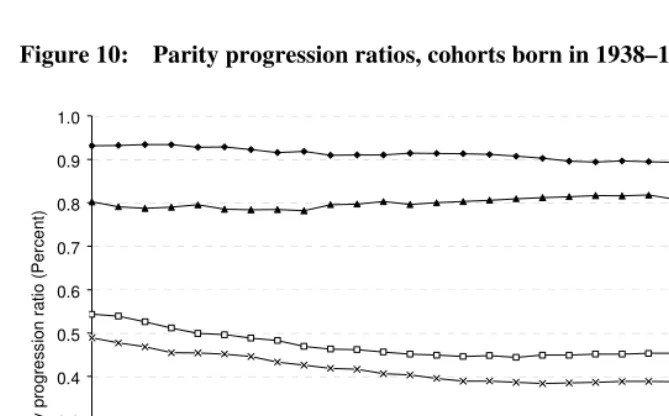
observed. Nevertheless, among women who completed their reproductive careers, the proportion of mothers with two children is still the highest and the progression rate to the second child has remained stable, around 0.8 (see Figures 9 and 10).
The fall in the number of two-child families has been accompanied by a drop in the proportion of women with three or more children. In parallel, a sudden increase in childlessness has been noted. Among women born in 1966, the childless account for 15% (for those born in 1938 it was 6.9%). The steep rise in childlessness was more pronounced than the increase in the proportion of one-child families.
Figure 10: Parity progression ratios, cohorts born in 1938–1966
0.0 0.1 0.2 0.3 0.4 0.5 0.6 0.7 0.8 0.9 1.0
1938 1942 1946 1950 1954 1958 1962 1966
Birth cohort
P
a
ri
ty
p
ro
g
re
s
s
io
n
r
a
ti
o
(
P
e
rc
e
n
t)
PPR 0-1 PPR 1-2
PPR 2-3
PPR 3-4
The comparative analyses of cohort data by birth order by Frejka and Sardon show that the proportion of women born in 1965 who gave birth to their first child in Poland (0.845) was the lowest among the CEE countries. According to the latest available estimates for the 1971 birth cohort, Poland remains at the same position, with the proportion declining to 0.802 (Frejka and Sardon 2006a, Table 1, p.152).6 The proportion of women born in the 1960s who delivered a second child was about average, while the share of those who gave birth to the third child declined more than average (Frejka and Sardon 2006b, Figures 2 and 3, pp. 23–24).
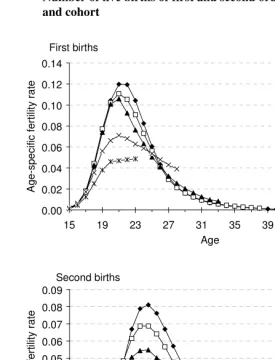
Up to this point we have described the trends for women who already completed their fertility histories. The main changes in childbearing trends, however, have occurred among women born after 1966. At the time of the economic transformation in Poland they were still in the middle of their reproductive years. Figures 11a–c present the childbearing patterns for this group of women as regards first and second order births.
A substantial decline in the progression to first and second birth for each subsequent cohort can easily be seen at younger ages. For example, by age 28 the progression rate to first birth was reduced by 0.1 for women born in 1970 and by 0.2 for those born in 1975, when compared with women born in 1960 (Fig 11c–1). Progression to second birth at this age declined even more markedly, by 0.14 for the 1970 cohort and by 0.29 for the 1975 cohort (Fig. 11c–2). Nevertheless, some signs of fertility postponement are also noticeable. Frejka and Sardon estimated that the cohort mean age at first birth would increase from 23.3 for the 1960s birth cohorts to 23.9 among women born in 1972 (Frejka and Sardon 2006a, Table 2, p.156).
6 The cohort fertility rates computed by Frejka and Sardon (2006a) for the youngest cohort, who have not
Figure 11: Transition to first and second birth by age among women born in 1960–1980
a: Number of live births of first and second order per woman, by age and cohort First births 0.00 0.02 0.04 0.06 0.08 0.10 0.12 0.14
15 19 23 27 31 35 39 43 47 Age A g e -s p e c if ic f e rt ili ty r a te 1960 1965 1970 1975 1980 Second births 0.00 0.01 0.02 0.03 0.04 0.05 0.06 0.07 0.08 0.09
b: Cumulative progression rate to first and second birth
Progression to first birth
0.0 0.1 0.2 0.3 0.4 0.5 0.6 0.7 0.8 0.9 1.0
15 18 21 24 27 30 33 36 39 42 45 48
P ro p o rt io n o f w o m e n h a v in g a b ir th 1960 1965 1970 1975 1980
Progression to second birth
0.0 0.1 0.2 0.3 0.4 0.5 0.6 0.7 0.8 0.9 1.0
15 18 21 24 27 30 33 36 39 42 45 48
c: Cumulative change in first and second birth progression rate by age (benchmark cohort 1960)
Cumulative change in first birth progression rate
-0.36 -0.30 -0.24 -0.18 -0.12 -0.06 0.00 0.06
15 18 21 24 27 30 33 36 39 42 45 48
C u m u la ti v e a b s o lu te c h a n g e 1960 1965 1970 1975 1980
Cumulative change in second birth progression rate
-0.36 -0.30 -0.24 -0.18 -0.12 -0.06 0.00 0.06
15 18 21 24 27 30 33 36 39 42 45 48
C u m u la ti v e a b s o lu te c h a n g e 1960 1965 1970 1975 1980
2.1.3 Fertility intentions
According to the Family and Fertility Survey (FFS) results, the average number of expected children in 1991 was 2.2 among females and 2.0 among males (Holzer and Kowalska 1997). For the youngest cohort (20–29) the average number of ultimately expected children was much lower: 1.7.
Furthermore, the data from the Population Policy Acceptance Survey (PPAS) shows that in 2001 Poland recorded the lowest intended fertility among childless people7. The average number of children expected by childless respondents aged 20–40 was very low (1.05) and comparable with the low values found for Germany (Esveldt and Fokkema 2005). The same indicator for childless Poles aged 20–29 was the lowest among the PPAS countries (1.18).
What distinguished Poland among the PPAS countries was a high level of uncertainty about fertility intentions among childless people – 33% of women and 40% of men were undecided in that respect. Only Finland returned similar figures (Fokkema and Esveldt 2005). Again, the reconciliation survey data of 2005 showed a high level of uncertainty among childless respondents - one third of childless respondents aged 18– 39 were undecided.
The survey ‘Changes in reproductive behaviours in Poland and their consequences for family and household formation and dissolution’ carried out for the urban population in 2006 showed that the average number of children expected for the young cohort (below 30) was around 1.5. At the same time, the proportion of respondents who planned to have two children increased compared to 2001, as did the proportion of those who intended to remain childless – a finding that seems to be a sign of the polarisation of attitudes towards parenthood (Jóźwiak 2006).
Poland reported the highest proportion of childless women of the 1960s and early 1970s birth cohorts among the CEE countries. However, different sources of data indicate a relatively low level of intended childlessness compared to other European countries. For example, the study by Sobotka and Testa (forthcoming) on the PPAS data shows that that 8.5% of childless women aged 18–39 and 13.5% of childless men at that age declared that they intend to stay childless. These figures situated Polish women in the group of rather low intended childlessness, while Polish men belonged to the group with a moderate level of intended childlessness (Sobotka and Testa, forthcoming).8
7 The Population Policy Acceptance Survey was conducted in the years 2000-2003 in 14 European countries:
Austria, Belgium (Flanders), Cyprus, Estonia, Germany, Italy, Hungary, Finland, the Czech Republic, Lithuania, the Netherlands, Poland, Romania, and Slovenia.
8 Other studies also revealed the low childlessness intentions of Poles, which are stronger for men than for
Results of the Eurobarometer survey of 2006 confirm the low level of intended childlessness: Among childless Poles aged 15–39, only 1.6% of women and 3.4% of men declared a preference to remain childless (Testa 2006). Moreover, Poland belongs to the group of countries with the lowest intended childlessness and with high intentions to have at least one child. This can be partly attributed to growing fertility intentions, which is also illustrated by the results of two sample surveys carried out in Poland in 2006 (Jóźwiak 2006, Kotowska and Baranowska 2006).9
The PPAS data enable us to evaluate population attitudes towards childlessness. Some 65% of respondents disapproved of the increasing number of childless couples (i.e. the trend received negative and very negative assessments), situating Poland slightly above the mean level (nearly 63%) for the participating countries. Polish men and women below age 34 and single persons expressed markedly less disapproval of rising childlessness (Kotowska et al. 2003).
The low fertility intentions among childless people and the high uncertainty about the fertility intentions of childless respondents along with postponed fertility decisions may result in increasing childlessness in Poland, and this despite the fact that intended childlessness is low and despite the relatively low approval of rising childlessness.
2.1.4 Out-of wedlock births
The data for the early 1990s shows a new trend – a systematic rise in out-of-wedlock births. The number increased systematically from 32,700 in 1989 to 67,239 in 2005. The percentage of out-of-wedlock births, which remained stable at around 5% during the years 1960–1990, increased from 5.8 to 18.5%, and did so more markedly in urban regions (see Figure 12). From 2000 the rise accelerated: 14.8 and 21.6% of children were born out-of-wedlock in urban regions in 2000 and 2005, respectively. In rural areas the percentage rose from 8.8 to 14.4.10 Despite the fact that the figures are still
9 The proportion of women aged 25–39 intending to have at least one child was 86% (the highest among the
countries under study, the EU average was 66%), of whom 75% planned to have a child in the next three years (the EU average was 43%) and 67% were sure of being successful (37% at the EU level). For males, these indicators were lower: 81% of men aged 25–39 declared the intention to have at least one child (a relatively high level, the EU average being 66%) and among them 41% planned to have a child in the next three years (the EU average was 35%) while 60% were sure of being successful (46% at the EU level).
10 This indicator, which combines both fertility- and nuptiality-related changes, is strongly diversified across
moderate by European standards, the change is a distinctive feature of recent fertility developments in Poland.
Figure 12: Percentage of out-of- wedlock births, 1970–2005
0 5 10 15 20 25
1970 1975 1980 1985 1990 1995 2000 2005
Years
P
e
rc
e
n
ta
g
e
total
urban
rural
Source: Central Statistical Office (CSO) data.
The detailed fertility analysis of married and unmarried women for the years 1989–2000 by Boleslawski (2001) indicate that the observed changes in the number and structure of births (marital and extramarital) were intrinsically related to the greater decline in marital fertility (by 17%) rather than in extramarital fertility (by 5%). Additionally, an in-depth study into age patterns revealed that extramarital births were most frequent among urban women aged 30–34 (246 births per 10,000 unmarried women) and rural women aged 25–34 (253 births per 10,000 unmarried women) (Stolarek 2005, Szukalski 2001).
births given by women aged 15–19 (see Section 4), the proportion of out-of-wedlock births increased from 19.3% in 1989 to 58.2% in 2004.
Taking these developments into account, one can make the assumption that the trend in out-of-wedlock births provides evidence that the shifts in behaviour resulted from gradually changing attitudes towards births delivered out-of-wedlock by never-married women or women in cohabitation, especially among young persons living in urban areas. The data from the Population Policy Acceptance Survey (PPAS) in 2001 shows that the increasing proportion of out-of-wedlock births was disapproved of by 60% of the respondents; however, single persons, people under 30, and residents of big cities showed a higher approval (Kotowska et al. 2003).
Since marriage disruption by divorce and separation remained low,11 it seems that changes in out-of-wedlock births contributed remarkably to a rise in the proportion of one-parent families. The census data showed that over the years 1988–2002 the proportion of lone parents among families increased from 15.4% to 19.4% (from 16.8% to 21.1% in urban areas and from 13.0% to 16.4% in rural areas).
2.2 Union formation and dissolution
2.2.1 Marriage
Between 1960 and 1990, marriage patterns by age of females and males remained almost stable, especially for females. The highly right-skewed curves, with a high prevalence of marriage among persons aged 20–24, reflects the Eastern European model of family formation based on universal marriages contracted at early ages (see Figures 13, 14, and 15). The declining propensity to marry, along with marriage postponement, which is characteristic of family formation behaviour under the SDT, are manifested by remarkable changes in marriage patterns by age and sex. The marriage curves visibly flattened. A significant decrease in contracted marriages was mostly noted in the 20–24 age group for both males and females and the 25–29 age group for males. Additionally, for males the highest rate shifted to age 25–29. Since 1997 a gradual increase in the marriage rate for persons of both sexes aged 25–29 has been observed, with more marked changes being noted for women. This is accompanied by a slight increase in marriages by women aged 30-34 and a more marked increase by men aged 30-34 (see Figures 13, 14).
Figure 13: Number of marriages per thousand men of a given age, Poland, 1960– 2005
0 20 40 60 80 100 120
15-19 20-24 25-29 30-34 35-39 40-44 45-49 50-54 55-59 60+ 1960-61 1970 1990 2000 2004 2005
Source: CSO data.
Figure14: Number of per thousand women of a given age, Poland, 1960–2005
0 20 40 60 80 100 120
15-19 20-24 25-29 30-34 35-39 40-44 45-49 50-54 55-59 60+ 1960-61 1970 1990 2000 2004 2005
A marked reluctance to marry, particularly among women, can be additionally illustrated by changes in first marriage patterns. The total first marriage rate of women aged up to 50 decreased from 0.91 in 1989 to 0.56 in 2004 (see Figure 15). From 1993 the total first marriage rate was higher for men than for women. The mean age at first marriage increased in the years 1989–2004 from 22.8 to 24.7 for females and from 25.1 to 26.9 years for males (CSO data).
Figure 15: Total first marriage rate and mean age at first marriage of females aged up to 50, Poland, 1970–2004
total first marriage rate
mean age at first marriage 0.0 0.2 0.4 0.6 0.8 1.0 1.2
1970 1974 1978 1982 1986 1990 1994 1998 2002
T o ta l fe m a le f ir s t m a rr ia g e r a te ( u p t o a g e 5 0 ) 21.00 21.75 22.50 23.25 24.00 24.75 25.50 M e a n a g e a t fi rs t m a rr ia g e ( w o m e n )
2.2.2 Cohabitation
In comparison to other countries in Europe, cohabitation in Poland is relatively uncommon. According to the population census of 2002, only 2.2% of persons living in unions participated in this form of partnership. Despite its marginal incidence, the number of consensual unions has been growing continuously since 1978, when 90,000 consensual unions were recorded (1% of all partnerships), rising to 197,400 in 2002 (Fihel 2005). The detailed analysis of the census data by Fihel shows an ambiguous and differentiated picture of cohabitation in Poland. Some features are of particular interest. For instance, cohabitation is practised by various social groups. Moreover, it is related to certain stages of the family life cycle: first, those who cohabit most frequently are the young (aged 20–29) living in cities who have never been married. Fihel estimated that nearly every third consensual union in Poland is a pre-marital cohabitation i.e. both partners were never married. Second, it is relatively widespread among divorced persons. In this group post-marital cohabitation seems to have become more popular than re-marriage.
Other findings by Fihel (2005) suggest that cohabitation is considered a temporary, unstable living arrangement rather than an alternative to marriage. Among households with children, the proportion of households inhabited by consensual couples is only 1.6 %. At the same time, women who become pregnant out-of-wedlock more frequently decide to get married before the child is born rather than to stay unmarried. Although this pattern changed somewhat in the 1990s, as the rise in extra-marital births illustrated, entering a marriage continues to provide the feeling of a secure and stable partnership, preferred for parenthood.12 Moreover, cohabitation may be preferred by people without own employment-based sources of income. Cohabitants very frequently live on welfare and unemployment benefits. They are typically supported by others, perhaps most often their parents. Such sources of income do not guarantee economic stability, considered as a precondition to start a family.
Despite the marginal incidence of cohabitation, one can expect that it will become more popular among Poles. Kotowska et al. (2003) found that among different family-related developments, such as the increasing proportion of childless couples, the
12
decreasing number of marriages and births, the rising number of one-parent families, the rising proportion of out-of-wedlock births, and an increase in the proportion of consensual unions received most approval. Generally, these developments were perceived as negative by more than half of the respondents, with the exception of cohabitation, which was negatively evaluated by 42% of the respondents.
2.2.3 Union dissolution
Poland belongs to a group of countries with low levels of divorce. The total divorce rate, defined as the sum of divorce rates by duration of marriage for a given year, oscillated between 0.13 and 0.18 during the years 1970–1988. The temporary decline observed in the years 1989–1993 was followed by an upward trend (see Figure 16). The change accelerated in very recent years. The number of divorces, which had oscillated between 42,000 and 45,000 in the years 1997–2002, increased to 67,600 in 2005 (the total divorce rate rising from 0.16 in 1997 to 0.23 in 2005). Moreover, the option of separation (introduced by law in 1999) resulted in the number of marriages dissolved rising, from 1,300 in 2000 to 11,600 in 2005.
Divorces were more frequent among persons living in urban areas. Crude divorce rates, defined as the number of divorces per 1000 of population aged 20 or more years, oscillated between 1.5 and 2.8 in urban regions and fell below 1.0 in rural areas. Until the mid-1990s there was either a decline (in urban regions) or stabilisation (in rural regions) of divorce rates (see Figure 17). Changes observed since 1995 illustrate that marriage dissolution by divorce or separation has become more frequent in both regions, while it is still not very widespread.
Delays in marriage and parenthood as well as de-institutionalisation processes were used by Hantrais (2005) to demonstrate country differences in family formation in the EU25.13 Despite the quite significant postponement effects documented here, Poland along with Hungary, the Czech Republic, Lithuania, Latvia, Estonia, and Slovakia still remain at the early stage of transition from conventional family formation (early marriages) to delayed family formation. In terms of de-institutionalisation, Poland may be clustered with Italy, Greece, Spain, Ireland, and Cyprus as countries where that process is less advanced compared to other European countries (Hantrais, 2005: 128–130).
Figure 16: Total divorce rate, Poland, 1970–2004
0.00 0.05 0.10 0.15 0.20 0.25
1970 1974 1978 1982 1986 1990 1994 1998 2002
T
o
ta
l
d
iv
o
rc
e
r
a
te
Source: Council of Europe data.
13 The following demographic indicators have been used in cross-country comparisons: mean age of females
Figure 17: Divorces per 1000 of population aged 20 years and more, 1960–2005
0.0 0.5 1.0 1.5 2.0 2.5 3.0
1960 1965 1970 1975 1980 1985 1990 1995 2000 2005
urban
rural
Source: CSO data.
3. Determinants of childbearing trends in Poland
3.1 The socio-economic context
The economic reforms that started in 1989 led to remarkable changes in GDP and employment. A steadily declining share of output by agriculture (3% in 2004), manufacturing, and construction (29%) and a rising share of output by the service sector (66%) have been accompanied by considerable shifts in employment composition. In 2004, services made up nearly 55% of employment; this compares to 28% in manufacturing and construction and 17% in agriculture. The growing private sector generated around 63% of GDP and accounted for 71% of employment.
about 2.2 million. With regard to changes in GDP, employment, and unemployment, four phases of economic transformation can be distinguished:
• In the ‘black’ years of 1990–1993, GDP and employment declined drastically
while massive unemployment set in.
• In the period 1994–1998, GDP and employment rose and unemployment declined.
• In the period 1999–2002, GDP growth slowed, employment declined, and
unemployment increased to levels exceeding the levels of the early 1990s (unemployment reached 20% in 2003).
• From 2003, GDP growth accelerated and employment increased (in 2004), this in
contrast to unemployment, which declined visibly.
The transition to a market economy in Poland imposed economic modernisation and the reform of the institutional setting. Among many components of the transformation processes, two results of institutional changes can be seen as the main driving forces behind family-related behaviour (e.g., Kotowska 2004b):
• The reassignment of economic functions between the state, enterprise, and the family. This was fundamentally based on the removal of the state from its role as employer and provider of services and of social benefits; the erosion of the social function of companies led to an increase in the responsibility of households for their economic situation at a time when it was increasingly difficult to obtain income.
• Changes in the conditions of labour-market participation, caused by economic
reforms and (since the mid-1990s) globalisation along with an influx of the baby-boomers’ descendants in the 1990s resulted in persisting high unemployment pressure.
The first group of processes relates to economic reforms as well as ‘welfare state’ reforms, the second relates to changes in the labour market. Their family-relevant main effects are:
• changes in household welfare,
• an increasing vulnerability of the family, and
• increasing difficulties to reconcile work and family.
reassignment of economic functions of the state was not accompanied by the construction of effective markets and of the system of income transfers, including protection from poverty. Therefore, high economic and social inequalities seem to be considered rather as a non-transient effect of the reforms in the CEE countries. Social reaction to increasing economic stratification may be manifested not only through demanding attitudes14 or feelings of relative deprivation, but also through an emphasis on economic factors while making significant life decisions, including marriage and children.15 This can be strengthened by increasing consumption aspirations.
The growing vulnerability of the family is another highly important aspect of the changes in Poland. It is true that the position of the family has been weakened in countries with developed market economies, but there have been different reasons for Poland. In developed economies, family development was associated with the development of the welfare state through its social security system, education, and health services. In Poland, by contrast, the withdrawal of the state from numerous social entitlements for families (less access to institutional childcare, as reflected by the number of places and the costs of childcare, and declining direct and indirect financial support to families) made the family more dependent on its own resources. These resources were strongly influenced by labour-market changes, i.e. increasing competition and unemployment.
These new and (before 1989) unknown characteristics of the labour market constitute a threat to the economic well-being of a significant proportion of households. Additionally, the possibility of using existing social entitlements is related to employment, therefore a job loss also means a loss of many entitlements. Further, women very often forgo their rights to existing entitlements because they are afraid of losing their employment position. Consequently, the difficult situation in the labour market has an impact on access to family benefits, especially with regard to women. Families and households faced situations in which their obligations and responsibilities related to their economic situation have increased, while at the same time fulfilling these obligations and responsibilities has become much more difficult, mostly due to the developments in the labour market (e.g., Kotowska 1999, 2004b; Kocot-Górecka 2004; Muszyńska 2004; Matysiak 2005b).
14 According to PPAS data, for instance, 62.6% of respondents expected the state to take care of young
persons looking for a job; 61.4% of respondents claimed that it is the state’s responsibility to provide adequate housing for everyone (Kotowska et al. 2003).
15 Opinions that the state has the responsibility to support families in strict (e.g., financial benefits) and broad
Transformation processes generally created new career opportunities and related changes to the socio-economic position of individuals and households. Household welfare became more dependent on household resources, such as personal income, skills, and the ability to act in new circumstances. Simultaneously, growing labour-market competition resulted in growing job requirements. For these reasons, more effort had to be made by individuals to get and to maintain a job. Acquiring appropriate skills plays a particularly important role here. Additionally, the labour market in Poland remains under persistent demographic pressure, generated by the baby boom of the late 1970s and the early 1980s.16 The growing labour force combined with insufficient demand for labour resulted in large groups of people at risk of unemployment. Irrespective of the phases of economic development during the 1990–2005 period, young persons experienced a constant and very high threat of unemployment. Therefore, to find a job and to stay in the highly competitive labour market became of crucial importance for the younger generations. Moreover, unfortunate changes in the institutional setting made it more difficult for women to be flexible and mobile and to adapt to increasing employers’ requirements. Many studies have revealed the discrimination of women in the labour-market (e.g., Heinen 1995; Siemieńska 1997; Kotowska 1995, 2001; Kowalska, 1999; Ingham et.al. 2001; Sztanderska 2005). Under the new conditions of labour-market participation and the existing institutional setting, it has become more difficult to reconcile work and family, a problem perceived mostly as a women’s issue.
3.2 The labour market and the family
3.2.1 General trends
The labour-market situation in Poland in the first half of the 2000s was the worst in the EU25. The employment rate of both women and men was exceptionally low (46.2% and 57.2% respectively in 2004) compared to the EU25 average (70.9% for men and 55.7% for women). In 2004 the unemployment rate was highest in the EU25 - 18% for men and 19.7% for women, while the EU25 average was 8.2% and 10.1%, respectively
16 In the period 2000–2005 the labour market remained under pressure from the increasing number of young
(according to Eurostat data of 2004). The most distinctive feature of the labour market, as mentioned previously, was a very high incidence of unemployment among young persons: The unemployment rate for the 15–24 age group was 38% for men and 41.4% for females (the EU25 averages were 18.1% and 19.3%, respectively). Several studies confirm that the difficulties the younger generations are facing in the labour market affect their declining propensity to start a family and to have a child. A negative influence of unemployment on family formation and fertility was revealed in studies based on LFS data (Kocot-Górecka 2004) and other surveys (Frątczak 2003; Kotowska et al. 2003; Majszczyk 2005; Kotowska and Baranowska 2006).
3.2.2 Female labour-force participation
Under the socialist regime, women’s participation in the labour market was high. The wide access to paid work for women resulted mostly from the labour-intensive economy, low productivity, and low wage policies. Low wages led to the necessity of having two incomes to maintain a family. Additionally, women’s economic activity was ideologically supported by equating emancipation with employment. The high labour-market participation of women co-existed with the traditional model of the family. Despite the social acceptance of the dual-earner family model, the female role was still perceived mainly as that of a wife and mother, while the husband’s main responsibility was to provide income for the family. However, the conditions of labour participation (a right-to-a-job economy, i.e. an economy with a job guarantee and no open unemployment) as well as the provision of childcare facilities made it possible for women to reconcile family duties and paid work. At the same time women continued to be mainly responsible for home and care duties (e.g., Kotowska 1995; Titkow 2001).
This economic and ideological reasoning underpinning women's participation in paid work has rapidly been replaced by purely economic arguments. Moreover, it is a well-known fact that women’s employment is more sensitive to declines in labour demand related to output contraction (e.g., Kotowska, 1995; Siemieńska 1997; Sztanderska 2005). Thus, in our opinion, structural factors played the main role in the deterioration of women’s position in the labour market.
children) as a proxy measurement for female production-related attributes. New female labour-market entrants are exposed to a higher risk of falling into unemployment. Women re-entering the labour market after parental leave are confronted with serious obstacles to getting a job. Many studies have confirmed the discriminatory effects of sex as well as marital status and the presence of young children on female labour-market participation (e.g., Steiner and Kwiatkowski 1995; Puhani 1995; Kowalska 1996; Kotowska and Witkowski 1996; Kotowska 2001). Therefore, it can be stated that the labour market under transition was more open to men than it was to women (Domański 2001).
Women gradually adjusted to the new conditions of labour-force participation. Their main strategies were high participation in education and life-long learning, increasing participation in labour migration (to start education or to find a job), and acceptance of lower pay (Sztanderska 2005). Postponement of marriage and childbirth as well as a low propensity to marry and to have children may also be interpreted as symptoms of adjustment strategies (e.g., Kotowska and Witkowski 1996; Kotowska 2001). One may hypothesise that female employment would have declined more if women had not reduced their fertility. Indeed, the analysis of falling female employment in the years 1993-2002 decomposed by the number of children supports this suggestion. The average employment rate of women aged 25- 34 would have fallen by 5.34 percentage points instead of 1.37 if not for the reduction in fertility (Matysiak, 2006). Since the end of the 1990s some symptoms of relative improvements in women’s position in the labour market have been observed (Figure 18).
Labour-market participation of females is strongly influenced by the presence of children, especially small children (aged 0–5 years). Moreover, the higher the number of children, the less likely the woman is to have a job. The negative impact children have on mothers’ employment in Poland is shown by several studies (e.g., Kotowska and Abramowska 2003, Kocot-Górecka 2004, Kotowska et al. 2005b, Matysiak 2005a, 2005b; Matysiak, 2008, Kotowska 2006). When the children are very small (0–3 years), women withdraw from the labour market. When the children are older, they try to re-enter. However, a remarkable proportion of them cannot find a job, and the percentage of unemployed women with children aged 3 or above increases considerably (Table 1). According to the survey ‘Reconciling work, family, and education’, some 54% of non-working mothers of children aged 4–6 years cite the main reason for staying at home as difficulty in finding a job.
Figure 18: Female employment and unemployment rates by age
Employment rates
0 10 20 30 40 50 60 70 80
15-17 18-19 20-24 25-29 30-34 35-39 40-44 45-49 50-54 55-59
Age groups
In
p
e
rc
e
n
t
1992 1997 2000 2002 2004 2005
Unemployment rates
0 10 20 30 40 50 60
15-17 18-19 20-24 25-29 30-34 35-39 40-44 45-49 50-54 55-59
Age groups
In
p
e
rc
e
n
t
Table 1: The labour-market status of women aged 20–39 by presence and age of children
Percentage of women
Age Employed Unemployed Inactive
Without children younger than 15
20–24 27.5 19.6 52.9
25–29 69.2 17.7 13.1
30–34 80.6 10.2 9.1
35–39 75.2 12.2 12.6
With at least one child up to 3 years
20–24 23.7 15.9 60.4
25–29 38.0 11.1 50.9
30–34 53.0 5.4 41.5
35–39 50.9 7.8 41.3
With at least one child aged 3–14
20–24 43.4 30.1 26.5
25–29 50.4 27.6 22.0
30–34 67.5 16.1 16.4
35–39 70.0 14.8 15.3
Source: Authors’ calculations on LFS, second quarter 2005.
externally driven by demand for female labour, by a low wage policy and low productivity. However, women were mostly perceived as the secondary labour force. As a result, the high economic activity of females before 1989, compared with the labour-force participation of females in the Nordic countries, co-existed with the patriarchal models and traditional views on gender roles prevailing in the post-communist countries. It is well known that under declining labour demand there is a strong preference for men to secure jobs at the cost of jobs for women in countries that adhere to the traditional perception of gender roles, (e.g., UNICEF 1999, Siemieńska 1997, Kotowska 1997, 2001, Fultz et al. 2003). This finding may partly explain the deep decline in female employment in the course of economic transformation.
strong traditional perception of women’s role is the relatively high preference given to the ‘sequential male breadwinner’ model (a woman should not work when children are small); some 18% of respondents opted for this work–family arrangement. Consequently, the male breadwinner model was the second most practised family model, especially by families with small children.
3.2.3. Educational attainment
Another important element of changes under the economic transformation is an increase in the significance of investment in human capital. This is a consequence of the stronger link between education and life opportunities as well as the position in the labour market. Economic returns to education have strongly increased (e.g. Kotowska and Abramowska 2003; Sztanderska 2005; Kotowska 2006). At the same time, the changes to income distribution that occurred during the transformation led to a shift in investments in human capital (through education, health, culture and recreation) from investment by the state to investment by the household. Previously, the state covered most of the related costs. Now, it is the household’s responsibility, despite the limitation placed on the household to carry these costs. The limitation stems not only from a decrease in income in a large proportion of households but also from the marketisation of social services that contribute to a rise in the costs of human capital investments at the household level.
Moreover, under the economic transformation and globalisation processes there is a need of simultaneous investments in human capital in both children and adults. The latter need is determined by the necessary adaptation of current as well as future skills to the changes in the structure of labour demand resulting from the reform of the economy and technological changes.17 The shift of investments in the human capital of children to the household results in an increase in the direct costs of raising children. The need to cover other costs associated with the education of adults (parents) leads to a rise in the indirect costs of raising children and to a situation where the ability to access high quality education services is increasingly connected to the financial situation of the household and its access to centres of education.
17 The improvement of the employment ability of the labour force was one of the fundamental conditions of
The rising educational aspirations of Poles may be illustrated by the rapid increase of participation in university education. The number of university students in 2004 reached almost 2 million and was four times higher than in 1989. Among persons aged 19–24, nearly 55% were in education in 2004. Labour-market indicators confirm the crucial role education plays in employment prospects. During the years 2000–2005, the labour-force participation rate and the employment rate of persons with university education (around 80% and 76%, respectively) were the only rates that did not fall. Moreover, differences in unemployment rates between persons with the lowest and highest education categories increased markedly – in 2005 the unemployment rate was 25.9% for persons with primary education and lower versus 7.3% for persons with tertiary education, while in 1996 the same rates had been 12.0 and 2.9, respectively (LFS data from the fourth quarter).
There are two important aspects of this improvement in educational attainment in Poland. Prolonged education contributes remarkably to postponement of marriage and parenthood. Due to differences in educational activities, women and younger generations benefit more from advancement in education (Figure 19).
3.3 Family policy
Family policy measures are usually divided into two groups: (a) direct and indirect monetary transfers and (b) work and family reconciliation measures (see Hofaecker, 2003). Direct transfers include family and childcare benefits and subsidies while indirect transfers concern tax reductions. Leave schemes and public childcare belong to measures oriented towards combining work and family. Eligibility conditions, coverage and timing of the measures (especially leave schemes) define to what extent the measures support families in their parenthood responsibilities and mothers’ involvement in the labour market. The following short description of family policy regulations in Poland in the 1990s will focus on both groups of policy measures and the three factors mentioned above, defining their efficiency in supporting families.
• Some benefits linked previously to employment (the insurance-based benefits)
were converted into non-insurance benefits and transferred to the state budget or the local government.
• A new type of social assistance was introduced to address rising poverty. • Financial support for multi-children families was expanded.
• The majority of family benefits (apart from maternity and childcare benefits) was converted from universal into income-tested benefits.
• Wage indexing was replaced by price indexing. • More restrictive eligibility conditions were introduced.
• The majority of benefits decreased in real terms.
Generally, the system was transformed from the universal model to one supportive of low-income families with children.
Figure 19: Percentage of persons with university education among those aged 25–34, LFS, second quarter
Persons aged 25-34
8.7
10.6
15.6
18.8
25.6
30.9
7.1 8
9.7
11.7
16.4
20.1
0 5 10 15 20 25 30 35
1992 1997 2000 2002 2004 2005
Years
P
e
rc
e
n
ta
g
e
females
males
3.3.1 Family benefits
New arrangements for financial support to the family were defined by the reform of November 2003, in force since May 2004. They result in reduced financial assistance for the family in general but have some particular effects for low-income families, especially those with three or more children. Additionally, the responsibility for the payment of family benefits was moved to social assistance institutions. Since 2003 there have been already several amendments to the new law. They resulted in a cut of assistance for lone parents. The most recent amendment was implemented on 18 July 2006. It changed the income threshold for farmers’ households and increased allowance levels, as of 1 September 2006.
The income criterion for basic family allowance is lower than before the 2003 reform, i.e., the monthly household income per person should not exceed 504 PLN for families without disabled children (around 138 Euro, at an exchange rate of 3.65 PLN for 1 Euro) and 583 PLN (160 Euro) for families with disabled children up to 25 years of age.18 The basic allowance was dependent on the number of children: the monthly amount equals 43 PLN (12 Euro) for the first and second child, 53 PLN (15 Euro) for the third child and 66 PLN (18 Euro) for the fourth and each subsequent child. Since September 2006 the basic allowance is dependent on the age of the child; the level increases to a monthly amount of 48 PLN (13 Euro) for a child up to 5 years, 64 PLN (18 Euro) for a child aged 6–18 and 68 (19 Euro) for a child aged 19–24; families with three or more children receive 80 PLN (22 Euro) additionally for third and subsequent children (if the income criterion holds).
The basic family allowance may be increased by financial supplements, granted under special circumstances related to care and child-rearing (e.g., lone mothers, lone mothers who lost their entitlement to unemployment benefit [cancelled in 2006], persons on parental leave, parents of disabled children, birth grants, and nursing allowances).19 There are also educational supplements for children attending school outside the place of residence and lump sums paid once a year at the beginning of the school year for children from low-income families. Since the supplements are all
18
This criterion refers to households that derive their main income from non-agriculture sources. The calculation of farmers’ incomes is based on the basic rate per 1 ha, which declined. From September 2006 onwards more farmers’ families have been entitled to a basic family allowance and its financial additions.
19 On 1 January 2006 the level of the income-tested birth grant (for those families which are entitled to the
income-tested (the eligibility criteria are the same as for family allowance), they are mostly paid to low-income families.
In April 2005 a new supplement to the basic family allowance was introduced to support families with three or more children and to counteract the poverty risk, which increases with the number of children. Families entitled to the family allowance received an additional 50 PLN (around 14 Euro) for the third and each subsequent child.
As a result of the reform, the number of family benefit recipients in 2004 was lower by 7.4% than a year ago (it amounted to 5.510 million in 2004). A further decline was observed in 2005 (to 5.192 million).20 The average family allowance amounted to 46 PLN (around 13 Euro) and the average supplement to 57.7 PLN (around 16 Euro).
This new system of financial assistance supports low-income families with children more strongly than the previous one. Other families do not receive any significant state assistance.
3.3.2 Childcare
Moreover, the state delegated responsibility for running childcare institutions to the local authorities. Due to financial shortages, they moved some costs of running the public childcare institutions (about 30–40%) to parents in the form of increased fee for meals, charges for services beyond the minimum educational program, and contributions to parents’ committee funds (Balcerzak-Paradowska et al. 2003). Any additional educational and recreations services (foreign languages, music lessons, swimming pool, sport activities, etc.) now have to be paid as an extra. Also, in primary schools any care services provided for small children are no longer free of charge. In sum, institutional care for children aged 0–6 and for those of primary school age was radically reduced, the costs of services have increased, while accessibility to the services declined. Over the years 1989–2003, the number of places in crèches declined by 76% and by 25% in nursery schools (CSO data). The indicators for children under institutional care belong to the lowest group compared to other EU countries (Matysiak 2005b). In 2004 only 2% of children aged 0–2 attended crèches, while 38% of children aged 3–5 attended kindergartens. Finally, no childcare subsidies are offered to families.21
3.3.3 Maternity leave
Maternity leave is granted to a female employee in the case of childbirth and to those who adopt children or provide foster care. The wage loss is fully compensated. Before 1999 the length of maternity leave was 16 weeks upon first birth (since 2001, it can be divided into 14 weeks for the mother and two for the father), 18 weeks upon each successive birth (14 weeks for the mother and four for the father), and 26 weeks in the case of multiple birth. Since 1999 there have been some temporary changes in the duration of the leave. In 1999 it was extended to 20 weeks upon the first and each successive birth and 30 in the case of multiple births, and in 2001 to 26 and 39 weeks, respectively. In 2002 the leave was cut back to pre-1999 levels. Recently, the government has prepared a proposal to extend it again.
3.3.4 Parental leave
Another reconciliation measure is parental leave. It may be taken for 36 months in four periods at most for a child up to the age of four by employeeswith a work record of at least 6 months. This may be extended for another 36 months if the employee is raising a child who is disabled, chronically ill, or mentally retarded and requires care. The leave is granted until the child reaches the age of 18 at the latest.
The total standard leave of 36 months is assigned to parents (or persons who take care of a child), and either the mother or father may take the leave. The time for both parents to be jointly on leave cannot exceed three months. Fathers have been entitled to parental leave since 1996.22 There are gender equality guarantees on stability of employment relations, on the return to work to an equivalent position and on the inclusion of the leave period as part of the total work record (for pension rights). Additionally, there is an opportunity to combine work, training, education, and parental leave if these activities allow for the child/children to be taken care of – the main purpose of the leave.
Since 2004, persons who start a job while on parental leave lose their parental benefit, irrespective of the income criterion. The parental benefit is means-tested – the monthly household income per capita cannot exceed 504 PLN (583 PLN in the case of a disabled child). Previously, it was possible to work and receive the parental benefit at
former declined to 2%, contrary to the childcare indicator for children aged 3–6, where the percentage increased from 32.8 to 40.4 in 2003 due to a declining number of births.
22 The right to family benefits and leave schemes was extended to include fathers but it was not individualised