in the population sciences published by the Max Planck Institute for Demographic Research Konrad-Zuse Str. 1, D-18057 Rostock·GERMANY www.demographic-research.org
DEMOGRAPHIC RESEARCH
VOLUME 19, ARTICLE 46, PAGES 1635-1662
PUBLISHED 16 SEPTEMBER 2008
http://www.demographic-research.org/Volumes/Vol19/46/ DOI: 10.4054/DemRes.2008.19.46
Research Article
Sources of error and bias in methods of fertility
estimation contingent on the P/F ratio in a time
of declining fertility and rising mortality
Tom A. Moultrie
Rob Dorrington
c
°2008 Moultrie & Dorrington.
1 Introduction 1636 2 Brief description of the P/F ratio method 1637
3 Analytical approaches 1640
3.1 Mathematical reasoning 1640
3.2 General reasoning 1641
3.2.1 Underreporting of current fertility 1642 3.2.2 Differential fertility between survivors and non-survivors 1643
3.3 Simulation 1644
3.3.1 Variations in fertility 1644
3.3.2 Variations in mortality 1645
4 Results 1646
4.1 Scenario 1 (stationary population) 1647 4.2 Scenario 2 (constant mortality; fertility changes) 1648 4.3 Scenario 3 (mortality and fertility changes) 1649 4.4 Scenario 4 (mortality and fertility changes; HIV affects fertility) 1653 4.5 Scenario 5 (mortality changes; HIV affects fertility; no other
fertility changes) 1654
5 Conclusions 1654
Sources of error and bias in methods of fertility estimation contingent
on the P/F ratio in a time of declining fertility and rising mortality
Tom A. Moultrie1
Rob Dorrington2
Abstract
The most commonly used indirect fertility estimation methods rely on the use of the P/F ratio, first proposed by Brass. In essence, the ratio compares cumulated cohort fertility with cumulated period fertility on the basis of three, fairly strong, assumptions. First, that the level of fertility has remained constant over time. Second, that the age distribution of fertility has been constant; and third, that the fertility of women who do not survive to re-port their numbers of children borne does not differ from those who do survive. This paper interrogates what happens to the results produced by the P/F ratio method as each of these three assumptions is violated, first independently, and then concurrently. These investi-gations are important given the generally poor quality of census data collected in many developing countries, particularly those in sub-Saharan Africa, and the particular demo-graphic dynamics resulting from the generalised HIV/AIDS epidemic in the region. The investigations suggest that using the P/F ratio for the age group 20-24 to scale the reported fertility schedule is more accurate than the Feeney method and marginally preferable to scaling using the average ratio for the age groups between 20 and 29, although it would overstate fertility while fertility is rising and for some time after period fertility peaks, reaching a maximum of around 10 per cent at the peak of period fertility. In addition dif-ferential fertility between HIV-infected and HIV-uninfected women has a trivial impact on the methods, even in an environment with a simulated highly generalised epidemic.
1Centre for Actuarial Research, University of Cape Town, Private Bag X3, 7701 Rondebosch, South Africa.
Tel.: + 27 21 650 5479. Fax: +27 21 689 7580. E-mail: [email protected]
1. Introduction
Improvements in vital registration systems and census methodologies, together with the expansion of coverage of the Demographic and Health Surveys have all but obviated the need for indirect techniques of fertility and mortality estimation in most regions of the world. However, these techniques are still necessary throughout Africa, and since the majority were developed in the 1960s and 1970s on the assumptions that fertility and mortality were constant (which was, roughly, the case in countries to which these tech-niques were applied at the time the methods were developed), there is a need to question how well they perform in the demographic environment that prevails now in the region.
While some of the indirect techniques were subjected to further refinement in the 1980s (for example, with the development of the Relational Gompertz fertility model; and the variable-rmortality estimation methods), the improvements in data (number of sources, methodologies, and surveys), combined with the shift in research priorities af-ter the 1994 Cairo Conference on Population and Development, have meant that little attention has been paid to the continued validity of the methods under radically alter-ing demographic conditions. In this paper, we address one aspect of this lacuna in our knowledge, at least with regard to the methods of estimating fertility from census-type data.
The relevance of this study may seem obscure to demographers accustomed to work-ing only with developed country data (where vital registration systems and population registers have rendered most forms of demographic survey, not to mention the census, obsolete), or even to demographers whose work with data from developing countries is confined to that available from Demographic and Health Surveys (DHSs). Although the data from DHSs are of high quality (there are exceptions, the 2003 South Africa DHS, for example), their usefulness can be constrained by their comparatively small sample size which makes multivariate analysis of fertility by even a few variables (for example, by age, region and education level simultaneously) unreliable. For such analyses, not to mention the provision of reliable estimates at a sub-national level, and in the absence of a substantially complete vital registration system, the census is an important source of data for demographic estimation and policy formulation. However, the problems with census data in developing countries described more than a decade ago by Brass (1996) and Cleland (1996) still apply almost without variation to contemporary African censuses, meaning that direct estimation of fertility from African census data is almost unheard of.3 Hence, while the indirect techniques of demographic estimation have fallen into
dis-3See Moultrie and Timæus (2002, 2003), and Moultrie and Dorrington (2004) for discussions of how - in two
use in almost all other parts of the globe, they are still essential in Africa. In Africa, the most commonly used method of estimating fertility indirectly relies on the use of the ra-tio of lifetime fertility cumulated to a given age (P), to period fertility cumulated to that same age (F), first proposed by Brass (1964, 1968) and described in detail, with worked examples, in Manual X (United Nations 1983). The primacy given to the method in that Manual accounts, no doubt, in large measure for its popularity and durability. More-over, the method’s (relative) simplicity makes it the obvious choice where demographic knowledge and skills are either out of date or lacking, as is generally the case in Africa.
Among the alternatives, the Relational Gompertz model, a conceptual improvement on the P/F ratio method first proposed by Brass (1978) and subsequently refined by Booth (1980, 1984) and Zaba (1981), is both more difficult to apply as it requires subjective judgment which is best informed by some prior knowledge of the recent demographic past in the area under study, and has not been widely popularised in its most versatile form (that set out by Zaba 1981).
Similarly, the methods proposed by Arriaga (1983) - operationalised in the PASEX software produced by the US Census Bureau (1997) - have not been widely applied in sub-Saharan Africa. In part, this is because the technique ideally requires two, not too distant, censuses, which are not always available in African countries. However, in addition, where the quality of the fertility data in the two censuses differs significantly, spurious time trends in fertility may be produced. And, although Arriaga describes a variant to the method if data are available from only one census, he concedes that “in this case the technique would have practically the same assumptions as the P/F ratio technique derived by Brass” (Arriaga 1983:3).
For all these reasons, the Brass P/F ratio technique remains the method most com-monly applied to estimate fertility from limited and defective census data in Africa, and it is therefore important to interrogate potential sources of error and bias in the method when the assumptions underpinning its formulation are violated as they undoubtedly are in modern-day Africa, particularly in those countries experiencing a generalised HIV/AIDS epidemic. At its core, then, the paper investigates how well the P/F ratio method esti-mates fertility when the underlying assumptions are violated. An ancillary question asks which of several recommended variants of the P/F ratio tend to work best in different environments.
2. Brief description of the P/F ratio method
women who do not survive to report the numbers of children they have borne does not differ from those who do survive.
If fertility has remained constant (in terms of both level and age distribution) over an extended period of time, and is the same for women who survive and do not survive to the time of the survey, then the P/F ratio should, with perfect recall, be equal to one. Hence, according to the original formulation of the method, deviations from unity in the ratio of P to F could be used diagnostically to understand the data better, and consequently this information can be used to derive a better estimate of fertility that corrects for errors in the reporting of cohort or lifetime fertility.4
One of the primary uses of the P/F ratio method, then, is to compensate for errors of recall which are presumed to occur in the reporting of fertility in developing countries. The developers of the P/F ratio method further argue that the typical error is that women’s recent fertility in censuses tends to be under-reported and that this is independent of their age: in other words, reported period fertility may be too low, but the shape of the fertility distribution can be assumed to be correct. By contrast, older women are presumed to be more likely to recall incompletely the number of children ever borne. If these conditions hold, then the extent of underreporting of lifetime (cohort) fertility, and hence the ‘true’ level of fertility can be estimated by scaling up the observed Total Fertility Rate by the ratio of P/F.
However, when fertility is falling, period fertility will be lower than lifetime fertility, and hence one would expect to see, under conditions of complete reporting of births, increasing departure of the P/F ratio from one with increasing age, which may be offset to an unknown degree by underreporting of lifetime fertility. It is implicit in the description of the method outlined above that, if current fertility were underreported but lifetime fertility were correct, there should be a uniform correction factor (a constant P/F ratio at all ages). However, where the indications are that there is both a decline in fertility underway as well as underreporting of current fertility, the P/F ratio will increase with age; and there is no obvious choice of scaling factor to be applied to the observed current fertility data to compensate for the generalised underreporting of recent fertility. Brass and Airey (1988:9) suggest that a “serious problem with the P/F ratio method is its vulnerability to changing fertility patterns. With changes in the level of fertility, the shape of the fertility distribution tends also to change.” How much of problem this changing age distribution of fertility poses to the method is an important component of the investigations conducted here.
4Of course, in different (i.e. developed country) settings, one can interpret the comparison of cohort and
Manual X (United Nations 1983) seeks to get round this problem by recommending that the P/F ratio for the 20-24 year old group (which is assumed to be mostly unaffected by recall error) be used to adjust reported period fertility data when fertility is falling. An alternative also mentioned is to use the average P/F ratio for the 20-24 and 25-29 age groups as the scaling factor.5
Feeney (1998) proposes yet another solution to the problems caused by declining fer-tility in applications of the P/F ratio method. His reconceptualisation of P/F ratio method to render it compatible with declining fertility is particularly elegant in its reasoning. He makes use of an empirical observation made by Norman Ryder (1964, 1983) that the av-erage parity (i.e. cumulated cohort fertility) of a given cohort of women at the mean age of childbearing (m) is a close approximation to the period fertility (i.e. TFR) that prevails at the time of the survey. On the basis of this observation, Feeney demonstrates how the P/F method can be reconceptualised (although left mathematically unchanged) in such a fashion as to make redundant the need for the assumption of constant fertility over time, with the P/F ratio applicable at the mean age of childbearing being the preferred scaling factor for the observed fertility rates. A further benefit of this approach, Feeney points out, is that a time series of other estimates of fertility can be attained simply by applying the P/F ratios applicable to each of the conventional age groups (15-19 to 45-49) to the observed fertility rates, with those rates applying to timesm−17.5;m−22.5...m−47.5 years after the survey. How well this reconceptualisation works is another issue addressed in the paper.
In this paper, we interrogate what happens to the results produced by the P/F ratio method as the first two assumptions are violated, first independently, and then concur-rently. Implications of a violation of the third assumption are discussed by means of general reasoning. However, before proceeding further it must be stressed that, in any practical application, there is an implicit trade-off between the conclusion that there has been a real fertility decline combined with a generalised underreporting of lifetime fertil-ity, with the conclusion that the fertility has remained constant. Since, for the most part, we will never actually know the true level of fertility (or indeed whether it is constant or not by age), this problem is more intractable than most.6 Although this problem is of great practical significance, it is not relevant to this paper, which seeks to show the effects of violations of the assumptions underlying the method in conditions where the data are
5For the rest of this paper, the conventional Brass P/F ratio referring to the fertility of women aged 20-24 is
referred to as Brass(2). The average ratio of women 20-29 is referred to as Brass(2,3). The index refers to the age groups, where 1 refers to 15-19, 2 to 20-24 etc.
6Over time, of course, one could get a measure of the level of past fertility by applying reverse survival
flawless and the true level of fertility is known.
3. Analytical approaches
We apply three distinct analytical approaches, each of which seeks to shed light on the implications of a violation of the assumptions for the results produced by the method. First, we apply mathematical reasoning, using the continuous form representation of the P/F ratio as a starting point and developing this expression as far as possible. As we show, without further hugely simplifying assumptions, this approach rapidly becomes intractable.
The second approach (presented in Section 3.2) develops the analysis a little further by means of general reasoning, while the third uses a simulation model with variable inputs regarding age patterns and trends in mortality and fertility to establish how the P/F ratio method behaves when many demographic parameters are changing simultaneously. The results from the three investigations are synthesised and interpreted in Section 4.
3.1 Mathematical reasoning
Letfp(a, t)be the (period) fertility rate of women agedaat timet. Then, the cumulative fertility of a cohort of women agedxat timet,P(x, t)is given by
P(x, t) = x
Z
0
fp(a, t−x+a)da ,
and the cumulated period fertility,F(x, t)will be
F(x, t) = x
Z
0
fp(a, t)da
But, by definition,
fp(a, t) = B(a, t)
W(a, t) =
B(a, t)
³ 1 1+s
´
B(·, t) exp
·
−
a
R
0
r(y, t)dy
¸
p(a, t)
,
probability that females born at timet−awill survive to agea(at timet) andr(y, t) =
∂lnW(y, t)/∂t.
Substituting this into the form of the P/F ratio, we get
P(x, t)
F(x, t) =
Z x
0
B(a,t−x+a) exp[Ra
0 r(y,t−x+a)dy]
B(·,t−x+a)p(a,t−x+a) da Z x
0
B(a,t) exp[Ra
0 r(y,t)dy]
B(·,t)p(a,t) da
and, sinceB(·, t−x+a) =B(·, t) exph−R0x−ar(y, t)dyi, the expression resolves to
P(x, t)
F(x, t) =
Z x
0
B(a,t−x+a) exp[Ra
0 r(y,t−x+a)dy] exp[−Rx−a
0 r(y,t)dy]p(a,t−x+a)
da
Z x
0
B(a,t) exp[Ra
0 r(y,t)dy]
p(a,t) da
(1)
It is further evident, that if∀t fp(a, t) =fp(a)then the ratioP(x, t)/F(x, t) = 1for allt(whether or not the population is stable).
Equation (1) offers the completely generalised formulation of the P/F ratio method, expressing the ratio under conditions of non-constant fertility, mortality and population growth. However, it is not particularly useful, as the magnitude and direction of any effects on the P/F ratio of changing those demographic assumptions cannot be resolved or identified readily. As Coale (1972:208) notes, expressions such as this may not be conducive to further analysis or manipulation:
It is quite possible that there is a general principle at work here: The age dis-tribution effects of certain simple specified sequences of fertility or mortality changes can be visualized, but the general case will always remain merely calculable, but not readily understandable at an intuitive level.
For this reason, and given the ‘simplification’ presented in Equation (1), it is proba-ble that further insights into the consequences of violations of the method’s assumptions obtained by pursuing this line of inquiry are limited.
3.2 General reasoning
approaching menopause) would imply a P/F ratio greater than one. If that fertility decline was monotonic, it would further imply a series of P/F ratios that increases monotonically with age, with the greatest departure from unity at the oldest ages. By itself, this observa-tion is not of practical use in estimating the level of fertility. However, if one maintains the assumption of constant fertility, but allows for underreporting of both current and cohort fertility, the relationship can be used to estimate the level of fertility that would pertain if fertility were constant.
To do so, two additional assumptions inherent to the Brass method are required; first that current (i.e. period) fertility is underreported by a constant proportion independent of age (i.e., women of any age are as likely to underreport the number of births they have had in the preceding 12 months). If fertility were constant and unchanging (and reports of lifetime fertility completely accurate) then the P/F ratios would indicate the factor by which the cumulated period fertility rates should be multiplied to provide an accurate estimate of fertility.
Second, in parallel with underreported current fertility, Brass surmises that women’s lifetime fertility will also tend to be underreported, but that - unlike current fertility - this underreporting will differ by age, with older women systematically underreporting their fertility more than younger women. This is believed to occur because older women have had more children and suffer greater lapses in recall about their lifetime fertility; a greater proportion of whom may have died or no longer be living with their mother. In such cases the P/F ratio, assuming perfectly reported current fertility, will deviate systematically from unity, and will decline with age.
3.2.1 Underreporting of current fertility
What implications does a degree of underreporting of current fertility have for the results? For the most part, the effect is trivial. With the exception of Feeney’s approach, the meth-ods all call for using the P/F ratios pertaining to the youngest ages. At these ages, cohort fertility is underreported to the least extent, while current fertility may be underreported (possibly significantly - Moultrie and Timæus (2003) observed that after removing clearly erroneous reports of current fertility from the 1996 South African census, only approxi-mately one in two births occurring in the twelve months before the census were actually reported to enumerators).
underreporting of fertility in and of itself will not, after correction, have an effect on the result, provided lifetime fertility is accurately reported.
3.2.2 Differential fertility between survivors and non-survivors
The effect of violations of the third assumption (that the fertility of those who have died is not different from those who survive to report their fertility) is not investigated in the simulations presented in the next section. The reason for not doing so is not that the matter is uninteresting (it is very interesting), but because censuses only collect fertility data of the living, and thus any assessment of the impact of differential fertility based on differential mortality by means of simulation exercises will merely reflect the assumptions used in the simulation.
older ages, the effect of HIV-related sub-fecundability is not only a function of cumulated fertility, but also the average age at death of HIV+ women. This determines whether, at death, infected women have had fewer children than uninfected women of the same age. Clearly if the death from HIV occurs at a sufficiently young age, that would not be the case. Results from the simulations below, in passing, offer some insight into this matter.
Where direct fertility estimation is not possible, the already-marginal effect of the omission of the fertility of dead women from the application of the P/F method is ampli-fied only slightly. The effect on the denominator will be as before, while the numerator will also be overstated, but by a greater amount as the cohort effect arising from sub-fecundability will be more noticeable (even if not severely) at most ages (other than the youngest). The net result of HIV alone is that the underlying fertility rate arising from the application of the P/F ratio method will be under-estimated. However, as we shall see in the following section, since the violation of the other underlying assumptions tends to cause the P/F ratio method to overestimate fertility slightly, the error in the method when fertility is falling in the context of an HIV epidemic is actually attenuated.
3.3 Simulation
Given the analytical complexity of Equation (1), simulation models offer an alternative approach to understanding what happens to the P/F ratio when fertility and mortality are changing. This section describes one such simulation model.
We describe a long-range single-sex cohort component population projection model. (The restriction to a single-sex population is simply for parsimony; and the assumption of a sex ratio at birth allows ready extrapolation to conventional fertility measures). In order to fully understand the implications of deviations from the assumptions on the results of the method, the projection period of necessity has to be long; the simulations described here begin with a base population, allow stationarity to be reached (at least in the popu-lation of reproductive age women), and then allow key parameters to change gradually in both directions before stability is re-attained.
The base population used is the stationary population associated with the Brass Gen-eral Standard. A fertility distribution is used which is assumed to be typical of pre-fertility transition African fertility distributions (in actual fact that associated with African South African women in the 1950s (Moultrie and Timæus 2002)). Initially, the Gross Replace-ment Ratio is set to maintain stationarity.
3.3.1 Variations in fertility
dis-tribution appropriate to post-transition fertility patterns (for convenience we assumed the pattern observed for White South Africans in 2001). The change in the shape of the fertil-ity distribution should not be linear (to avoid discontinuities at the beginning and end of the variation), so we assume it to follow a Weibull mixing function of the starting and end-ing fertility distributions parameterised such that the cumulative distribution progresses from 0 to (infinitely close to) 1 over a period of fifty years. The assumed standardised fertility distributions are as shown in Figure 1.
The level of fertility is set arbitrarily via the GRR such that fertility is assumed to rise from the fiftieth year of the projection for 25 years, and then to decline for a further 50 before a stable fertility rate is again attained.
Where required, the effect of HIV on fertility is allowed for by using the prevalences (and associated mortality rates) for female African South Africans as indicated by the ASSA model for South Africa (Actuarial Society of South Africa 2005) and a (smoothed) schedule of HIV-positive women’s fertility observed in Masaka by Zaba and Gregson (1998). We further assume that the fertility rate among HIV-positive women is roughly five sixths of that among HIV-negative women, a ratio that closely reproduces the Percent Attributable Change (PAC) of 0.4 found by Lewis et al. (2004) (i.e. for every 10 per cent in the level of population HIV prevalence, population fertility is expected to fall by 4 per cent). Caution should be exercised in interpreting these results: the PAC may not be universally applicable. Of potentially greater significance is that by assuming a constant PAC, one is implicitly assuming first that the mean duration of infection of those infected remains constant, and second that the impact of HIV on fertility is not a function of how long women have been infected.
3.3.2 Variations in mortality
Mortality is initially assumed to follow the Brass General standard, and then to improve. This is allowed for by using a relational logit transformation of the original life table holding beta constant (=1), but changing alpha linearly by -0.02 per year until infant mortality is less than 50 per 1 000 and then fixing the mortality schedule at that level. The change in mortality is assumed to start at time 50, and mortality reaches its revised stable level after 30 years.
As noted above, HIV prevalence is that from the ASSA model with the epidemic assumed to commence 75 years after the start of the projection. Additional mortality from HIV/AIDS associated with these prevalences is set to the associated single decrement life tables derived from the ASSA all-cause life tables. This mortality is then combined with the underlying mortality schedule to produce the assumed all-cause mortality.
Figure 1: Assumed standardised fertility distributions at times 50 to 100, in intervals of 10 years
simplicity of presentation, data by single age arising from the projections are grouped into the conventional quinquennial groups 15-19, 20-24 ... 45-49).
From these P/F ratios, we can seek to understand how well the P/F ratio method pre-dicts fertility rates (since we have assumed both the level and age distribution of fertility
a priori). In particular, we are interested in comparing and contrasting the estimates of total fertility (the commonly accepted headline indicator of fertility) produced as a result of using three different scaling factors:
a) the ratio of P(2)/F(2) - i.e. the P/F ratio for the age group 20-24, referred to as Brass(2);
b) the average of P(2)/F(2) and P(3)/F(3), referred to as Brass(2,3); c) the ratio of P(m)/F(m) - as suggested by Feeney.
We present the results from the simulations, and the implied total fertility arising from the application of the three scaling factors above, in the following section.
4. Results
age distribution of fertility; changes in the total fertility rate (an increase followed by a long-term decline), indicating a stylised demographic transition); changing levels and age distributions of mortality; and, finally, allowing for different fertility distributions and levels by mortality risk (as might typically be found in a country experiencing a generalised and extensive HIV/AIDS epidemic). Between them, the simulations cover errors and distortions arising from violation of each of the major assumptions underlying the method, first in isolation and then - where logically plausible - in concert. A summary of the simulations conducted is given in Table 1.
Table 1: Synopsis of simulations
Description Rationale
1 Stationary population Trivial – to test that the model produces the correct results under ideal circum-stances
2a Mortality constant (and no HIV); fertil-ity level constant; fertilfertil-ity age distribu-tion changing
Shows effect (implausible in reality) of changes in the timing of childbearing when fertility is constant
2b Mortality constant (and no HIV); fer-tility level changing; ferfer-tility age distri-bution constant
Shows effect of changing levels of fer-tility if age distribution of ferfer-tility is constant
2c Mortality constant (and no HIV); fertil-ity level and age distribution changing
Shows combined effects of 2a and 2b
3 Scenario 2c, and mortality changes To show non-effect of changes in mor-tality provided no differential fertility of those who die
4 Scenario 3, but with assumed effect of HIV on fertility
To show aggregate effect of violation of assumptions
5 Scenario 4, but no fertility change, other than that induced by HIV
To show the nett effect of HIV on the P/F method
4.1 Scenario 1 (stationary population)
The first simulation is inherently trivial, and was undertaken solely to establish that the projection model works, producing a stable population, with stable fertility, and a P/F ratio of one at all age groups based on the assumed parameters shown in Table 2.
Table 2: Parameterisation of Scenario 1
Base population Stable population based on Brass General standard Fertility level Constant
Fertility distribution Constant
Mortality Constant
HIV No
4.2 Scenario 2 (constant mortality; fertility changes)
This scenario is the first that considers the impact of changing fertility patterns on the results from the P/F ratio method. In Scenario 2a, mortality is assumed to remain constant, no HIV epidemic is assumed (and hence no knock-on effect on fertility), while the level of fertility is assumed to change, but not the age distribution. This, together with Scenario 2b (holding fertility levels constant, but not the age distribution) are highly artificial insofar as a change in the level of fertility unaccompanied by a change in age distribution of fertility is highly improbable. Nonetheless, these scenarios are useful in highlighting the (independent) effects of changes in the level and distribution of fertility on the P/F ratio method. The parameters for this scenario are shown in Table 3.
Table 3: Parameterisation of Scenario 2
Base population Stable population based on Brass General standard Fertility level Scenario 2a: Constant
Scenario 2b: Changing Scenario 2c: Changing Fertility distribution Scenario 2a: Changing Scenario 2b: Constant Scenario 2c: Changing
Mortality Constant
HIV No
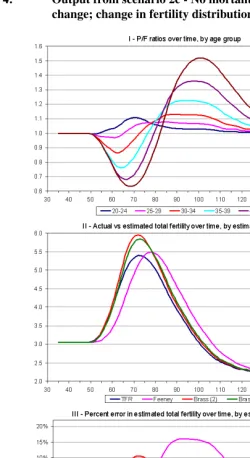
In respect of Scenario 2a (where only the age distribution of fertility changes), the biggest effect on the P/F ratio is concentrated in the youngest age group (panel I of Figure 2). Panel II of the same figure shows the estimated level of fertility arising from applica-tion of the three variants of the P/F method as described above. (The very slight decline in the ‘true’ fertility level arises because the fertility age distribution to which the dis-tribution tends has some residual fertility after age 49, which is not captured in the P/F method). The Feeney approach to estimating fertility has the lowest error of the three variants (panel III), which is not surprising, since it uses the P/F ratio at the mean age of childbearing (in the distributions to hand, around 27.5 years), to scale the current levels of fertility. For essentially similar reasons, the estimate of fertility derived from the average P/F ratio of women aged 20-29 represents a marginal improvement in accuracy over the estimate of fertility derived from the P/F ratio of women aged 20-24.
However, while the errors in the various methods are large (upwards of 15 per cent at times), these errors are far less generalised than those that arise from assuming that fertil-ity levels are constant when they are not. Scenario 2b is designed to illustrate the errors in fertility estimation that may arise if the age distribution of fertility remained constant, but fertility levels did not. Figure 3 shows the results from the simulation conducted under Scenario 2b. Several things are readily apparent from the output. First, the effect on the P/F ratios is reversed when fertility declines; the error is greatest among older women. Second, the effect on fertility estimation of declining fertility is a lot less severe than a change in age distribution, unless one uses the Feeney method, where the errors are of a similar magnitude - under-estimating (over-estimating) by around 20 per cent when fer-tility is rising (falling) fastest. Errors when using the P/F ratio of women aged 20-24 are consistently lower than when using the P/F ratio which is an average of the 20-24 and 25-29 age groups.
Scenario 2c (Figure 4) combines the effects of falling fertility and changing the age distribution of fertility, and - predictably - the results presented in Figure 4 can be readily interpreted as a combination of the two preceding scenarios. Again, the Feeney method is the least accurate variant, while using the P/F ratio for ages 20-24 (as suggested by Manual X (United Nations 1983)) is usually preferable to using the P/F ratio which is an average of the 20-24 and 25-29 age groups. For the most part of the fertility decline, however, the errors are relatively small (of the order of 5 per cent or less). In the context of the generally poor data which pertain when the indirect methods have to be applied, errors of this magnitude are not a major cause for concern.
4.3 Scenario 3 (mortality and fertility changes)
ceteris paribus- have an obvious effect on the overall population size, but no additional impact beyond those already described in Scenario 2c on the estimates of fertility. As can be seen from Figure 5, this is indeed the case. However, where mortality dynamics induce changes in fertility too, it stands to reason that there will be an impact on the results of the P/F ratio method. This is explored in Scenario 4.
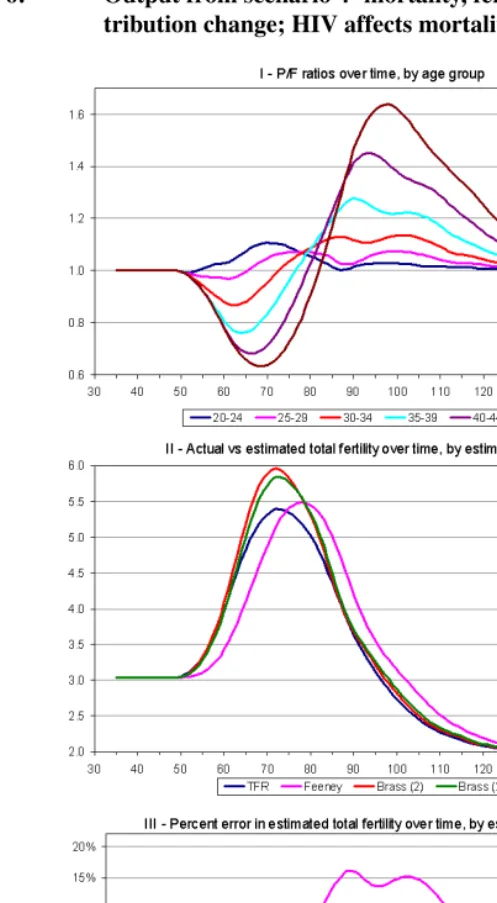
4.4 Scenario 4 (mortality and fertility changes; HIV affects fertility)
One obvious mortality effect that might induce fertility changes of its own is, of course, the HIV epidemic. Women who are infected with HIV have been found to have lower fertility, as well as a different age distribution of fertility (Lewis et al. 2004; Zaba and Gregson 1998). The effect of HIV/AIDS - on the assumptions outlined above - on the results produced by the P/F ratio method is investigated in Scenario 4; the results of which are shown in Figure 6. In general, the presence of an HIV epidemic slightly attenuates the overall impact of falling fertility and changing age distributions; this is largely due to the fact that the assumed age distribution of HIV fertility works to slow the increase in the mean age at childbearing. A clearer indication of this effect at work can be gained from assessing the impact of an assumed HIV epidemic on the P/F ratio in isolation from other assumed changes in fertility. This is considered in Scenario 5.
Output from this scenario allows the determination of the cross-over point (in age and time) at which the cumulated fertility of uninfected women exceeds that of infected women. This has bearing on the argument by general reasoning presented earlier regard-ing the likely direction of bias arisregard-ing from differential mortality of HIV positive women and its impact on fertility estimation.
While the mean age at childbearing is much younger among HIV-infected women (as expected from the much younger age distribution of fertility of these women), the results from the simulations suggest that, beyond age 38, the cumulated fertility of uninfected women is always greater than that of infected women, while the reverse holds for all ages under 29. Between these two ages, cumulated fertility by HIV status is essentially similar and which prevails is conditioned by the overall assumed level of HIV prevalence (since this affects the aggregate PAC applied to determine the total fertility of HIV-infected women).
The implication of this finding for the general reasoning presented in the previous section is that - at a census - among women up to the age of 30, fertility rates estimated directly from the data will tend not to be overestimated since the mean age at death of infected women in a generalised epidemic is older than 30, and therefore these women are still likely to be alive. Likewise, the reported average parities of women (used in the numerator of the P/F ratio) will not be significantly affected.
which suggests that the impact of HIV on the method is trivially small. This is shown more directly by the next scenario.
4.5 Scenario 5 (mortality changes; HIV affects fertility; no other fertility changes)
The final scenario (the results of which are shown in Figure 7) demonstrates that while other violations of the assumptions tended to cause the P/F ratio method to overestimate fertility when fertility is declining, the presence of an HIV/AIDS epidemic has a (small) counterbalancing effect on the P/F results. The drop in fertility shown in Panel II of Figure 7 arises from the assumed sub-fecundability of HIV-infected women, while the errors associated with each of the three variants of the estimation procedure clearly reflect the average age at which the scaling factor is determined.
Further, while, again, the Feeney approach works least well, all errors are in the same direction and - relative to the errors described in the preceding scenarios - are small. Nonetheless, these results would seem to indicate that - if anything - HIV has a (small) mediating effect on the errors produced by the P/F ratio method in a time of declining fertility.
As part of this scenario, we conduct one further investigation regarding the variation in the errors associated with HIV relative to the prevalence among women of childbearing age. This is best done by examining the plot of the errors presented in Panel III of Figure 7 against the HIV prevalence at each time point in the evolution of the epidemic (Figure 8). From this comparison, it would appear that the once the epidemic has achieved some kind of stability, the attenuating effect is, as might be expected, almost zero; the effect on the two Brass variants is greatest when prevalence is rising fastest.
5. Conclusions
Even in sub-Saharan Africa where the quality of census data is usually poor, neither DHS nor longitudinal studies are adequate substitutes for the demographic data collected in censuses. While the results from such surveys and studies contribute hugely to our un-derstanding of demographic dynamics, their small sample sizes and spatial concentration often mean that they cannot provide estimates of fertility (and even more so, mortality) that can be relied upon by policy makers. And, for as long as the quality of data collected in national censuses in the developing world (and Africa in particular) is too poor to allow direct estimation, demographers will have to continue to rely on estimates of fertility and mortality derived from the application of ‘indirect techniques’.
Figure 8: Percent error in different variants of the P/F method relative to HIV prevalence among women 15-49, Scenario 5
commonly applied technique (the P/F ratio method). As fertility has fallen across the con-tinent (Cohen 1993, 1998; Kirk and Pillet 1998) and as HIV has spread, those assumptions cannot be supposed still to hold.
Other indirect methods of demographic estimation have been subjected to similar in-quiries: Timæus and Nunn (1997) examined how well the orphanhood method of adult mortality performs in populations severely affected by HIV/AIDS; Dorrington and Timæus (2008) have looked at the relative merits of using a combination of the Generalised Growth Balance and Synthetic Extinct Generation methods to better estimate adult mor-tality; Ward and Zaba (forthcoming) investigate the impact of HIV/AIDS on the Brass Children Surviving: Children Ever Borne technique of estimating child mortality .
This paper has sought to understand the nature, magnitude and direction of biases aris-ing from systematic violation of the assumptions underlyaris-ing the Brass P/F ratio method. Brass and Airey (1988) speculated that changing age-distributions of fertility were a ‘se-rious problem’ with the method. The investigations conducted here suggest that these concerns are well-founded. However, the much greater contributors to errors in the Brass P/F ratio method are those arising from changes in the level of fertility.
rec-ommended scaling factors (using the P/F ratio at age 20-24, or the average ratio between 20 and 29), although the former appears to be preferable - except when fertility is increas-ing. In general though, the errors induced by either of the conventional scaling factors are small: only after a sustained rise in fertility are the errors in estimated fertility greater than ten per cent. For the most part, they are under five per cent. Bearing in mind the almost certainly poor quality of the data that would necessitate the use of this method in the first place, these errors are acceptable.
By contrast, the Feeney approach appears to get the peak of the schedule about right, but the entire curve seems to be shifted to the right by about six years. Quite why this is so (or, indeed, whether or not this is even a robust finding) is something requiring further examination. Intuitively, we suspect that Ryder’s equivalence (on which Feeney’s method hinges) does not hold when fertility is falling.
The findings presented here suggest that differential fertility between HIV-infected and HIV-uninfected women has a trivial impact on the methods, even in an environment with a simulated high prevalence epidemic, and that effect - such as it may be - serves to attenuate the extent of over-estimation of fertility identified above.
References
Actuarial Society of South Africa (2005). ASSA2003 AIDS and demographic model. electronic resource. www.actuarialsociety.org.za/aids. Accessed: 22 June 2008.
Arriaga, E. E. (1983). Estimating fertility from data on children ever born, by age of mother. Washington: US Deptment of Commerce, Bureau of the Census. (International research document; 11 ISP-RD-11).
Bongaarts, J. and Feeney, G. (1998). On the quantum and tempo of fertility. Population and Development Review, 24(2):271–291.
Booth, H. (1980). The estimation of fertility from incomplete cohort data by means of the transformed Gompertz model. [unpublished] PhD thesis, London: University of London.
Booth, H. (1984). Transforming Gompertz’ function for fertility analysis: The develop-ment of a standard for the relational Gompertz function.Population Studies, 38(3):495– 506.
Brass, W. (1964). Uses of census or survey data for the estimation of vital rates. Paper presented at African Seminar on Vital Statistics, Addis Ababa, 14-19 December 1964.
Brass, W. (1978). The relational Gompertz model of fertility by age of woman. London: Centre for Population Studies, London School of Hygiene and Tropical Medicine.
Brass, W. (1996). Demographic data analysis in less developed countries: 1946-1996.
Population Studies, 50(3):451–467.
Brass, W. and Airey, P. (1988). The P/F ratio. [unpublished lecture notes]. London: Centre for Population Studies, London School of Hygiene and Tropical Medicine.
Brass, W., Coale, A. J., Demeny, P., Heisel, D. F., Lorimer, F., Romaniuk, A., and van de Walle, E., editors (1968). The demography of tropical Africa. Princeton: Princeton University Press.
Cleland, J. (1996). Demographic data collection in less developed countries. Population Studies, 50(3):433–450.
Coale, A. (1972). The growth and structure of human populations. Princeton: Princeton University Press.
Cohen, B. (1998). The emerging fertility transition in sub-Saharan Africa. World Devel-opment, 26(8):1431–1461.
Dorrington, R. and Timæus, I. M. (2008). Death distribution methods for estimating adult mortality: Sensitivity analysis with simulated data errors, revisited. Paper presented at the 73rd Annual Meeting of the Population Association of America, New Orleans, Louisiana, United States, 17-19 April 2008.
Feeney, G. (1998). A new interpretation of Brass’ P/F ratio method applicable when fertility is declining. [electronic resource]. http://www.gfeeney.com/notes/pfnote/pfnote.htm. Accessed: 22 June 2008.
Kirk, D. and Pillet, B. (1998). Fertility levels, trends and differentials in sub-Saharan Africa in the 1980s and 1990s. Studies in Family Planning, 29(1):1–22.
Lewis, J. J. C., Ronsmans, C., Ezeh, A., and Gregson, S. (2004). The population impact of hiv on fertility in sub-saharan africa. AIDS, 18(S2):S35–S43.
Moultrie, T. A. and Dorrington, R. (2004). Estimation of fertility from the 2001 South Africa Census data. Cape Town: Centre for Actuarial Research for Statistics South Africa.
Moultrie, T. A. and Timæus, I. M. (2002). Trends in South African fertility be-tween 1970 and 1998: An analysis of the 1996 census and the 1998 demographic and health survey. [electronic resource]. Cape Town: Medical Research Council. http://www.mrc.ac.za/bod/trends.pdf. Accessed: 22 June 2008.
Moultrie, T. A. and Timæus, I. M. (2003). The South African fertility decline: Evi-dence from two censuses and a demographic and health survey. Population Studies, 57(3):265–283.
N´ı Bhrolch´ain, M. (1992). Period paramount? A critique of the cohort approach to fertil-ity.Population and Development Review, 18(4):599–629.
Ryder, N. B. (1964). The process of demographic translation. Demography, 1(1):74–82. Ryder, N. B. (1983). Cohort and period measures of changing fertility. In Bulatao, R. A.,
Lee, R. D., Hollerbach, P. E., and Bongaarts, J., editors, Determinants of fertility in developing countries. Vol. 2: Fertility regulation and institutional influences, pages 737–756. New York: Academic Press.
United Nations (1983).Manual X: Indirect techniques for demographic estimation. New York: United Nations.
US Bureau of the Census (1997). Population analysis spreadsheets (pas) for excel. [electronic resource]. Washington: US Bureau of the Census. http://www.census.gov/ipc/www/pasex.html. Accessed: 22 June 2008.
Ward, P. and Zaba, B. (forthcoming). The effect of HIV on the estimation of child mor-tality using the children surviving / children ever born technique. Southern African Journal of Demography.
Zaba, B. (1981).Use of the relational Gompertz model in analysing fertility data collected in retrospective surveys. London: Centre for Population Studies, London School of Hygiene and Tropical Medicine. (Centre for Population Studies Research Paper; 81-2). Zaba, B. and Gregson, S. (1998). Measuring the impact of HIV on fertility in Africa.