Online at http://desert.ut.ac.ir
Desert 23-2 (2018) 243-253
Study of spatial and temporal rain and drought patterns in the
south of Iran using TRMM
M. Fetemi
*a, M. Narangifard
aa
Department of Geography, Faculty of Human Science, Meybod University, Yazd, Iran
Received: 28 October 2017; Received in revised form: 21 April 2018; Accepted: 5 May 2018
Abstract
Droughts are one of the most damaging climatic phenomena, and the most complex natural hazard which affects the economy, agriculture, public health and environment in large areas. The aim of this study is to compare drought indicators derived from tropical rainfall measuring mission (TRMM) data in the south of Iran. Also the TRMM rainfall was considered, so as to investigate changes in the rainfall pattern over the area. In this study, five meteorological drought indices, including the standard precipitation index (SPI), deciles index (DI), z-Score, Standard Index of Annual Precipitation (SIAP) and Percent of Normal Precipitation Index (PNPI) derived from TRMM data at 0.25° × 0.25° spatial resolution are compared to monitor droughts in the South of Iran. The results showed that the SPI index was strongly correlated with other drought indices. The maximum relation of the SPI index with other drought indices was investigated, and the PNPI Index was found to have the most correlation, with a correlation coefficient of R = 0.995 and a coefficient of determination of R2 = 0.99. Also a strong inverse relationship was observed between rain and longitude while altitude and latitude were found to be poorly related.
Keywords: Rain; Drought indices; South of Iran; TRMM
1. Introduction
Drought is a complex natural hazard and a
major
environmental
disaster;
which
is
characterized by a lack of precipitation (Su
et
al
., 2003; Paulo
et al
., 2012; Gocic & Trajkovic,
2014). Drought is a climate extreme, linked with
a high incidence in human development
(Domínguez-Castro
et al
., 2008). As extreme
climate events, droughts tend to grow in
intensity frequency under global warming,
especially in the semi-arid regions of the
northern hemisphere (Zhang and Jia, 2013).
Drought directly reduces water availability to
plants, which in turn diminishes the productivity
(yield) of crops, forestry and (grazed)
rangeland. It also lowers surface and
sub-surface water supplies, which may result in less
arable land areas, and an increase in the
mortality rate of livestock and wildlife
Corresponding author. Tel.: +98 35 35220281
Fax: +98 35 35220281
E-mail address: [email protected]
Moreover, since economic sectors are closely
interrelated, these indirect impacts may spread
to other sectors of the economy that are well
beyond the sector and area(s) experiencing
drought (Salami
et al
., 2009).
synthesize precipitation are developed and used
to monitor the complex process of drought (Du
et al
., 2013). Accordingly, the aforementioned
precipitation products have been employed in
many researches involving drought monitors
(Rhee
et al
,. 2010; Frolking
et al
., 2011; Son
et
al
., 2012; Ezzine
et al
., 2014; Yaduvanshi
et al
.,
2015; Sahoo
et al
., 2015; Hatmoko
et al
., 2016;
Mozafari and Narangifard, 2016; Park
et al
.,
2016 and 2017). Also, various studies on
drought have been undertaken by researchers in
Iran (Morid
et al
., 2006; Bajgiran
et al
., 2008;
Karimpour Reyhan
et al
., 2009; Mozafari
et al
.,
2011; Nosrati & Zareiee, 2011; Shahabfar
et al
.,
2012; Moazami
et al
., 2013; Keshavarz
et al
.,
2013; Keshavarz & Karami, 2014; Golian
et al
.,
2015; Omidvar
et al
., 2016; Fatemi
et al
., 2017)
and in the Middle East, Mediterranean (Zaitchik
et al
., 2007; Al-Dousari
et al
., 2008; Almazroui,
2011; Kaniewski
et al
., 2012; Nastos
et al
.,
2013).
The aim of this study is to compare drought
indices, including the standard precipitation
index (SPI), deciles index (DI), z-Score,
Standard Index of Annual Precipitation (SIAP)
and Percent of Normal Precipitation Index
(PNPI) derived from tropical rainfall measuring
mission (TRMM) data in the south of Iran.
Also, TRMM rainfall was considered to
investigate variation in rainfall patterns over the
study area.
2. Materials and Methods
2.1. Study area
The study area is located in the south of Iran
in an area of about 594092 km
2between 25°N
to 32°N and 50°E to 63°E. The study area
covers the six provinces of Kohgiluyeh and
Boyer-Ahmad, Fars, Blusher, Hormozgan,
Kerman and Sistan and Baluchistan.
Fig. 1. Clipped TRMM dataset on a map of Southern Iran containing 867 grids with a resolution of 0.25°× 0.25°
2.2. Precipitation dataset
The tropical rainfall measuring mission
(TRMM) is a joint mission between the
National Aeronautics and Space Administration
(NASA) of the United States and the National
Space Development Agency (NASDA) of
Japan. The objectives of TRMM are to measure
tropical and subtropical precipitation and
estimate its associated energy exchange. A
number of precipitation-related sensors, such as
the precipitation radar (PR), TRMM microwave
imager (TMI), and visible and infrared
radiometer system (VIRS) are on board TRMM
(Kummerow
et al
., 1998; Almazroui, 2011).
The TRMM satellite was launched in November
1997, and since then, several algorithms have
been developed to estimate rainfall (e.g., Iguchi
et al
., 2000; Zhang & Jia, 2013). In this study,
the precipitation dataset at a spatial resolution of
0.25° × 0.25° was used. It has covered the
latitude band extending from 50° south to 50°
north from 1998 to the present. This dataset is
freely
available
at
this
address
(http://disc2.nascom.nasa.gov).
2.3. Drought indices
There are several indices to measure the
deviation of precipitation from historically
established norms for a given period of time.
None of major indices are inherently superior to
others in all circumstances, but some indices are
better suited for certain applications (Monacelli
et al
., 2005). More than 150 drought indices
have been developed (Niemeyer, 2008; Zargar
et al
., 2011). A large number of indices have
been suggested and used for the detection and
monitoring of meteorological, agricultural,
hydrological and socio-economical droughts
(Javan
et al
., 2016). Five drought indices
selected for this study include, the standard
precipitation index (SPI) proposed by (Mckee
et
al
., 1993), the deciles index (DI), which was
developed by Gibbs and Maher (1967), z-Score,
the Standard Index of Annual Precipitation
(SIAP) and the Precipitation Index Percent of
Normal (PNPI).
2.3.1. Standard Precipitation Index (SPI)
Among all drought indices, SPI is the most
popular, as it is widely used for the purpose of
drought analysis around the world (e.g. Hayes
et
al
., 1999; Raziei
et al
., 2009; Ibrahim
et al
.,
2010; Mirabbasi
et al
., 2013; Nohegar
et al
.,
2013: Fatemi
et al
., 2015; Omidvar
et al
., 2016).
SPI is characterized by features such as
statistical consistency, and the ability to
describe both short-term and long-term drought
impacts in different timescales of precipitation
anomalies. The probabilistic nature of SPI
allows its comparison in various locations
(Mirabbasi
et al
, 2013). The Standard
Precipitation Index (SPI) was used for
identifying dry periods by way of statistical
analysis (Eq. 1). This index was developed by
Mckee
et al
(1993) based on the following
equation:
SPI =
Pi − P̅SD
(1)
Where, Pi is the precipitation in i
th
year,
P
̅
is
the average precipitation during the statistical
period and SD is the standard deviation of the
precipitation series. The positive values of the
index shows that precipitation is above average
while the negative values indicates varying
intensities of drought (Table 1).
Table 1. Varying intensities of drought based on the Standard Precipitation Index Standard precipitation index Index value
2 and more Extremely severe wet years
1.5 to 1.99 Severe wet years
1 to 1.49 Moderate wet years
-0.99 to 0.99 Normal
-1 to -1.49 Moderate drought
-1.5 to -1.99 Severe drought
-2 and less Extremely severe drought
2.3.2. Standard Index of Annual Precipitation
(SIAP)
The best method for transforming raw
precipitation data into relative amounts is to
divide the deviation of precipitation from the
mean by standard deviation. In this regard,
Khalili (1991, 1998) provided the standard
index precipitation as followed for studying the
process of dry and wet periods in Iran. In
addition to the mean, this index considers the
standard deviation. The SIAP may be negative
(dry) or positive (wet) in some stations, which is
due to the different pluvial systems in various
parts of the country (Javan
et al
., 2016).
The values of SIAP can be computed using the
following equation:
SIAP=
𝑃𝑖−𝑝̅𝑆𝐷
(2)
Where Pi is the sum of precipitation in a
given wet year, P is the average wet year
precipitation, and SD is the standard deviation
of the wet year precipitation (mm) (Bazrafshan
and Khalili, 2013).
The trend of dry and wet years can be
determined as follows:
Table 2. Standard index of annual precipitation (SIAP) drought category (Sadat Noori et al., 2013) Classification
SIAP value
Extremely wet ≥ 0.84
Wet 0.52 to 0.84
Normal - 0.52 to 0.52
Dry - 0.84 to - 0.52
2.3.3. Percent of Normal Precipitation Index
(PNPI)
The PNPI is a simple measurement of
precipitation for a given location. The
identification of drought trend by PNPI provides
a descriptive analysis of a single region or a
single season. This index can be calculated for a
variety of timescales (a single month, a number
of months representing a particular season, and
annual or water years). The PNPI for any given
location is estimated at 100% (Javan
et al
.,
2016). This index is calculated according to the
following equation:
PNPI
=
𝑃𝑖𝑃
× 100 (3)
Where
Pi
is actual precipitation and
P
is
normal precipitation (Sayari
et al
., 2013).
Table 3. PNPI values for classes of drought severity (Willeke et al., 1994)
PNPI Class
−0.25 < PNPI ≤ 0.25 Normal
−0.52 ≤ PNPI < −0.25 Light drought −0.84 ≤ PNPI < −0.52 Moderate drought −1.28 ≤ PNPI < −0.84 Severe drought
PNPI ≤ −1.28 Extreme drought
3. Results and Discussion
3.1. On-site analysis of drought
The calculated drought and rain indices are
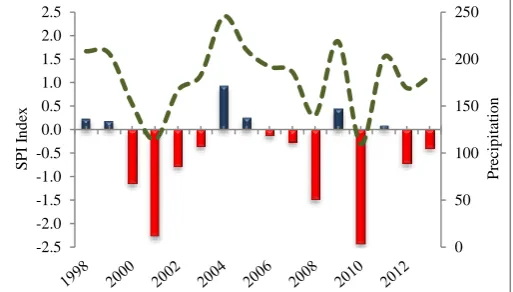
presented in Table 4. Fig 2 shows a comparison
of both rain indices and SPI. In Figure 3, a
comparison of time series of drought indices for
the base period (1998–2013) is shown.
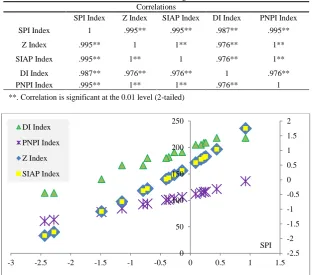
In this section, drought indices were
compared using the Matrix plot and the Pearson
Correlation method. The Pearson correlation
coefficient (
R
2) for the SPI versus
Z Index,
SIAP index, DI index and PNPI index were
computed in the study area at a confidence level
of 99%. The results suggested that the SPI index
was positively related to other drought indices
(fig 4 and 5). The strongest correlation between
SPI and other drought indices (PNPI Index) was
observed at a correlation coefficient of R=0.995
and a coefficient of determination of R2=0.99.
Fig. 2. Diagram of SPI annual changes and annual precipitation
Fig. 3. Comparison of drought indices time series for the base period (1998–2013) 0 50 100 150 200 250
-2.5 -2.0 -1.5 -1.0 -0.5 0.0 0.5 1.0 1.5 2.0 2.5
P
re
ci
p
it
at
io
n
S
P
I
In
d
ex
0 25 50 75 100 125 150 175 200 225
-3.0 -2.5 -2.0 -1.5 -1.0 -0.5 0.0 0.5 1.0 1.5 2.0
Table 4. Drought indices, category and rain
year Rain SPI Index
Drought
Severity Z Index
Drought
Severity DI Index Drought Severity PNPI Index Drought Severity SIAP Index Drought Severity
1998 208.28 0.23 Near normal 0.76 Moderately Wet 209 Above normal 116 Normal 0.76 Wet
1999 205.98 0.18 Near normal 0.69 Moderately Wet 205 Slightly above
normal 114 Normal 0.69 Wet
2000 152.46 -1.14 Moderately dry -0.75 Moderately Dry 166 Below normal 85 Normal -0.75 Dry
2001 114.11 -2.28 Extremely dry -1.78 Severely Dry 114 Extremely below
normal 63 Moderate drought -1.78 Severely dry
2002 166.30 -0.79 Near normal -0.37 Near Normal 166 Below normal 92 Normal -0.37 Normal
2003 182.57 -0.36 Near normal 0.06 Near Normal 182 Normal 101 Normal 0.06 Normal
2004 245.19 0.92 Near normal 1.75 Very Wet 218 Extremely above
normal 136 Normal 1.75 Very wet
2005 209.70 0.26 Near normal 0.79 Moderately Wet 209 Above normal 116 Normal 0.79 Wet
2006 191.84 -0.14 Near normal 0.31 Near Normal 191 Normal 106 Normal 0.31 Normal
2007 186.31 -0.27 Near normal 0.16 Near Normal 191 Normal 103 Normal 0.16 Normal
2008 140.04 -1.48 Moderately dry -1.08 Moderately Dry 140 Well below normal 78 Slight drought -1.08 Severely dry
2009 218.81 0.44 Near normal 1.04 Moderately Wet 218 Well above normal 121 Normal 1.04 Very wet
2010 109.53 -2.43 Extremely dry -1.90 Severely Dry 114 Extremely below
normal 61 Moderate drought -1.90 Severely dry
2011 201.84 0.09 Near normal 0.58 Moderately Wet 205 Slightly above
normal 112 Normal 0.58 Wet
2012 169.13 -0.72 Near normal -0.30 Near Normal 180 Slightly below
normal 94 Normal -0.30 Normal
2013 180.89 -0.40 Near normal 0.02 Near Normal 180 Slightly below
SPI Index 0.0
-1.2
-2.4
PNPI Index
SIAP Index
DI Index
200 150 100 Z Index
2 0
-2 -2 0 2
2
0
-2 120
90
60 2
0
-2
0.0 -1.2 -2.4 200
150
100
120 90 60
Matrix Plot of SPI Index; Z Index; PNPI Index; SIAP Index; DI Index
Fig. 4. Matrix plot of drought indices
Table 5. Pearson Correlation between SPI and other drought indices Correlations
SPI Index Z Index SIAP Index DI Index PNPI Index
SPI Index 1 .995** .995** .987** .995**
Z Index .995** 1 1** .976** 1**
SIAP Index .995** 1** 1 .976** 1**
DI Index .987** .976** .976** 1 .976**
PNPI Index .995** 1** 1** .976** 1
**. Correlation is significant at the 0.01 level (2-tailed)
Fig. 5. Dispersion diagram of SPI and other drought indices
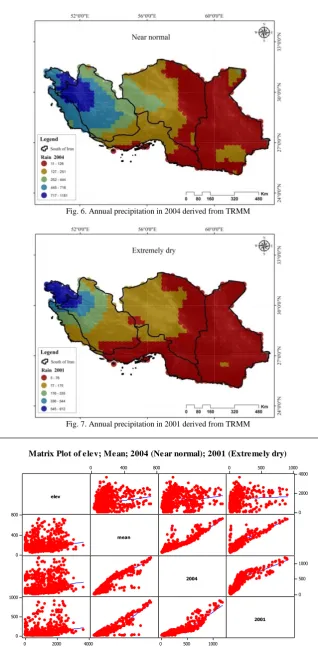
The maps of annual precipitation in 2004 for
drought severity (near normal) and in 2001 for
drought severity (extremely dry), which were
derived from TRMM data, are drawn using GIS
software, as shown in Figs. 6 and 7). According
to Fig. 6, the highest rainfall was received in
2004 in the west of the study area (717-1181
mm), while the minimum rainfall was recorded
in the eastern parts of Kerman and Sistan and
Baluchistan provinces (11-126 mm). Also, a
strong inverse relationship was found between
rain and longitude along with a poor positive
relationship between altitude and latitude (Figs.
8 and tab. 6).
Based on the findings, the
maximum rainfall was recorded in Kohgiluyeh
and Boyer-Ahmad province in 2001 (545-912
mm) and the lowest rainfall (5-76 mm) was
observed in the east of Kerman province, the
south of Fars province, and in Hormozgan and
Sistan and Baluchestan provinces (Fig. 7).
-2.5 -2 -1.5 -1 -0.5 0 0.5 1 1.5 2
0 50 100 150 200 250
-3 -2.5 -2 -1.5 -1 -0.5 0 0.5 1 1.5
SPI DI Index
PNPI Index
Z Index
Fig. 6. Annual precipitation in 2004 derived from TRMM
Fig. 7. Annual precipitation in 2001 derived from TRMM
elev
2004
2001 mean
800 400
0 0 500 1000
4000
2000
0 800
400
0
1000
500
0
4000 2000 0
1000
500
0
1000 500 0
Matrix Plot of e lev; Mean; 2004 (Ne ar normal); 2001 (Extreme ly dry)
Table 6. The results of Pearson Correlation
Latitude Longitude Elev mean 2001 2004 Latitude 1 -.352** .459** .251** .336** .303**
Longitude -.352** 1 -.225** -.694** -.828** -.852**
mean .251** -.694** .212** 1 .915** .890**
Elev .459** -.225** 1 .212** .295** .229**
2001 .336** -.828** .295** .915** 1 .944**
2004 .303** -.852** .229** .890** .944** 1
**. Correlation is significant at the 0.01 level (2-tailed).
4. Conclusions
In the current study, five meteorological
drought indices including SPI, DI, z-Score,
SIAP and PNPI, which were derived from the
tropical rainfall measuring mission (TRMM)
data in the South of Iran during 1998–2013
period, were used. First, the time-series of
drought indices were constructed for the 1998–
2013 period based on monthly mean rainfall
values
to
determine
drought
categories.
According to the results, drought indices were
relatively similar. For example, 2004 was a
rainy year with an average rainfall of 245 mm,
and all drought indices indicated wet conditions
for this year (SPI Index: near normal, Z Index:
extremely wet, DI index: well above normal,
PNPI index: normal, SIAP index: extremely
wet). Also in 2010 (low rainfall) with an
average rainfall of 109 mm, drought severity
indices were almost identical (SPI Index:
extremely dry, Z index: severely dry, DI index:
well below normal, PNPI index: moderate
drought, SIAP index: severely dry). The results
of drought monitoring in the South of Iran using
SPI suggested a severe drought in 2001 and
2010, and moderate drought in 2000 and 2008.
The results of the Z index showed severe
drought in 2001 and 2010, moderate drought in
2000 and 2008, near normal condition in 2002,
2003, 2006, 2007, 2012 and 2013, moderately
wet in 1998, 1999, 2005 and 2011 and
extremely wet in 2004. Also, the SPI index was
positively related to other drought indices. The
strongest relation between the SPI index and
other drought indices was with the PNPI Index,
at a correlation coefficient of R = 0.995 and a
coefficient of determination of R2 = 0.99.
Finally, based on the findings, a strong inverse
relationship was found between rainfall and
longitude while altitude and latitude were found
to be in a poor positive relationship.
The use of TRMM satellite data is
recommended for proper drought monitoring
(Du
et al
., 2013; Zhang and Jia, 2013). Also, the
results of another study (Hatmoko
et al
., 2016)
showed that Meteorological Drought Index
derived from TRMM provides more accurate
results compared to APHRODITE for SPI of 3
to 12 months, except for SPI 1 month.
Nevertheless, the hydrological drought index
obtained from TRMM yields superior result.
The efficiency of TRMM satellite data,
especially in southern Iran and Fars province,
for monitoring drought, has been confirmed in
several studies (Erfanian
et al
., 2014; Shirvani
and Fakhari Zade Shirazi, 2014; Rasouli
et al
.,
2016).
References
Al-Dousari, A., A. Ramdan, A. Al Ghadban, 2008. Site- specific precipitation estimate from TRMM data using bilinear weighted interpolation technique: An example from Kuwait. Journal of arid environments, 727; 1320-1328. doi:10.1016/j.jaridenv.2007.12.013 Almazroui, M., 2011. Calibration of TRMM rainfall climatology over Saudi Arabia during 1998–2009. Atmospheric Research, 99; 400-414.
doi:10.1016/j.atmosres.2010.11.006.
Bajgiran, P. R., A. A. Darvishsefat, A., Khalili, M. F. Makhdoum, 2008. Using AVHRR-based vegetation indices for drought monitoring in the Northwest of Iran. Journal of Arid Environments, 72; 1086-1096. doi:10.1016/j.jaridenv.2007.12.004.
Bazrafshan, J., A. Khalili, 2013. Spatial Analysis of Meteorological Drought in Iran from 1965 to2003. Desert, 18; 63-71.
Domínguez-Castro, F., J. I., Santisteban, M., Barriendos, R. Mediavilla, 2008. Reconstruction of drought episodes for central Spain from rogation ceremonies recorded at the Toledo Cathedral from 1506 to 1900: A methodological approach. Global and Planetary Change, 63; 230-242.
doi.org/10.1016/j.gloplacha.2008.06.002.
Du, L., Q., Tian, T., Yu, Q., Meng, T., Jancso, P., Udvardy, Y. Huang, 2013. A comprehensive drought monitoring method integrating MODIS and TRMM data. International Journal of Applied Earth Observation and Geoinformation, 23; 245-253. doi.org/10.1016/j.jag.2012.09.010.
Erfanian, M., S. Kazempour, H. Heidari, 2016. Calibration of TRMM satellite 3B42 and 3B43 rainfall data in climatic zones of Iran. Physical Geography, 48; 287-303.
DOI: 10.22059/jphgr.2016.59370.
Terra/MODIS NDVI Data in Fars Province, Iran. Physical geography, 46; 93-108.
DOI: 10.22059/jphgr.2014.50621.
Ezzine, H., A. Bouziane, D. Ouazar, 2014. Seasonal comparisons of meteorological and agricultural drought indices in Morocco using open short time- series data. International Journal of Applied Earth Observation and Geoinformation, 26; 36-48. doi.org/10.1016/j.jag.2013.05.005.
Fatemi, M., K. Omidvar, E., Mesgari, M. Narangifard, 2017. Spatial analysis and investigation of Tele- connection patterns with drought in central Iran. Journal of the Earth and Space Physics, 42; 49-61. Fatemi, M., K. Omidvar, K. K. Hatami Bahman Beiglou, M. Narangifard, 2015. Using Principle Component Analysis in Identifying Synoptic Patterns of Wet Periods in Central Iran. J Earth Sci Clim Change. 6:309. doi:10.4172/2157-7617.1000309.
Frolking, S., T. Milliman, M. Palace, D. Wisser, R. Lammers, M. Fahnestock, 2011. Tropical forest backscatter anomaly evident in SeaWinds scatterometer morning overpass data during 2005 drought in Amazonia. Remote Sensing of Environment, 115; 897-907.
doi.org/10.1016/j.rse.2010.11.017.
Gibbs, W.J., J.V. Maher, 1967. Rainfall Deciles as Drought Indicators. Bureau of Meteorology bulletin No. 48; Commonwealth of Australia, Melbourne, VIC, Australia.
Gocic, M., S. Trajkovic, 2014. Spatiotemporal characteristics of drought in Serbia. Journal of Hydrology, 510; 110-123.
doi.org/10.1016/j.jhydrol.2013.12.030.
Golian, S., O. Mazdiyasni, A. AghaKouchak, 2015. Trends in meteorological and agricultural droughts in Iran. Theoretical and Applied Climatology, 119; 679- 688. DOI 10.1007/s00704-014-1139-6.
Hatmoko, W., W. Seizarwati, R. Vernimmen, 2016. Comparison of TRMM Satellite Rainfall and APHRODITE for Drought Analysis in the Pemali- comal River Basin. Procedia Environmental Sciences, 33; 187-195.
Hatmoko, W., W. Seizarwati, R. Vernimmen, 2016. Comparison of TRMM Satellite Rainfall and APHRODITE for Drought Analysis in the Pemali- comal River Basin. Procedia Environmental Sciences, 33; 187-195.
Hayes, M. J., M. D. Svoboda, D. A., Wilhite, O. V. Vanyarkho, 1999. Monitoring the 1996 drought using the standardized precipitation index. Bulletin of the American Meteorological Society, 80; 429-438. http://disc2.nascom.nasa.gov
Ibrahim, K., W. Z. W. Zin, A. A. Jemain, 2010. Evaluating the dry conditions in Peninsular Malaysia using bivariate copula. ANZIAM Journal, 51; 555- 569.
Javan, K., M. R. Azizzadeh, S. Yousefi, 2016. An Investigation and assessment of meteorological drought in Lake Urmia Basin using drought indices
and probabilistic methods. Natural Environment Change, 2; 153-164.
Kaniewski, D., E. Van Campo, H. Weiss, 2012. Drought is a recurring challenge in the Middle East. Proceedings of the National Academy of Sciences, 109; 3862-3867.
Karimpour Reyhan, M., Y. Esmaeilpour, A. R. M. E. N., Malekian, N., Mashhadi, N. Kamali, 2009. Spatio- Temporal Analysis of Drought Vulnerability using the Standardized Precipitation Index (Case study: Semnan Province, Iran). Desert, 14; 133-140. Keshavarz, M., E. Karami, 2014. Farmers' decision- making process under drought. Journal of Arid Environments, 108; 43-56.
doi.org/10.1016/j.jaridenv.2014.03.006.
Keshavarz, M., E. Karami, F. Vanclay, 2013. The social experience of drought in rural Iran. Land Use Policy, 30; 120-129.
doi.org/10.1016/j.landusepol.2012.03.003.
Mckee, T.B., N.J, Doesken, J, Kleist, 1993. The relationship of drought frequency and duration to time scales, In: Proc. 8th conference on applied climatology. January 17-22; 179- 184.
Mirabbasi, R., E. N. Anagnostou, A., Fakheri-Fard, Y., Dinpashoh, S. Eslamian, 2013. Analysis of meteorological drought in northwest Iran using the Joint Deficit Index. Journal of Hydrology, 492; 35- 48.
Moazami, S.,S. Golian, M.R. Kavianpour, Y. Hong, 2013. Comparison of PERSIANN and V7 TRMM Multi-satellite Precipitation Analysis (TMPA) products with rain gauge data over Iran. International journal of remote sensing, 34; 8156-8171. doi.org/10.1080/01431161.2013.833360.
Monacelli, G., M. C. Galluccio, M. Abbafati, 2005. Drought assessment and forecasting. Drought within the context of the region VI.
Morid, S., V. Smakhtin, M. Moghaddasi, 2006. Comparison of seven meteorological indices for drought monitoring in Iran. International journal of climatology, 26; 971-985. DOI: 10.1002/joc.1264. Mozafari, G. A., M. Narangifard, 2015. The Vegetative Cover Deterioration Due to the Droughts on the Mulla Sadra Watershed and Application of Remote Sensing Techniques in Its Monitoring. Water Engineering, 8; 1-14.
Mozafari, G.A., Y. Khosravi, E. Abbasi, F. Tavakoli, 2011. Assessment of geostatistical methods for spatial analysis of SPI and EDI drought indices. World Applied Sciences Journal, 15; 474-482. Nastos, P. T., J. Kapsomenakis, K.C. Douvis, 2013. Analysis of precipitation extremes based on satellite and high-resolution gridded data set over Mediterranean basin. Atmospheric Research, 131; 46- 59. doi.org/10.1016/j.atmosres.2013.04.009
Nohegar, A., M. Heydarzadeh, A. Malekian, 2013. Assessment of Severity of Droughts Using Geostatistic Method (Case Study: Southern Iran). Desert, 18; 79-87.
Nosrati, K., A. R. Zareiee, 2011. Assessment of meteorological drought using SPI in West Azarbaijan Province, Iran. Journal of Applied Sciences and Environmental Management, 15; 563-569.
Omidvar, K., M. Fatemi, M. Narangifard, K. Hatami Bahman Beiglou, 2016. A Study of the Circulation Patterns Affecting Drought and Wet Years in Central Iran. Advances in Meteorology,
doi.org/10.1155/2016/1843659.
Omidvar, K., M. Fatemi, M., Narangifard, K. Hatami Bahman Beiglou, 2016. Assess circulation pattern of drought periods using SPI (case study: central Iran). International Journal of Geo Science and Environmental Planning, 1, 31-43.
Park, S., J. Im, E., Jang, J. Rhee, 2016. Drought assessment and monitoring through blending of multi-sensor indices using machine learning approaches for different climate regions. Agricultural and Forest Meteorology, 216; 157-169. doi.org/10.1016/j.agrformet.2015.10.011.
Park, S., J. Im, S., Park, J. Rhee, 2017. Drought monitoring using high resolution soil moisture through multi-sensor satellite data fusion over the Korean peninsula. Agricultural and Forest Meteorology, 237; 257-269.
doi.org/10.1016/j.agrformet.2017.02.022.
Rasouli, A.A., M. Erfanian, B. SariSarraf, K, Javan. 2016. Comparative evaluation of TRMM estimated rainfall amounts and rainfall recorded by ground stations in Lake Urmia Basin. Journal of Geographic Space, 54; 195-217.
Raziei, T., B. Saghafian, A. A., Paulo, L. S., Pereira, I. Bordi, 2009. Spatial patterns and temporal variability of drought in western Iran. Water Resources Management, 23; 439-455.
Rhee, J., J. Im, G. J. Carbone, 2010. Monitoring agricultural drought for arid and humid regions using multi-sensor remote sensing data. Remote Sensing of Environment, 114; 2875-2887.
doi:10.1016/j.rse.2010.07.005.
Sadat Noori, S. M., K. Ebrahimi, A. M., Liaghat, A. H. Hoorfar, 2013. Comparison of different geostatistical methods to estimate groundwater level at different climatic periods. Water and Environment Journal, 27; 10-19.
Sahoo, A. K., J., Sheffield, M., Pan, E. F. Wood, 2015. Evaluation of the tropical rainfall measuring mission multi-satellite precipitation analysis (TMPA) for assessment of large-scale meteorological drought. Remote Sensing of Environment, 159; 181-193. doi.org/10.1016/j.rse.2014.11.032.
Salami, H., N. Shahnooshi, K. J. Thomson, 2009. The economic impacts of drought on the economy of Iran: An integration of linear programming and
macroeconometric modelling approaches. Ecological Economics, 68; 1032-1039.
doi.org/10.1016/j.ecolecon.2008.12.003.
Sayari, N., M. Bannayan, A. Alizadeh, A. Farid, 2013. Using drought indices to assess climate change impacts on drought conditions in the northeast of Iran (case study: Kashafrood basin). Meteorological Applications, 20; 115-127.
Shahabfar, A., A. Ghulam, J. Eitzinger, 2012. Drought monitoring in Iran using the perpendicular drought indices. International Journal of Applied Earth Observation and Geoinformation, 18; 119-127. DOI: 10.1016/j.jag.2012.01.011.
Shirvani, A., E. Fakhari Zade Shirazi, 2014. Comparison of ground based observation of precipitation with TRMM satellite estimations in Fars Province. Journal of Agricultural Meteorology, 2; 1-15.
Son, N. T., C. F. Chen, C. R. Chen, L. Y. Chang, V. Q. Minh, 2012. Monitoring agricultural drought in the Lower Mekong Basin using MODIS NDVI and land surface temperature data. International Journal of Applied Earth Observation and Geoinformation, 18; 417-427. doi.org/10.1016/j.jag.2012.03.014.
Su, Z., A. Yacob, J., Wen, G., Roerink, Y., He, B., Gao, C. Van Diepen, 2003. Assessing relative soil moisture with remote sensing data: theory, experimental validation, and application to drought monitoring over the North China Plain. Physics and Chemistry of the Earth, Parts A/B/C, 28; 89-101. doi:10.1016/S1474-7065(03)00010-X.
Varikoden, H., A. A. Samah, C. A. Babu, 2010. Spatial and temporal characteristics of rain intensity in the peninsular Malaysia using TRMM rain rate. Journal of hydrology, 387, 312-319.
doi:10.1016/j.jhydrol.2010.04.023
Werick, W. J., G. E. Willeke, N. B. Guttman, J. R. M., Hosking, J. R. Wallis, 1994. National drought atlas developed. Eos, Transactions American Geophysical Union, 75; 89-90.
Yaduvanshi, A., P. K. Srivastava, A. C. Pandey, 2015. Integrating TRMM and MODIS satellite with socio- economic vulnerability for monitoring drought risk over a tropical region of India. Physics and Chemistry of the Earth, Parts A/B/C, 83, 14-27. doi.org/10.1016/j.pce.2015.01.006.
Yousefi, Y., J. Masoompour Samakosh, 2014. Temporal-Spatial Variability of the Severest Dry Spells in the North-West of Iran. Desert, 19; 17-25. Zaitchik, B. F., J. P. Evans, R. A., Geerken, R. B. Smith, 2007. Climate and vegetation in the Middle East: interannual variability and drought feedbacks. Journal of Climate, 20; 3924-3941. DOI: 10.1175/JCLI4223.1.
Zargar, A., R. Sadiq, B., Naser, F. I. Khan, 2011. A review of drought indices. Environmental Reviews, 19; 333-349. doi:10.1139/A11-013.
Zhang, A., G. Jia, 2013. Monitoring meteorological
drought in semiarid regions using multi-sensor microwave remote sensing data. Remote Sensing of Environment, 134; 12-23.