Print ISSN: 2383-451X Online ISSN: 2383-4501 Web Page: https://jpoll.ut.ac.ir, Email: [email protected]
A Novel and an Efficient 3-D High Nitrogen Doped Graphene
Oxide Adsorbent for the Removal of Congo Red from Aqueous
Solutions
Zeraatkar Moghaddam, A.1*, Ghiamati, E.1, Pakar, R.1, Sabouri M. R.2 andGanjali, M. R.3,4
1. Department of Chemistry, Faculty of Sciences, University of Birjand, Birjand, Iran 2. Department of Chemistry, Faculty of Chemistry, Islamic Azad University,
North Tehran Branch, Tehran, Iran
3. Center of Excellence in Electrochemistry, School of Chemistry, College of Science, University of Tehran, Tehran, Iran
4. Biosensor Research Center, Endocrinology and Metabolism Molecular-Cellular Sciences Institute, Tehran University of Medical Sciences, Tehran, Iran
Received: 02.07.2018 Accepted: 13.10.2018
ABSTRACT
:
The current study both synthesizes and uses four compounds of graphene oxide (GO), nitrogen doped graphene oxide (ND-GO), high nitrogen doped graphene oxide (HND-GO), and three dimensional high nitrogen doped graphene oxide (3D-HND-GO) in order to remove a model anionic dye, Congo red (CR) from wastewaters. It also compares their carbon nano-structure, with regard to removal efficiency and finds out that 3D-HND-G yields higher efficiency in removal of CR, especially at lower pHs. This is due to its better dispersibility and greater surface area. Also, batch adsorption technique has been utilized and all involved parameters that affect the removal efficiency, e.g. initial pH, adsorbent dosage, initial CR concentration, and contact time are examined. The study applies Central Composite Design (CCD) to figure out their efficacies, with the results showing the following optimum conditions for removal of 100 ppm of CR: 4 mg/mL of the adsorbent, pH = 3, and 25 min of contact time. Furthermore, it studies the adsorption activity of the synthesized adsorbent, including kinetics, isotherm, and desorption comprehensibly. The adsorption isotherm is well-fitted through the Langmuir model, exhibiting high CR adsorption capacity. Also, CR adsorption kinetics shows that it has obeyed a pseudo-second-order kinetic model, indicating that adsorption has made the rate-limiting step. In addition, the proposed adsorbent has successfully been applied to reduce the concentration of CR as hazardous dye materials in the water and wastewater samples.Keywords: Carbon nanostructures; Treatment; Optimization; Isotherm; Kinetic.
INTRODUCTION
Textile, leather, pulp and paper, dyestuff, plastic, cosmetic, printing, food processing, and pharmaceutical industries use dyes to give color to their products and discharge a considerable amount of opalescent wastewaters into the environment (Pokhrel & Viraraghavan, 2004); therefore, there is a big
Corresponding Author, Email: [email protected]
et al., 1999). It is interesting to know that the yearly production of azo dyes around the globe has been assessed to be about 1 million tons with more than 2,000 fundamentally different azo dyes being presently in use (Vijaykumar et al., 2007). Diverse conventional methods, designed in treatment
of dyeing effluents, include
coagulation/flocculation (Zahrim et al., 2011), photodegradation (Wang, Q. et al., 2012), ion exchange (Liu et al., 2007), membrane filtration (Bouazizi et al., 2017), electrochemical treatment (Körbahti et al., 2011), biological treatment (Liu et al., 2017), and adsorption (Konicki et al., 2017). Unfortunately, most of these approaches are either economically unfavorable or technically complicated (Robinson et al., 2001). However, the latter (adsorption) is more often than not preferred as it uses cheaper, sustainable, and ecofriendly adsorbents, making it an appropriate and convenient method (Crini, 2006) that at the same time triggers the development of a large variety of non-conventional adsorbent materials (Mittal et al., 2009). There is still ongoing work on fabrication of low-cost adsorbents with high adsorption capacities which moves towards reduction of the adsorbent dose and minimization of disposal problems (Repo et al., 2013).
As a matter of fact, Graphene (G), a new class of carbon nanomaterials, has been used as a good start, thanks to its unique strict two-dimensional nanostructure that turns it into a superior adsorbent candidate for dye removal (Khurana et al., 2017). Recently, three-dimensional graphene oxide (3D–GO) nanostructures have been directly synthesized through chemical vapor deposition (CVD) to form a network of porous structures, capable of offering higher surface area, more electrical conductivity, and good mechanical properties (Li & Shi, 2012). Nonetheless, the main problem here is these materials' low dispersibility in aqueous media.
Nitrogen doping has played a critical
role in regulation of chemical properties of carbon materials. The reason can be sought in the comparable atomic size of nitrogen atom and its available five valence electrons to form strong valence bonds with carbon atoms. According to theoretical studies, nitrogen doping leads to a higher positive charge on a carbon atom adjacent to the nitrogen atoms (Gong et al., 2009) as well as a positive shift of Fermi energy at the apex of the Brillouin zone of G (Lee et al., 2009). In addition, the introduction of N groups into G nanoparticles improves the dispersibility of these materials in water, preventing any aggregation due to electrostatic repulsion, caused by N groups (Hu et al., 2010).
The present study dopes G
nanostructures with various amounts of nitrogen (N), focusing on introduction of three dimensional high nitrogen-doped graphene oxide (3D-HND-GO) as an adsorbent for CR dye removal procedures. For this purpose, N-doped GO nanosheets are synthesized with different percentages of N and are used to reduce the CR concentration in aqueous real samples. To the best of our knowledge, the current work is the first attempt to implement a 3D-HND-GO as a CR dye adsorbent. CCD and RSM have been utilized to optimize the effect of involved experimental parameters on dye removal, with isotherm and kinetics studies conducted under the defined optimum conditions. Finally, the optimized procedure has been employed to reduce the CR contaminants in water and wastewater samples.
MATERIALS AND METHODS
transform infrared (FT-IR) spectra were acquired, using a Bomem MB-Series FT-IR spectrometer, with the samples prepared in form of KBr pellets. The X-ray diffraction (XRD) patterns were collected on STOE STADI P with scintillation detector, secondary monochromator, and Cu-Ka1 radiation (λ =1. 5406 Å). X-ray photoelectron spectroscopy (XPS) analysis was carried out, using a Gamma data-scienta ESCA 200 hemispherical analyzer, equipped with an Al Ka (1486.6 eV) X-ray source. Raman spectra of nanostructures were recorded on a Bruker SENTERR (2009) with an excitation beam of 785 nm laser diode. Scanning electron microscope (SEM) image of 3D-HND-G was obtained on a Hitachi S-4160 SEM. Transmission electron microscope (TEM) images of ND-G, HND-ND-G, and 3D-HND-G nanostructures were taken by means of Philips CM-30 transmission electron microscope with an accelerating voltage of 150 kV and Zeiss EM10C, voltage of 80 kV. The CHNS analyses were conducted on a Thermo Finnigan Flash EA112 Elemental Analyzer (Okehampton, UK). Ultrasonic bath (Eurosonic 4D ultrasonic cleaner with a frequency of 50 kHz and an output power of 350 W) was used to disperse the materials in aqueous samples, with UV-Vis spectrophotometer (Specord 210 Plus, Analytik Jena, Germany), employed to determine the CR concentration.
The pH of the aqueous dispersion of GO (70 mL, 140 mg) was set at 10, using a 30% solution of ammonia with 2 mL of hydrazine hydrate added while getting magnetically stirred for 10 min. The solution was then transferred into a Teflon-lined autoclave and got heated in oven at 80ºC for 3 h. The reduced G sheets were collected via centrifugation, followed by washing several times with deionized water so that they could get dried in vacuum oven at 50°C (Movahed et al., 2014). GO was prepared as described in the literature (Long et al., 2010).
An aqueous dispersion solution of GO (10 mL, 40 mg) was diluted with 25 mL of deionized water, to which 12 g of urea was added, and got sonicated for 3 h. Afterwards, the solution was sealed in a 50 mL Teflon-lined autoclave, maintaining its temperature at 180ºC for 12 h. The solid (N-doped graphene sheets) was filtered and washed several times with distilled water. Finally, the sample was collected and dried in a vacuum oven at 80ºC (Movahed et al., 2014).
GO dispersion (90 mg, 30 mL) was mixed uniformly with 120 µL of EDA and sonicated for 5 min. The resulting stable suspension got transferred into a 50 mL Teflon-lined autoclave and heated in oven for 6 h at 120°C, following freeze-drying (Movahed et al., 2014).
CR adsorption on the proposed adsorbent was studied in the batch mode and the effect of different parameters, including adsorbent dose (1-5 mg/mL), initial pH (3-10.5), initial CR concentration (25-125 ppm), temperature (25oC), and contact time (10-30 min), were assessed. In a typical experiment, a desired amount of adsorbent was added to a tube, containing 10 mL of CR solution (50 ppm). The initial pH of the CR solutions was set at 3 by adding 0.01-M HCl or NaOH solutions. Then, the solution was stirred for 20 min at 500 rpm. Finally, the suspensions got separated for later analysis of dye concentration.
To investigate the isotherms, the experiments were carried out by varying the initial CR concentration (25-125 ppm), while the other parameters were at their optimum values. The kinetic experiments were conducted at an initial dye concentration of 100 ppm by changing the contact time (0-30 min) under the optimum condition.
The removal efficiency and adsorption capacity values at equilibrium and t time (qe and qt mg/g) were calculated, using the following equations:
o e100 o C C Removal Efficiency %
( ) ( ) ,
o e o t
e t
C C V C C V
q q
m m (2)
where Co, Ce, and Ct (mg/L) are the CR dye concentrations at initial, equilibrium, and t time, respectively; V (L), the solution volume; and m (g), the mass of used adsorbent. The CR dye concentrations (C) were obtained by Beer's law, in which the plot of absorbance at λmax=464 nm versus concentration was linear.
Desorption studies were also conducted in the batch mode. Similar to adsorption studies, optimum amount of dry adsorbent (3D-HND-GO)) was added to 10 mL of CR solution (100 ppm). After 24 h, at room temperature, the saturated CR-loaded adsorbent was magnetically collected and washed with distilled water in order to remove the unadsorbed traces of CR. Afterwards, the adsorbent was agitated with 10 mL of 0.05-M HNO3 or 0.1-M HCl for 24 h, following the adsorbent separation from the eluent through centrifugation. It was then washed with water several times for the purpose of reusing as well as excessive acidity/alkalinity removal. Finally, the adsorbent was dried at 60oC for 12 h. In order to test the reusability of the adsorbent, the adsorption–desorption cycle was repeated several times with the same adsorbent.
In order to obtain maximum removal efficiency of CR dye, the parameters affecting the adsorption procedure like initial pH, initial CR concentration, adsorbent dosage, and contact time were optimized. Also, according to preliminary experiments, the temperature and the rate at which the solution was stirred was adjusted at 25oC and 500 rpm, respectively. Initially, the effect of adsorbent nature on extraction efficiency was evaluated at different pHs. Then, the influence of other parameters (initial pH, initial CR concentration, adsorbent dosage, and contact time) got evaluated by CCD. The experimental design matrix and data
analysis were performed with a statistical computer package of ―Design Expert 9.0.0‖, the trial version (Stat-Ease Inc., Minneapolis, MN, USA).
RESULTS AND DISCUSSIONS
and the enhanced degree of disorder (Hu et al., 2013).
As shown in Fig. S2, the TEM image revealed a developed graphitic structure in these folded and crumpled regions, which may contribute to enhancement of their mechanical properties.
Fig. S3 displays the XRD patterns of GO, ND-G, HND-G, and 3D-HND-G. The diffraction peak, located at 2Ɵ = 10.1o, was attributed to the (002) crystalline plane of GO and the corresponding calculated interlayer spacing was about 0.79 nm. However, the peak at 2Ɵ = 10.1o disappeared entirely after hydrothermal reaction, and a broad diffraction peak around 25o of the graphite (002) plane was observed for the synthesized ND-G, HND-G and 3D-HND-HND-G samples, indicating that the framework of the reduced sample was composed of few-layer stacked G nanosheets (Sun et al., 2012).
Fig. S4 shows FT-IR spectra of ND-G, HND-G, and 3D-HND-G. The peak intensity of carbonyl (C=O) at 1722 cm-1 of 3D-HND-G obviously descends, compared with that of GO. Moreover, the peak of epoxy C–O–C at 1226 cm-1 almost disappeared in 3D-HNG, implying the efficient reduction of GO along with subsequent assembly of G sheets into 3D structures (Wang, J. et al., 2012). A new peak was certainly identified at about 1550 cm-1, which can be assigned to sp2 bonded C=N, demonstrating the formation of the C–N bond in generation of 3D-HND-G, HND-G and ND-G (Wu et al., 2012).
Since XPS is an effective way of identifying the states of elements, the nitrogen-doping effect in G was probed, as
shown in Fig. S5. The peaks,
corresponding to C 1s, N 1s, and O 1s could clearly be observed in the XPS survey spectra. Regarding the N 1s XPS scan, three different types of nitrogen are present in ND-G, HND-G, and 3D-HND-G systems: N-pyridinic (N1, 398 eV) assists the p-conjugated system with a p-electron
in the G layers; N-pyrrolic (N2, 399 eV) refers to the N atom, contributing two π-electrons to the π system, ascribed to the share of pyridine and pyrrol functionalities, respectively; and N-quaternary (N3, 401 eV) is derived from the N atoms that replace the C atoms in a grapheme hexagonal ring (Sun et al., 2012).
In order to further confirm the synthesis of these carbon nano-structures and compare the amounts of existing N in their structures, the atomic percentage of carbon, hydrogen, and nitrogen was monitored, using CHNS analysis. Table S1 gives the weight percentages of N, C, and H as well as the N/C ratio of the composites. Here, the atomic percentage of N was 3.19%, 11.24%, and 17.44% for ND-G, HND-G, and 3D-HND-G, respectively, which proves the successful synthesis of the mentioned nanostructures.
The preliminary experiments were done to compare the synthesized GO, ND-G, HND-G, and 3D-HND-G for adsorption of CR dye. As can be seen from Fig. 1, the CR absorbance of the solution, treated with 3D-HND-G, was the lowest, confirming higher adsorption of dye onto the 3D-HND-G surface.
Fig. 1. Comparison of the capability of the synthesized adsorbent in removal of CR dye (pH = 7, dose = 1.5 mg/mL, initial concentration = 50 ppm, and contact time = 20 min). The UV-Vis spectrums were acquired after dilutions.
by CCD, probed the parameters' effects on CR removal efficiency as response, contributed to creation of a surface. The graphical relation among these parameters and the removal efficiency was obtained mathematically. Finally, analysis of variance (ANOVA) was applied to evaluate the model and analyze the data.
Due to the meager number of involved parameters, there was no need for screening them by factorial design, thus CCD, first presented by Box and Wilson (Deming & Morgan, 1993), was used directly. In CCD, for the f number of parameters, the number of needed design points (N) can be obtained via Eq. 3:
f
0
N2 2f N (3)
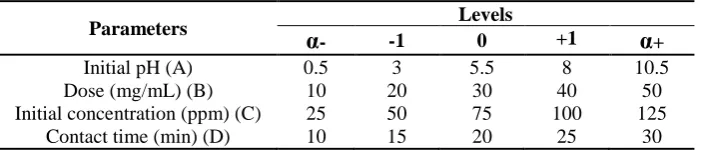
Therefore, 36 runs of CCD-designed experiments were conducted, all randomized in three blocks. The appropriate ranges for the parameters were defined, as shown in Table 1, and the experiments were carried out based on the design matrix, presented by software. Their subsequent analysis with ANOVA and
CCD program gave second-order
polynomial function as below:
2
2 2
Removal % 7.29 0.72A 0.84B 0.70C
0.19D 0.31AB 0.35A 0.28C
(4)
It is noteworthy that the response values were transformed to square root values for CR removal efficiency (not shown) according to the Box-Cox plot.
Table 1. The experimental variables and levels of CCD
Parameters Levels
α- -1 0 +1 α+
Initial pH (A) 0.5 3 5.5 8 10.5
Dose (mg/mL) (B) 10 20 30 40 50
Initial concentration (ppm) (C) 25 50 75 100 125
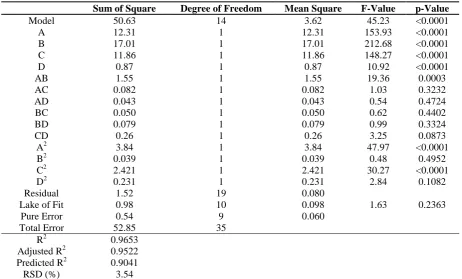
In Eq. 4, the positive values, corresponding to each term, indicate their positive effect on the response; consequently, their negative values imply a decrease in the response, which occur once their values are raised. ANOVA is a statistical method that partitions the total variation into its components, while each term has different source of variation. The interaction effects are easily estimated via ANOVA. Here, the ANOVA results, regarding CR removal efficiency (Table 2), were based on calculations pertinent to sum of the squares, applied in order to find the affected parameters, Fisher's F-ratios, and P-values. The model's F-value, equal to 45.23, conveyed its statistical importance, revealing that due to noise, there was only 0.01% chance for ―model F-value‖ to happen. The non-significant value of lack of fit (more than 0.05) represented validity of quadratic model for explanation of experimental data. The linear effects of all parameters were significant, as the interaction term of AB and quadratic terms of A2 and C2 were, too.
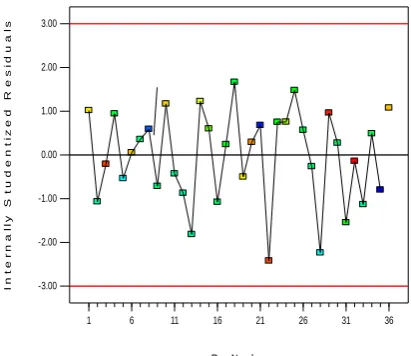
According to Table 2, the R2 value of the model was quite high for CR removal (equal to 0.9653), proving the agreement between the experimental and predicted outcomes. The predicted R2 value was 0.9041, consisting with the adjusted R2 value of 0.9522. The normal probability of the residuals (Fig. 2) showed that almost no serious violation of the assumptions underlying the analyses existed. Satisfactory normal distribution of the results confirmed the assumptions' normality as well as the independence of the residuals made earlier. The results that correspond to plotting residual values versus the number of experiments (Fig. 3) exhibit random distribution of the residual values around zero, proving the selected model's accuracy. The ‗adequate precision‘ as a criterion of signal to noise ratio that stands above 4 emphasizes the efficiency and suitability of method for a good representation of experimental data. In this case, the value of 22.72 expressed the existence of an adequate signal, confirming the applicability of the model, used in a navigation of the design space.
Table 2. ANOVA table for removal efficiency of CR by 3D-HND-GO
Sum of Square Degree of Freedom Mean Square F-Value p-Value
Model 50.63 14 3.62 45.23 <0.0001
A 12.31 1 12.31 153.93 <0.0001
B 17.01 1 17.01 212.68 <0.0001
C 11.86 1 11.86 148.27 <0.0001
D 0.87 1 0.87 10.92 <0.0001
AB 1.55 1 1.55 19.36 0.0003
AC 0.082 1 0.082 1.03 0.3232
AD 0.043 1 0.043 0.54 0.4724
BC 0.050 1 0.050 0.62 0.4402
BD 0.079 1 0.079 0.99 0.3324
CD 0.26 1 0.26 3.25 0.0873
A2 3.84 1 3.84 47.97 <0.0001
B2 0.039 1 0.039 0.48 0.4952
C2 2.421 1 2.421 30.27 <0.0001
D2 0.231 1 0.231 2.84 0.1082
Residual 1.52 19 0.080
Lake of Fit 0.98 10 0.098 1.63 0.2363
Pure Error 0.54 9 0.060
Total Error 52.85 35
R2 0.9653
Adjusted R2 0.9522 Predicted R2 0.9041
Fig. 2. Normal probability plot of residual for CR removal efficiency
Fig. 3. Residual values versus the number of experiments
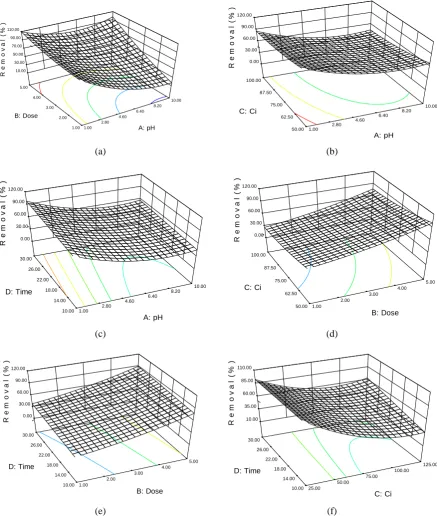
Three-dimensional plots of the model are highly recommended for investigating the nature of the interactions as well as visualizing the relation between the responses and the examined effective parameters. Fig. 4 shows the plots of the response model versus two experimental factors at fixed values of other factors in their central levels. Fig. 4a represents the effect of solution's pH and adsorbent dosage, clearly illustrating that the adsorbent dosage had positive effects on CR removal, whereas the removal efficiency mounted as pH of the sample solution declined (also Fig. 4b and c). The optimum pH for removal of CR turned out to be 3, owing to precipitation of the model dye at lower pH. An increase in the adsorption process, detected at low pH values (up to 3), could be attributed to positive charge of the adsorbent; however, by raising the solution's pH, the electrostatic interactions of CR and adsorbent could descend, leading to a significant reduction in removal percentage. As can be seen in Fig. 4a, the lines were not parallel, indicating that there was an interaction between adsorbent dosage and sample pH. Fig. 4b demonstrates the response surface plot for the effect of sample pH and initial concentration on the removal efficiency. It shows that when the initial concentration was decreasing, the
removal efficiency would rise. In this case, there was no interaction between pH and initial concentration in the adsorptive removal of CR by 3D-HND-G. As it is obvious in Fig. 4c, e, and f, the removal efficiency was enhanced by increasing the contact time, hence the absence of any interaction among these factors. Similarly, there was no interaction between the adsorbent dosage and contact time (Fig. 4e). The trends in Fig. 4d, and 4f show that there was no interaction between adsorbent dosage and initial concentration as well as between contact time and initial concentration.
The main objective of optimization was to find optimum values of effective parameters for maximizing the CR removal efficiency onto 3D-HND-G from the obtained model. This was carried out using the trial version of Design-Expert 8.0.0 software. According to the non-linear optimization method, the optimum values of the parameters, i.e., sample pH, adsorbent dosage, and contact time, turned out to be 3, 4 mg/mL, and 25 min, respectively, enough to achieve maximum values of removal efficiency for initial CR concentrations of 100 ppm. With a 95% confidence level, the optimum predicted response was found to be 95.8±3.2%. This was verified by performing the
Design-Expert® Sof tware Sqrt(Remov al (%))
Color points by v alue of Sqrt(Remov al (%)):
10.01 5.3479 Residual N o r m a l % P r o b a b il it y
Normal Plot of Residuals
-3.00 -2.00 -1.00 0.00 1.00 2.00 3.00 1 5 10 20 30 50 70 80 90 95 99
Design-Expert® Sof tware Sqrt(Remov al (%))
Color points by v alue of Sqrt(Remov al (%)):
10.01 5.3479 Run Number I n t e r n a l l y S t u d e n t i z e d R e s i d u a l s
Residuals vs. Run
-3.00 -2.00 -1.00 0.00 1.00 2.00 3.00
experiments under optimized conditions, wherein the experimental MO removal efficiency was found to be 93.5±5.7%,
being in a close agreement with the CCD model predictions.
(a) (b)
(c) (d)
(e) (f)
Fig. 4. The response surface plots of the sample pH's effect, adsorbent dose, initial dye concentration, and contact time: (a) Sample pH (A) – Adsorbent dose (B); (b) Sample pH (A) – Initial dye concentration (C); (c) Sample pH (A) – Contact time (D); (d) Adsorbent dose (B) – Initial dye concentration (C); (e) Adsorbent dose (B) – Contact time (D); and (f) Initial dye concentration (C) – Contact time (D).
Design-Expert® Sof tware Remov al (%)
100.2
28.6 X1 = A: pH X2 = B: Dose Actual Factors C: Ci = 75.00 D: Time = 20.00
1.00 2.80 4.60 6.40 8.20 10.00 1.00 2.00 3.00 4.00 5.00 10.00 30.00 50.00 70.00 90.00 110.00 R e m o v a l ( % ) A: pH B: Dose
Design-Expert® Sof tware Remov al (%)
100.2
28.6 X1 = A: pH X2 = C: Ci Actual Factors B: Dose = 3.00 D: Time = 20.00
1.00 2.80 4.60 6.40 8.20 10.00 50.00 62.50 75.00 87.50 100.00 0.00 30.00 60.00 90.00 120.00 R e m o v a l ( % ) A: pH C: Ci
Design-Expert® Sof tware Remov al (%)
100.2
28.6
X1 = A: pH X2 = D: Time Actual Factors B: Dose = 3.00 C: Ci = 75.00
1.00
2.80 4.60
6.40 8.20 10.00 10.00 14.00 18.00 22.00 26.00 30.00 0.00 30.00 60.00 90.00 120.00 R e m o v a l ( % ) A: pH D: Time
Design-Expert® Sof tware Remov al (%)
100.2
28.6
X1 = B: Dose X2 = C: Ci Actual Factors A: pH = 5.50 D: Time = 20.00
1.00 2.00 3.00 4.00 5.00 50.00 62.50 75.00 87.50 100.00 0.00 30.00 60.00 90.00 120.00 R e m o v a l ( % ) B: Dose C: Ci
Design-Expert® Sof tware Remov al (%)
100.2
28.6
X1 = B: Dose X2 = D: Time Actual Factors A: pH = 5.50 C: Ci = 75.00
1.00 2.00 3.00 4.00 5.00 10.00 14.00 18.00 22.00 26.00 30.00 0.00 30.00 60.00 90.00 120.00 R e m o v a l ( % ) B: Dose D: Time
Design-Expert® Sof tware Remov al (%)
100.2
28.6
X1 = C: Ci X2 = D: Time Actual Factors A: pH = 5.50 B: Dose = 3.00
Isotherm Studies
For isotherm studies, the well-known Langmuir and Freundlich isotherm models were employed so as to simulate the experiment data. Fig. 5 shows the adsorption isotherms of CR on 3D-HND-G at different temperatures along with the impact of CR initial concentrations on the adsorption at 25oC, as well. Here, the adsorption capacity of 3D-HND-G improved substantially, reaching a plateau trend. It means that at sufficiently high initial CR concentrations (>125 ppm), 3D-HND-G could be saturated by CR molecules. Our results showed that at equilibrium, the capacity of CR adsorbed rose from 1.2 to 23.3 mg/g through increasing the initial CR concentration from 5 to 150 ppm.
Fig. 5. The isotherm curve for adsorption of CR
Due to an increase in the initial CR concentration of the solution, there exists a driving force to overcome the mass transfer resistance of the CR between the aqueous and solid phases, causing the transfer of CR molecules from bulk solution to 3D-HND-G surface occur more easily. For the
adsorption systems, the experimental data could be well-fitted on linear Langmuir isotherm:
e e
e L m m
C 1 C
q K q q (5)
where qm stands for the maximum monolayer capacity of adsorbent (mg/g) and KL, the Langmuir adsorption constant (L/mg) related to the adsorption free energy. The well-known logarithmic form of the Freundlich isotherm is given by the following equation:
e
F
e1
ln q ln K ln C
n
(6)
where KF (L/mg) and n are Freundlich constants. KF represents the adsorption capacity of the adsorbent and n indicates how favorable the adsorption process is. Values of 2 < n < 10, 1 < n <2 and <1 show good, difficult, and poor adsorption characteristics, respectively. In the examined cases, the value of n ranged between 2 and 10 (Table 3), exhibiting good adsorption characteristics. Fig. 5 illustrates the adsorption isotherms of CR on the 3D-HND-G.
The isotherm constants and correlation coefficients for linear Langmuir and Freundlich equations are listed in Table 3. The regression coefficient (R2> 0.99) values, as obtained by linearized isotherms, demonstrate better experimental data fitting towards the Langmuir isotherm. This suggests that once a CR molecule occupies homogeneous sites within the adsorbent surface, the adsorption is completed and, as consequence, a monolayer of CR can be formed.
From Langmuir adsorption isotherms, the maximum adsorption capacity of the
Table 3. Langmuir and Freundlich parameters for the adsorption of CR onto 3D-HND-GO at different
temperatures
T (K) Langmuir constants Freundlich constants
qm b RL R2 n Kf R2
3D-HND-G for CR was estimated and turned out to be 23.8 mg/g. It could be concluded that at the pertinent temperature range, raising the temperature had no significant effect on the adsorption of CR on 3D-HND-G.
Moreover, the degree of adsorbent's suitability towards CR was evaluated from the values of separation factor constant (RL), calculated from the following equation:
L
L 0 1 R
1 K C
(7)
In which KL is the Langmuir isotherm constant (L/mg), and Co, the initial dye concentration (ppm). According to the literature, the adsorption of CR on 3D-HND-G is unfavorable if RL> 1, linear if RL = 1, favorable if 0 < RL < 1, and irreversible if RL = 0. In our case, the RL value was 0.84 (see Table 3), implying that the adsorption of the CR on 3D-HND-G had occurred favorably.
In order to determine the kinetic parameters of CR adsorption on the 3D-HND-GO, the kinetic models, including the pseudo-first-order, pseudo-second-order, and Weber and Morris, were applied to fit the experimental data with Table 4 listing calculated results of the fits. The equation of Lagergren, based on solid capacity, was used as the pseudo-first order kinetic model:
e t
e 1ln q q lnq k t (8)
where k1 is pseudo-first order rate constant, the value of which could be calculated from the slope of the linear plot of ln (qe‒ qt) versus time.
The experimental data were also tested by pseudo-second order kinetic model, whose linear form is shown as Eq. (9).
2
t 2 e e
t 1 t
q k q q (9)
In which k2 (g/mg.min) represents the second-order rate constant. The plot of t/qt versus t gives a straight-line with a slope of 1/qe with an intercept of 1=k2qe2 (Fig. 6). The given function provides the rate constant k2, while defining the amount of CR, adsorbed at equilibrium qe,cal, also.
According to Fig. 6 along with the regression coefficient values (R2> 0.9990) in Table 4, it can be clearly seen that CR adsorption data on the 3D-HND-G were successfully described by pseudo-second order model.
To test the diffusion mechanism between CR molecule and 3D-HND-G, an intra-particle diffusion model, proposed by Weber and Morris, was employed and the adsorbed amount was given by Eq. (10) (Weber & Morris, 1962):
0.5
t id
q K t C (10)
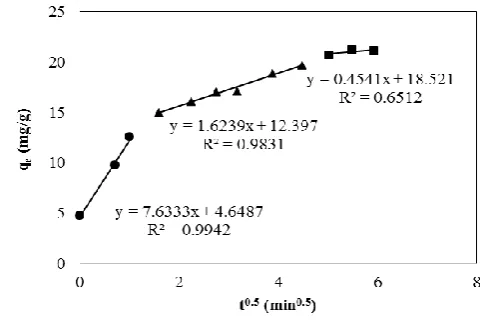
where C is the value of intercept. The ki (mg.min0.5/g) is intra-particle diffusion rate constant, and could be obtained from the slope of the straight line of qt versus t0.5, as shown in Fig. 7. For a solid–liquid
adsorption process, the solute transfer is usually characterized by external mass transfer (boundary layer diffusion), intra-particle diffusion, or both. Transport of the adsorbate includes the following steps: i) from bulk solution through liquid film to the external surface of the adsorbent (film diffusion), ii) within the pores of the adsorbent (intra-particle diffusion), and iii)
chemical reaction via ion-exchange or the adsorption of adsorbate at an active site on the surface of adsorbent (pore diffusion).
Table 4. Kinetics parameters for adsorption of CR onto 3D-HND-G
Time range (min)
C0
(ppm) Pseudo-first-order Pseudo-second-order
qe (mg/g) k1 (1/min) R2 qe (mg/g) k2 (1/min) R2
Fig. 6. The linear plot of (a) pseudo-first-order and (b) pseudo-second-order models for adsorption CR on 3D-HND-G
Fig. 7. Intra-particle diffusion kinetic model fit for the adsorption of CR on 3D-HND-GO
The experimental data exhibited multi-linear plots, i.e. four steps could affect the sorption process (Fig. 7). In the first stage, instantaneous adsorption led to sharper portion in the graph. In this stage, the intra-particle diffusion was not the only rate controlling step but some other processes like boundary layer adsorption may have also been involved in controlling the rate of adsorption. With an increase in CR concentration, the line slope increased, thus demonstrating that with high CR concentrations a multitude of CR molecules would interact with active sites on adsorbent (high adsorption intensity).
When all of exterior active sites were occupied, CR molecules sought to enter into the adsorbents' pores. Furthermore, the
adsorption gradually slowed down, as shown by second and third linear portion of the curves, and as described above, the intra-particle diffusion was also involved in the adsorption process. Finally, the curves corresponding to different concentrations refer to arrival at the final equilibrium stage, wherein the intra-particles diffusion did slow down, thanks to extremely low CR concentration in the solution.
surface. Furthermore, ki grew rapidly with enhancement of CR concentration in the solution.
As can be observed from Fig. 7, the intercept (4.64, 12.40, and 18.52) increased the time dependently, showing an increase in the boundary layer diffusion due to the fact that CR molecules entered into the adsorbent's pores. Consequently, the mechanism of CR adsorption over the surface of 3D-HND-G was convoluted, hence both the surface adsorption and intra particle diffusion contributed to the actual adsorption process.
CONCLUSIONS
The present study demonstrated the application of 3D-HND-G nanoparticles as a CR dye adsorbent, being a pioneer with this regard. By comparing these carbon nanostructures, i.e., G, GO, ND-G, HND-G, and 3D-HND-G, it found out that there were two main factors for improvement of dye removal efficiency, namely the structure and surface area of the sorbent, on one hand, and the percentage of N in the sorbent's structure, on the other. Thus, following the combination of the advantages of a well-defined 3D structure and doped nitrogen atoms, the obtained 3D-HND-G exhibited high efficiency for removal of CR molecules. Not only was the 3D structure with larger surface area and higher percentage of N able to increase the adsorption ability of the target analytes, but it improved the dispersibility of these nanocarbons in aqueous media, also. What is more, in order to maximize the removal efficiency, the statistical experimental design methodology was employed for optimization of CR dye adsorption. It was concluded that the initial concentration of CR had a negative effect on the response (removal efficiency), though the effects of adsorbent dosage and contact time were positive. A quadratic model was proposed by CCD which was in good agreement with the experimental data. Finally, the results showed that 3D-HND-G was strongly potential to become a new
adsorbent for future pollutant removal technologies.
ACKNOWLEDGMENT
We would like to thank Research Council, University of Birjand for their financial supports in conducting the present study.
REFERENCES
Bouazizi, A., Breida, M., Achiou, B., Ouammou, M., Calvo, J. I., Aaddane, A. and Younssi, S. A. (2017). Removal of dyes by a new nano–TiO2 ultrafiltration membrane deposited on low-cost support prepared from natural Moroccan bentonite. Appl. Clay Sci. 149: 127-135.
Crini, G. (2006). Non-conventional low-cost adsorbents for dye removal: a review. Bioresour. Technol. 97(9), 1061-1085.
Deming, S. N. and Morgan, S. L. (1993). Experimental design: a chemometric approach. Elsevier.
Deng, D., Pan, X., Yu, L., Cui, Y., Jiang, Y., Qi, J., Li, W. X., Fu, Q., Ma, X. and Xue, Q. (2011). Toward N-doped graphene via solvothermal synthesis. Chem. Mater. 23(5); 1188-1193.
Fu, X., Bei, F., Wang, X., O'Brien, S. and Lombardi, J. R. (2010). Excitation profile of surface-enhanced Raman scattering in graphene– metal nanoparticle based derivatives. Nanoscale 2(8): 1461-1466.
Gong, K., Du, F., Xia, Z., Durstock, M. and Dai, L. (2009). Nitrogen-doped carbon nanotube arrays with high electrocatalytic activity for oxygen reduction. Sci. 323(5915): 760-764.
Hu, S., Wang, A., Li, X. and Löwe, H. (2010). Hydrothermal synthesis of well-dispersed ultrafine N-doped TiO2 nanoparticles with enhanced photocatalytic activity under visible light. J. Phys. Chem. Solids 71(3): 156-162.
Jorio, A., Dresselhaus, M., Saito, R. and Dresselhaus, G. (2011). Raman Spectroscopy in Graphene Related Systems, Swiley. VCH, Weinheim.
Khurana, I., Saxena, A., Khurana, J. M. and Rai, P. K. (2017). Removal of Dyes Using Graphene-Based Composites: a Review. Water Air Soil Pollut. 228(5): 180-197.
Konicki, W., Hełminiak, A., Arabczyk, W. and Mijowska, E. (2017). Removal of anionic dyes using magnetic Fe@ graphite core-shell nanocomposite as an adsorbent from aqueous solutions. J. Coll. Interf. Sci. 497: 155-164.
Pollution is licensed under a "Creative Commons Attribution 4.0 International (CC-BY 4.0)" dyes and removal of metal ions from textile dye and
metal ion binary mixtures. Chem. Eng. J. 173(3): 677-688.
Lee, S. U., Belosludov, R. V., Mizuseki, H. and Kawazoe, Y. (2009). Designing Nanogadgetry for Nanoelectronic Devices with Nitrogen‐Doped Capped Carbon Nanotubes. Small 5(15): 1769-1775.
Liu, C. H., Wu, J. S., Chiu, H. C., Suen, S. Y. and Chu, K. H. (2007). Removal of anionic reactive dyes from water using anion exchange membranes as adsorbers. Water Res. 41(7): 1491-1500.
Liu, C., You, Y., Zhao, R., Sun, D., Zhang, P., Jiang, J., Zhu, A. and Liu, W. (2017). Biosurfactant production from Pseudomonas taiwanensis L1011 and its application in accelerating the chemical and biological decolorization of azo dyes. Ecotox. Environ. Safe. 145: 8-15.
Long, D., Li, W., Ling, L., Miyawaki, J., Mochida, I. and Yoon, S. H. (2010). Preparation of nitrogen-doped graphene sheets by a combined chemical and hydrothermal reduction of graphene oxide. Langmuir 26(20): 16096-16102.
Mittal, A., Mittal, J., Malviya, A. and Gupta, V. (2009). Adsorptive removal of hazardous anionic dye ―Congo red‖ from wastewater using waste materials and recovery by desorption. J. Coll. Interf. Sci. 340(1): 16-26.
Montgomery, D. C. (2017). Design and analysis of experiments. John Wiley & Sons.
Movahed, S.K., Dabiri, M. and Bazgir, A. (2014). Palladium nanoparticle decorated high nitrogen-doped graphene with high catalytic activity for Suzuki– Miyaura and Ullmann-type coupling reactions in aqueous media. Appl. Catal. A 488: 265-274.
O‘Neill, C., Hawkes, F. R., Hawkes, D. L., Lourenço, N. D., Pinheiro, H. M. and Delée, W. (1999). Colour in textile effluents–sources, measurement, discharge consents and simulation: a review. J. Chem. Technol. Biotechnol. 74(11): 1009-1018.
Pokhrel, D. and Viraraghavan, T. (2004). Treatment of pulp and paper mill wastewater—a review. Sci. Total Environ. 333(1): 37-58.
Repo, E., Warchoł, J. K., Bhatnagar, A., Mudhoo, A. and Sillanpää, M. (2013). Aminopolycarboxylic
acid functionalized adsorbents for heavy metals removal from water. Water Res. 47(14): 4812-4832. Robinson, T., McMullan, G., Marchant, R. and Nigam, P. (2001). Remediation of dyes in textile effluent: a critical review on current treatment technologies with a proposed alternative. Bioresour. Technol. 77(3): 247-255.
Sun, L., Wang, L., Tian, C., Tan, T., Xie, Y., Shi, K., Li, M. and Fu, H. (2012). Nitrogen-doped graphene with high nitrogen level via a one-step hydrothermal reaction of graphene oxide with urea for superior capacitive energy storage. RSC Adv. 2(10): 4498-4506.
Vijaykumar, M., Vaishampayan, P.A., Shouche, Y.S. and Karegoudar, T. (2007). Decolourization of naphthalene-containing sulfonated azo dyes by Kerstersia sp. strain VKY1. Enzyme Microb. Technol. 40(2): 204-211.
Wang, J., Shi, Z., Fan, J., Ge, Y., Yin, J. and Hu, G. (2012). Self-assembly of graphene into three-dimensional structures promoted by natural phenolic acids. J. Mater. Chem. 22(42): 22459-22466.
Wang, Q., Gao, D., Gao, C., Wei, Q., Cai, Y., Xu, J., Liu, X. and Xu, Y. (2012). Removal of a Cationic Dye by Adsorption/Photodegradation Using Electrospun PAN/O-MMT Composite Nanofibrous Membranes Coated with TiO2. Int. J. Photoenergy 2012: 680419–680426.
Weber, W. and Morris, J. (1962). Removal of biologically-resistant pollutants from waste waters by adsorption. Advances in water pollution research. 2: 231-266.
Wu, P., Qian, Y., Du, P., Zhang, H. and Cai, C. (2012). Facile synthesis of nitrogen-doped graphene for measuring the releasing process of hydrogen peroxide from living cells. J. Mater. Chem. 22(13): 6402-6412.
Yang, Z. Y., Zhang, Y. X., Jing, L., Zhao, Y. F., Yan, Y. M. and Sun, K. N. (2014). Beanpod-shaped Fe–C– N composite as promising ORR catalyst for fuel cells operated in neutral media. J. Mater. Chem. A 2(8): 2623-2627.