Journal of Pharmaceutical Tehnology
Research and Management
Journal homepage: https://jptrm.chitkara.edu.in/
1. Introduction
Axitinib is tyrosine kinase Inhibiter and an oral, selective inhibitor of vascular endothelial growth factor receptors 1, 2, and 3 (Pithavala et al., 2012; Lakshmi et al., 2012). It is a small molecule developed by Pfizer. Axitinib is an indazole derivative, chemically it is N-Methyl-2 [[3-[(e) -2-pyridin-2-ylethyl-1H-indazole-6-yl]sulfanyl]benzamide. The molecular formula of Axitinib is C22H18N4OS and molecular weight is 386.46 gm/mol(Chandra and Sarada, 2016; Wilmes et al., 2007). It specifically restrains vascular endothelial development factor receptors (VEGFR-1, VEGFR-2, VEGFR-3); tumour development and metastases.1,2 Axitinib has been accounted to be 50-450 times more potent than first generation VEGFR inhibitors(Bouchet et al., 2011).
In Literature studies, few analytical methods for assessment of Axitinib have been studied, which includes liquid chromatography-mass spectrophotometry (LC-MS/ MS)(Lankheet et al., 2013; Sparidans et al., 2009; Gorja
and Sumantha, 2017), UPLC(Chakravarthy et al., 2016), spectrophotometric(Panda et al., 2016) and HPLC (Chandra and Sarada, 2016; ICH, 2005). To our knowledge, till date no HPLC method has been reported for the assurance of Axitinib in bulk and in-house tablet dosage form. Therefore, an attempt of proposed work is toestablish a simple, reliable and reproducible RP-HPLC method for determination of Axitinib in bulk and in-house tablet dosage form. Also, an established method wasvalidated in accordance with ICH guidelines Q2(B).
2. Experimental
2.1
Chemicals and Reagents
The materials and reagents used during the analysis, Axitinib were gotten as a gift sample from Glenmark Pharmaceutical Ltd, Mumbai, India, methanol (HPLC grade)were obtained from Merck Ltd Mumbai. Milli-Q distilled water was utilized.
Exploring RP-HPLC Method for analysis of Axitinib in Bulk and
in-house
Tablets
Shailesh S Chalikwar1, Satish D Kayande1, Inderbir Singh2 and Atul A Shirkhedkar1*
1 R.C. Patel Institute of Pharmaceutical Education and Research, Shirpur 425405 Dist. Dhule (MS), India. 2 Chitkara College of Pharmacy, Chitkara University, Rajpura 140401, Patiala Punjab, India
*Email: [email protected]
ARTICLE INFORMATION ABSTRACT
Received: June 26, 2018 Revised: Aug. 30, 2018 Accepted: Oct. 31, 2018 Published online: Nov 02, 2018
Axitinib is a tyrosine kinase Inhibiter. In a commenced analysis, a effortless and responsive high-performance liquid-chromatography method was developed and validated for the quantitative estimation of Axitinib in bulk and in-house tablet dosage form. The present method was developed and validated using LC-GC Qualisil BDS C18(250 mm × 4.6 mm, 5 µm). The separation of Axitinib was employed using a methanol: water 85:15% v/vas a mobile phase at optimal flow rate 1 mL/ min and column oven temperature 30°C. While, Axitinib was examined at 330 nm with a photo diode array detector; retention timewas found to be 3.23 min.The intended method was validated by ICH rules for the accuracy, precision, sensitivity, and ruggedness. The linearity was followed in the concentration range of 4 - 24 µg/ mL as demonstrated by correlation coefficient (r2) of 0.9994. The robustness of proposed method was assessed by purposelyvarying the chromatographic conditions. Consequently, the intended method can routinely be subjected for the estimation of Axitinib in bulk and in tablets formulation.
Keywords:
Axitinib;HPLC; validation;in-house tablets
2.2
Instrumentation
Agilent (1260 series) HPLC system furnished with quaternary reservoirs and gradient system pump. Photo diode array detector and CTO 10 AS vp; column oven, a Rheodyne injector with 20 µL loops and a Hamilton syringe (100 µL) and analysis were performed with Open Lab panel Control (Agilent 1260) Germany. All weighing process for the studied analysis were accomplished with the help of SHIMADZU AUX-120 analytical balance. Ultra sonication of samples was achieved usingUltrasonicator; Enertech Electronics Pvt. Ltd., India.
2.3
Preparation of Mobile Phase
A mixture of methanol and water was prepared in the volume ratio of (85:15% v/v) as mobile phase. It was filtered through 0.4 µm membrane filter paper andit was sonicated in an ultrasonicator for 20 min.
2.4
Preparation of Standard Stock Solution
Accurately 10 mg of Axitinib was weighed and transferred into 100 ml of volumetric flask and volume was made up to the mark with the same to achieve concentration of 100 µg/ml. From the stock solution, anappropriate volume of solution was withdrawn and diluted to 10 ml with the same to achieve concentration of 10 µg/ml.
2.5
Preparation of in-house tablets
Since, the finished pharmaceutical dosage formof Axitinib was not available in local Indian market, Therefore, in-house tablet containing 5 mg of Axitinib were prepared with direct compression method using common excipients. Prepared
in-house tablets are used as pharmaceutical formulation for rest of analysis.
2.6
Preparation of Sample Solution
The sample solution was prepared from in-house formulated Axitinib tablets. Twenty in-house tablets were accurately weighed, average weighed determined finely powered. A quantity of powered drug equivalent to 5 mg Axitinib transferred into 100 ml of volumetric flask containing 50 ml methanol, sonicated for 15 min. Further, the volume of the flask was made up to mark with the same solvent. The resulting solution was filtered through a 0.45 µm filter (Millifilter, Milford, MA, USA). An accurate volume was further diluted with the methanol to obtain a concentration of 10 µg/ml.
2.7
Chromatographic Conditions
The separation of Axitinib was performed on LC-GC Qualisil BDS C18(250 mm × 4.6 mm, 5 µm) using a
mixture of methanol and water in the ratio of (85: 15 %
v/v) as a mobile phase. Flow rate was maintained at 1 ml/ min. The PDA detection was employed at 330 nm and all analysis wasperformed at column oven temperature 300C. The chromatographic conditions of proposed analysis were shown in Table 1.
Figure 1: Chemical Structure of Axitinib.
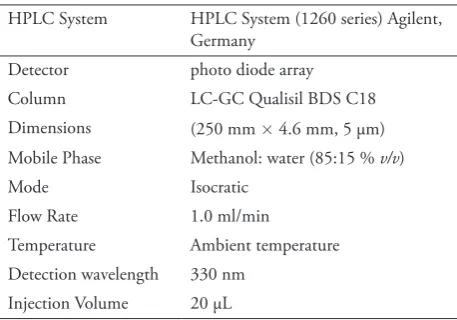
Table 1: Chromatographic Conditions
HPLC System HPLC System (1260 series) Agilent, Germany
Detector photo diode array Column LC-GC Qualisil BDS C18 Dimensions (250 mm × 4.6 mm, 5 µm) Mobile Phase Methanol: water (85:15 % v/v) Mode Isocratic
Flow Rate 1.0 ml/min
Temperature Ambient temperature Detection wavelength 330 nm
Injection Volume 20 µL
2.8
Study of Calibration Curve
The standard calibration curve was acquired by plotting the peak area versus concentration showed linear relationship over a concentration range of 4-24 µg/mL, respectively. The linear regression equation for Axitinib was established as y =14485x +1955.7 and the regression coefficient value (r2) =0.9994 for drug indicating high degree of linearity. Characteristic parameters of the RP-HPLC method are reported in Table 2 and standard calibration curve is shown in Fig. 3.
3. Results and Discussion
3.1
Optimization of Chromatographic Conditions
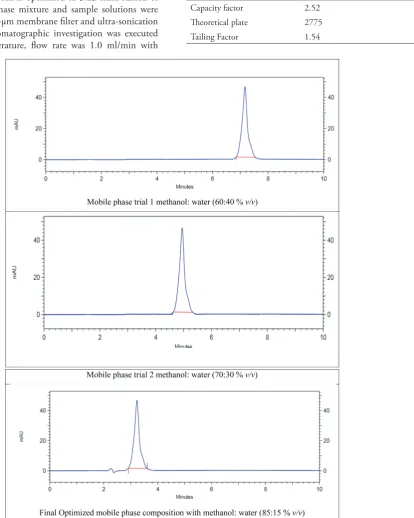
it was observed that Axitinib was not eluted. Therefore, the mobile phase composition was revised to methanol and water in the ratio of (60:40 % v/v) and (70:30 % v/v) was tested and these gave long retention time of drug. Finally, mobile phase consisting of methanol: water (85:15 % v/v) showed good resolution of peak and the total run time was 10 min and the peak is optimized in 3.23 min, Ahead of analysis mobile phase mixture and sample solutions were filtered over a 0.45µm membrane filter and ultra-sonication for 10 min. Chromatographic investigation was executed at ambient temperature, flow rate was 1.0 ml/min with
injection volume 20 µL followed by detection wavelength at 330 nm. The different trials executed out for optimization of mobile phase is shown in Fig. 2.
Table 2: System suitability studies.
Retention time 3.23 min Capacity factor 2.52 Theoretical plate 2775 Tailing Factor 1.54
Figure 3: Standard Calibration Curve of Axitinib.
3.2 Method Validation
The anticipated method was validated in terms of precision, accuracy, limit of quantification (LOQ), Limit of Detection (LOD), specificity, ruggedness and robustness according to the international conference on harmonization (ICH) guidelines Q2(B)(ICH 2005).
3.3
System suitability
System suitability of proposed of method was performed using the concentration of 10 µg/mLfor Axitinib. Mean,
standard deviation (SD) and percent relative standard deviation (%RSD) were calculated for peak are and retention time. The % RSD values for both peak area and retention time was established to be within the limit. The result of system suitability was shown in Table 3.
Table 3: Characteristics parameter of the HPLC method for determination of Axitinib.
Parameter Axitinib Linearity range µg/mL 4-24 µg/mL
Slope 14485
Intercept 1955.7 Correlation Coefficient 0.9994
3.4
Accuracy and Precision
The accuracy of ananticipated analysis was assessed by standard addition methods, where a known amount of the standard was added in three different levels i.e. 80, 100, and 120 % to in-house tablet formulation of Axitinib. The experiment was performedin triplicate and percentage recoveries and % RSD were calculated. The achieved % recovery and % relative standard deviation were within the range of 98.45-100.03 % and 0.16-0.36 agreeable the approved conditions for the studies. The results of % recovery study for Axitinib was shown in Table 4.
Table 4: Accuracy Studies.
Drug Initial Amount
[μg/mL] Excess drug added to the analyte [%] Total amountfound±S.D. [μg/mL]
Recovery [%]
[n=3] %RSD[n=3]
Axitinib
8 80 14.49 ± 0.03 100.03 0.30 8 100 15.95 ± 0.02 99.69 0.16 8 120 17.32 ± 0.03 98.45 0.19 n- number of determinations
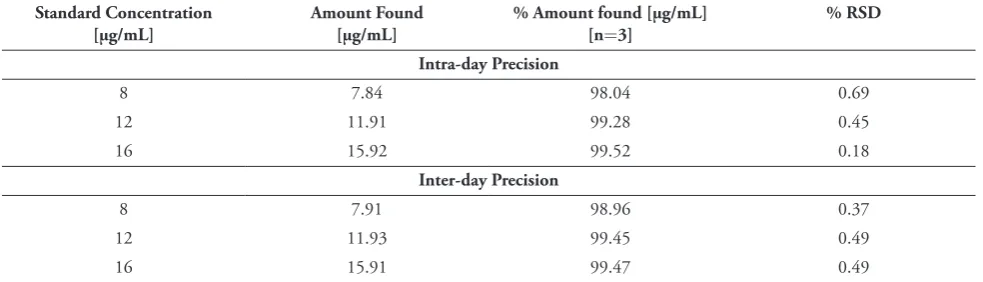
Table 5: Precision Studies [Intra and Inter-day].
Standard Concentration
[μg/mL] Amount Found[μg/mL] % Amount found [μg/mL][n=3] % RSD Intra-day Precision
8 7.84 98.04 0.69
12 11.91 99.28 0.45
16 15.92 99.52 0.18
Inter-day Precision
8 7.91 98.96 0.37
12 11.93 99.45 0.49
16 15.91 99.47 0.49
Precision of intended method was carried out as repeatability and intra-day and inter-day variations. The repeatability of method was controlled by performing six repeat estimations of 12µg/mL; the effects on the results were studied in terms of %RSD and found to be less than 2.
Intra-day variation was performed by analyzing three different concentrations for three times within a day and Inter-day precision was assessed by three different concentrations for three consecutive different days, over a period of week The intra-day and inter-day variation were measured at three different concentrations 8, 12 and 16 µg/mL. The effects on results of intra-day and inter-day variations were assessed in terms of % RSD; and results were shown in Table 5.
3.5 Limit of Quantification and Limit of
Detection
The LOD and LOQ were calculated using equations; LOD = 3.3 × N/B and LOQ = 10 × N/B, where, N is standard deviation of the peak areas of the drugs (n=3), taken as a measure of noise, and ‘B’ is the slope of the corresponding calibration curve. The LOD and LOQ for Axitinib were found to be 0.0199 µg and 0.0602 µg, respectively. The obtained LOD and LOQ values showed the higher sensitivityto the optimized mobile phase mixture.
3.6 Specificity
Specificity study is a practice to measure quantitatively the analyte in existence of constituent that may be likely to be
there in the sample matrix. The results of specificity study revealed that the there was no other interfering peak around the retention time of drug.
3.7
Robustness and Ruggedness
Robustness of the method was established to evaluate the influence of small but purposeful dissimilarity in the chromatographic conditions for the determination of the percentage of Axitinib. The independent variables were selected for robustness studies include mobile phase volume, mobile phase composition, and column oven temperature and flow rate. Robustness of the method was performed at a concentration level of 8 µg/mL. When very small changes were made to the method conditions there were no marked changes in chromatographic behavior and content of the drug, as evident from the low value of percentage RSD indicating the method is robust. Ruggedness of established method was by using two different analysts under the same experimental and environmental conditions. The results of ruggedness study revealed that value of percentage RSD was below 2.0%, showed ruggedness of developed analytical method.
3.8
Assay of in-house Axitinib Tablet Formulation
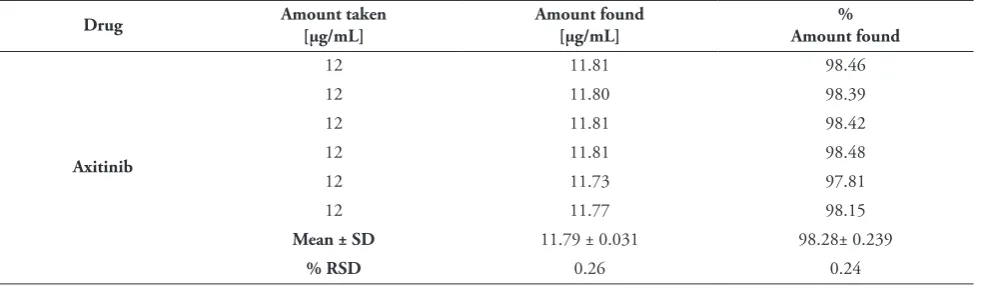
Assay of in-house Axitinib tablet containing 5 mg of Axitinib along with common excipients performed at concentration of 12µg/mL. The amounts of Axitinib determined were found to be 98.28 ± 0.239%. An excellent amount of recovery showed that there was no interference from the excipients present in the in-house tablet dosage form. Assay results for Axitinib in in-house tablet was represented in Table 6. Table 6: Analysis of in-house Tablets.
Drug Amount taken[μg/mL] Amount found[μg/mL] Amount found%
Axitinib
12 11.81 98.46
12 11.80 98.39
12 11.81 98.42
12 11.81 98.48
12 11.73 97.81
12 11.77 98.15
Mean ± SD 11.79 ± 0.031 98.28± 0.239
% RSD 0.26 0.24
n -number of determinations
3.7 Comparison of assay method with reported
methods
The assay, of the proposed RP-HPLC method was compared with the two reported methods. Further, the accuracy and
Table 7: Comparison of established method with reported HPLC methods [3, 9].
Sr. No Validation parameters Proposed RP-HPLC Method Reported Method 1 Reported Method 2 Comments
1. Accuracy (%) 98.45-100.03 99.37-99.87 98.7-100.3 Good accuracy 2. LOD and LOQ (μg) 0.0199 and 0.0602 0.62 and 1.88 0.06 and 0.17 Comparable sensitivity
3. Assay (%) 98.28 99.63 100.26 Comparable assay
results
4. Conclusion
The proposed developed RP-HPLC method for the estimation of Axitinibin bulk and in-house tablet dosage form using mobile phase composed of methanol: water (85:15 % v/v) showed an admirable separation of Axitinib with retention time was 3.23 min. The established method gives good resolution of Axitinib with short analysis time. The established method was linear over the concentration range of 4-24 µg/ml; with a correlation coefficient (r2) 0.999 along with the obtained LOD and LOQ 0.0199 µg and 0.0602 µgvalues showed the highest sensitivity towards the optimized mobile phase. The method was developed and validated and found to be simple, sensitive, accurate, and precise. Also, the developed methods were compared with the reported methods. Therefore, thedeveloped method can be routinelyused for the analysis of Axitinib in bulk and in- house pharmaceutical dosage form.
Acknowledgement
Authors are thankful to Principle, R. C. Patel Institute of Pharmaceutical Education and Research, Shirpur (MS) India,for providing necessary facilities to carry out the research work.
Conflict of Interest
The authors declare no potential conflict of interest
References
1. Pithavala, Y. K., Chen, Y., Toh, M., Selaru, P., Labadie, R. R., Garrett, M., Hee, B., Mount, J., Ni, G., Klamerus, K. J. and Tortorici, M. A. et al., (2012). Evaluation of the effect of food on the pharmacokinetics of axitinib in healthy volunteers. Cancer Chemotherapy and Pharmacology, 70(1), 103–112.
https://doi.org/10.1007/s00280-012-1888-9
2. Lakshmi, B., Saraswathi, K., Reddy, T. V., (2012). RP-HPLC method development and validation for the analysis of Axitinib in pharmaceutical dosage forms.
International Journal of Science Innovations and Discoveries, 2, 184–90.
3. Chandra, R. B. J. and Sarada, N. C. (2016). Development and validation of Stability indicating RP-HPLC method for the Determination of Axitinib in Bulk and its Pharmaceutical Formulations. Der Pharmacise Letter, 8(11), 97–106.
https://www.drugbank.ca/drugs/DB06626
4. Wilmes, L. J., Pallavicini, M. G., Fleming, L. M., Gibbs, J., Wang, D., Li, K. L., Partridge, S. C., Henry, R. G., Shalinsky, D. R., Hu-Lowe, D., Park, J. W., McShane, T. M., Lu, Y., Brasch, R. C., Hylton, N. M. et al., (2007). A novel inhibitor of VEGF receptor tyrosine kinases, inhibits breast cancer growth and decreases vascular permeability as detected by dynamic contrast-enhanced magnetic resonance imaging. Magnetic Resonance Imaging, 25, 319–327.
https://doi.org/10.1016/j.mri.2006.09.041
5. Bouchet, S., Chauzit, E., Ducint, D., Castaing, N., Canal-Raffin, M., Moore, N., Titier, K., Molimard, M., et al., (2011). Simultaneous determination of nine tyrosine kinase inhibitors by 96-well solid-phase extraction and Ultra Performance LC/MS-MS. Clinica Chimica Acta, 412, 1060–1067.
https://doi.org/10.1016/j.cca.2011.02.023
6. Lankheet, N. A., Hillebrand, M. J., Rosing, H., Schellens, J. H., Beijnen, J. H. and Huitema, A. D., (2013). Method development and validation for the quantification of dasatinib, erlotinib, gefitinib, imatinib, lapatinib, nilotinib, sorafenib and sunitinib in human plasma by liquid chromatography coupled with tandem mass spectrometry. Biomedical chromatography, 27(4), 466–476.
https://doi.org/10.1002/bmc.2814
7. Sparidans, R. W., Iusuf, D., Schinkel, A. H., Schellens, J. H., Beijnen, J. H. (2009). Liquid chromatography-tandem mass spectrometric assay for the light sensitive tyrosine kinase inhibitor axitinib in human plasma. Journal of Chromatography B, 877(32), 4090–6. https://doi.org/10.1016/j.jchromb.2009.10.024 8. Gorja, A. and Sumantha, M., (2017). Development
Indian Journal of Pharmaceutical and Biological Research, 5(3), 1–6.
9. Chakravarthy, V. A. and Sailaja, B. B. V., (2016). Method development and validation of UV- spectroscopic method for the estimation of assay of anti-cancer drugs-axitinib, bosutinib, erlotinib hydrochloride, gefitinib and pemetrexed disodium drugs in api form. European Journal of Pharmaceutical and Medical Research, 3, 609–624.
10. Panda, S. S., Bera, V. V. R. K., Panda, N., (2016). Development and Validation of a Superior High Performance Liquid Chromatographic Method for Quantification of Axitinib in Solid Oral Dosage Form. American Journal of Modern Chromatography, 3, 33–43.
https://doi.org/10.7726/ajmc.2016.1003
![Table 7: Comparison of established method with reported HPLC methods [3, 9].](https://thumb-us.123doks.com/thumbv2/123dok_us/8803942.1773496/6.595.53.541.102.182/table-comparison-established-method-reported-hplc-methods.webp)
