Volume 5, No. 8, Nov-Dec 2014
International Journal of Advanced Research in Computer Science
RESEARCH PAPER
Available Online at www.ijarcs.info
Analysis of Flagellar Movements of Bacterial Cells using Digital Image Processing
Techniques
Parashuram Bannigidad
Department of Computer Science, Rani Channamma University, Belagavi-591156, Karnataka, India
Abstract: The main objective of the present study is to develop an automatic tool to characterize the morphology of flagellar movements of bacterial cells in digital microscopic cell images. Geometric shape features are used to identify the different characteristics of bacterial cell flagellar movements, namely, monotrichous, lophotrichous, peritrichous and amphitrichous. The current methods rely on the subjective reading of profiles by a human expert based on the various manual staining methods. In this paper, an automated method is proposed for bacterial cell characterization based on their different characteristics of flagellar movements by segmenting digital bacterial cell images and extracting geometric shape features for cell morphology. The classification techniques, namely, 3σ and K-NN classifiers are used to identify the bacterial cells based on their morphological characteristics. The experimental results are compared with the manual results obtained by the microbiology expert and demonstrate the efficacy of the proposed method.
Index Terms: Bacterial cell image analysis, flagellum, monotrichous, lophotrichous, peritrichous, amphitrichous, bacterial cell morphology, edge detection, 3σ classifier, K-NN classifier
I. INTRODUCTION
Microscopical examination is usually the first step in the identification of an organism. The morphological features of importance include: size, shape, arrangement, presence of flagella and spore. The different types of microscopes are commonly employed for bacterial study, namely, optical or light microscope, phase contrast microscope, dark field illumination microscope, fluorescence microscope and electron microscope. Low or medium-power light microscopy is usually adequate for the study of fungi and protozoa, whereas oil-immersion microscopy is necessary for identification of bacteria.
Most of the bacteria are useful and some are even necessary to life. Others have been put to work for a specific purpose. Bacteria play an important part in the digestive processes of animals. There are many bacteria in the human intestine. As the bacteria eat, they break down foods. At the same time they make certain vitamins, which the body then uses. The bacteria inside the stomach of grass–eating animals can break down cellulose, the stiff wall of green plant cells. By enabling cows to digest grasses, bacteria play a part in the production of milk. Bacteria, often ‟Lactobacillus‟ in combination with yeasts and molds, have been used for thousands of years in the preparation of fermented foods such as cheese, pickles, soy sauce, sauerkraut, vinegar, wine and yoghurt.
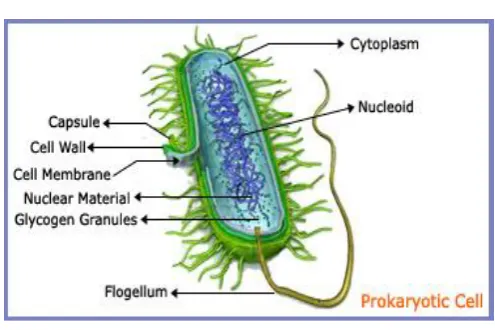
The anatomy of bacterial cell structures possess, cell wall, cell membrane and the protective gelatinous covering outside the cell wall known as capsule. Apart from this, some bacteria possess filamentous appendages, flagella and fimbriae, which protrude from the cell surface. Surface structures originate outside the cell membrane, sometimes being attached to it, and extend into the environment [14, 16, 17]. The structure of bacterial cell is shown in Fig.1.
Figure. 1 Structure of bacterial cell
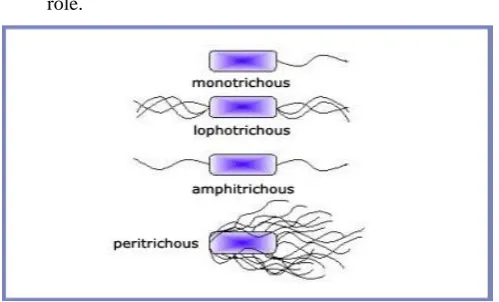
In this paper, the images of bacterial cells of flagella surface structures are considered for the identification and classification of the cells. In our study, the morphological flagellar movements, namely, monotrichous, lophotrichous, peritrichous, amphitrichous of bacterial cell structures are considered.
in serological diagnosis but do not have any protective role.
Figure. 2 The sample flagellated bacterial cell structure.
The complete atomic model of the bacterial flagellar filament by electron cryomicroscopy has been carried out by Koji et al. [1]. The real-time imaging of fluorescent flagellar filaments has been done by Linda et al. [2]. The bacterial growth and motility in sub-micron constrictions has been investigated by Jaan et al. [3]. Hiremath and Parashuram [4] have investigated the automatic Gram-staining characterization of digital microscopic bacterial cell images using color and cell wall properties. Carolina Wählby et al.[5], have investigated algorithms for cytoplasm segmentation of fluorescence labelled cells using statistical analysis techniques based on shape descriptive features.
The segmentation and statistical analysis of individual rotavirus particles is done by Venkataraman, et al. [6]. A simple image analysis algorithm for evaluation of extended filaments length based on the enhanced digitized image using statistical analysis is proposed [7]. GSI of bacterial and archaeal cells in the natural microbial communities of slightly and extremely saline environments has been proposed [8]. Digital image analysis of actinomycetes colonies as a potential aid for rapid taxonomic identification has been investigated [9]. Characterization of PHB storage in activated sludge extended filamentous bacteria by automated colour image analysis has been examined [10]. An improved automated methods for identification of bacterial cell morphological characteristics using geometrical shape features has been investigated by Hiremath et al.[17].
In this paper, the objective is to propose an automatic identification and classification of bacterial cell characteristics in digital microscopic images using geometric shape features that characterize the different morphology of bacterial cell flagellar movements. For identification and classification, 3σ and K-NN classifiers are used. The experimental results are compared with the manual results obtained by microbiology expert and demonstrate the efficacy of the proposed method.
II. MATERIALS AND METHODS
The strains were inoculated in broth media and incubated overnight at 37°C for 18 hrs in agitation rotor.
The bacterial cells from each culture were recovered by centrifugation at 6,000 rev/min and the cells were washed twice with potassium phosphate buffer (50 mM, pH 7.0). Bacterial cells were then fixed by immersion in 2.5% glutaraldehyde in potassium phosphate buffer (50 mM, pH 7) overnight at 40C. Then the specimens were washed twice with buffer and dehydrated by an ethanol series (v/v) ranging from 30, 40, 50, 60, 70, 80, 90 to 100% and stored in 100% ethanol. For SEM, the specimens were dried to critical point, coated with gold and examined with an S-200C scanning electron microscope. The cell volumes and surface area were directly measured from Scanning Electronic Microscopy (SEM) photograph. The digital images of cells on the slides are captured by a digital camera interfaced with a PC and then stored in the disk memory for further processing and image analysis. For the purpose of experimentation, a datasets containing the 300 color images of bacterial cells (non-overlapping) with different characteristics, namely, monotrichous, lophotrichous, peritrichous and amphitrichous, is prepared.
III. PROPOSED METHOD
The objective of the present study is to propose an automated image analysis of digital bacterial cell image in order to identify the different morphology of a bacterial cell: monotrichous, lophotrichous, peritrichous and amphitrichous using geometric features of cells and a better classifier such as K-NN classifier. Out of many geometric features used by various authors in the literature, it is observed that only three geometric shape features, namely, elongated, eccentricity and tortuosity are used and these are defined as given below:
a. Elongated(x1): It is the ratio of longer side to shorter side of the bounding rectangle (Elongated = Length / Width).
b. Eccentricity(x2):It is the ratio between the lengths of the short axis to the long axis(Eccentricity = axis length short / axis length long). The value of eccentricity is between 0 and 1. Eccentricity is also called ellipticity with respect to minor axis and major axis of the ellipse.
c. Tortuosity(x3): It is the ratio of contour length (perimeter) to the maximum linear length (MajorAxis Length) between any two points on the contour (Tortuosity = Major axis / perimeter)
The proposed method comprises the following steps, which are depicted in the block diagram shown in the Fig. 3: a) Preprocessing using morphological operations
b) Segmentation using Canny‟s edge method c) Geometric feature extraction.
d) Classification into monotrichous, lophotrichous, peritrichous and amphitrichous
The bacterial cell images generally contain noise, small debris and artifacts depending on the different staining methods. To remove this debris, the image has been pre-processed by applying morphological operations. This stage is of high importance in achieving good results in segmentation and further process. The gray scale image of cells is segmented using the Canny‟s edge method, which yields binary image. After labeling the segmented image, the geometric features are extracted for each labeled segment. These features are used as a basis for the cell characteristics. Using the training set of images (with known cell classification), for each feature
of kth cell type, then compute the mean and standard deviation of the sampling distribution of the feature values and store them as knowledge base. In the testing phase, for a given test image, feature values of the segmented regions (cells) are computed and then cell classification is done using the 3σ rule, namely: For a segmented region in the test image, if the feature values
lie in the interval then the
region is a cell of type k. The k=1, ... ,4 correspond to monotrichous, lophotrichous, peritrichous and amphitrichous cell types, respectively.
The proposed method for the automatic identification of bacterial cell morphological characteristics, namely monotrichous, lophotrichous, peritrichous and amphitrichous, using geometric shape features that characterize the different morphology of bacterial cells, are given below in the Algorithms 1 and 2.
A. Training phase:
Algorithm 1: Extraction of cell features for knowledge base
Step 1: Input bacterial cell image (RGB color training image).
Step 2: Convert the RGB image into gray scale image. Step 3: Perform preprocessing using morphological operations
Step 4: Segment the resulting image of Step 3 using Canny‟s edge method.
Step 5: Perform labeling the segmented image.
Step 6: For each labeled segment, compute geometric shape features , for each cell type k. The k=1,..,4 correspond to monotrichous, lophotrichous, peritrichous and amphitrichous, respectively.
Step 7: Repeat steps 1 to 6 for all the training images. Step 8: Compute mean and standard deviation of the sampling distribution of the feature values for each cell type k and store them as knowledge base.
B. Classification phase:
Algorithm 2: Classification of bacterial cell morphology Step 1: Input bacterial cell image (RGB color training image).
Step 2: Convert the RGB image into gray scale image. Step 3: Perform preprocessing using morphological operations
Step 4: Segment the resulting image of Step 3 using Canny‟s edge method.
Step 5: Perform labeling the segmented image.
Step 6: For each labeled segment, compute geometric shape features , for each cell type k. The k=1, … ,
4 correspond to monotrichous, lophotrichous, peritrichous and amphitrichous, respectively.
Step 7: Apply 3σ rule and K-NN classifiers for classification of the bacterial cells: A segmented region is of cell type
k, if its features lie in the interval
.The k=1,…,4 correspond to monotrichous, lophotrichous, peritrichous and amphitrichous, respectively. Step 8: Repeat the Steps 6 and 7 for all labeled segments and output the classification of identified cells.
The Algorithm 2 can also be implemented using K-NN classifier instead of 3σ classification rule, where K=1 is minimum distance classifier. Further, it can be implemented using different combinations of features.
C. K-NN classifier:
The K-nearest neighbor (K-NN) classification is performed by using a reference data set (training set) which contains both the input (feature set) and the target variables (known cells) and then by comparing the unknown (test data) which contains only the input variables (features) to that reference set. The distance of the unknown to the K nearest neighbors determines its class assignment by either averaging the class numbers of the K nearest reference points or by obtaining a majority vote from them [15].
IV. EXPERIMENTAL RESULTS AND
DISCUSSIONS
For the purpose of experimentation, each 100 color digital bacterial cell images containing different characteristics of bacterial cells (non-overlapping) namely, monotrichous, lophotrichous, peritrichous and amphitrichous are considered (as described in the section 2). The implementation is done on a Pentium Core 2 Duo @ 2.83 GHz machine using MATLAB 7.9 [11]. In the training phase, each input color image of bacterial cell (Fig. 4(a)) is converted into gray scale image, and the morphological operations such as erosion, reconstruction and dilation are applied [12,13]. The resulting image is segmented using canny‟s edge method to obtain segmented binary image (Fig. 4(c)). The segmented image is labeled and for each segmented region (known cells), the geometric features are computed. The Table I present the geometric feature values computed for the segmented cell regions of the image in Fig. 4(c).
(i)
(ii)
(iv) (a) (b) (c)
Figure. 4 i-iv (a) Original microscopic flagellated cell images,(b) gray scale images of image in (a), (c) Segmented images of images in (b).
Table 1: The geometric feature values of the cell regions of the image in the fig. 4(c)
Geometric cell features
Values of geometric features of bacterial cells Monotrichous
(Fig.3(a))
Lophotrichous (Fig.3(d))
Peritrichous Amphitrichous
Elongated (x1) 2.0306 1.4943 1.3791 1.8374
Eccentricity (x2) 0.9285 0.9463 0.8568 0.9568
Tortousity (x3) 0.3324 0.1288 0.0761 0.3459
The mean and standard deviation of the sampling distribution of these features obtained from the training images are stored in the knowledge base of the cells:
monotrichous, lophotrichous, peritrichous and amphitrichous as shown in Table II.
Table 2: Mean and standard deviation (sd) of geometric feature values of monotrichous, lophotrichous, peritrichous, amphitrichous bacterial cells
Geometric
features Monotrichous Lophotrichous Peritrichous Amphitrichous
Mean SD Mean SD Mean SD Mean SD
Elongated 1.7447 0.6899 1.6378 0.3498 1.4736 0.1872 1.8786 0.8074
Eccentricity 0.9382 0.0234 0.9452 0.0013 0.8643 0.0172 0.9663 0.0092
Tortousity 0.3685 0.1329 0.1286 0.0029 0.0846 0.0206 0.3685 0.0688
In the testing phase, for a test image, the feature extraction algorithm is applied and the test feature values
xi(test) for each segmented region are used for classification using 3σ rule and K-NN classifier. The classification results are given in the Table III.
Table 3:Classification results obtained by proposed method using different feature sets
Cell morphology
Classification accuracy 3σ classifier K-NN classifier
Monotrichous 93 88 Lophotrichous 96.5 97
Peritrichous 95 97 Amphitrichous 90 93
The Table III summarizes the average classification rates obtained by two different classification techniques, namely, 3σ and K-NN classifier. For testing images, the 3σ classifier has yielded an accuracy of 90% to 96.5% and K-NN classifier has yielded 88% to 98%. The performance comparison indicates that the K-NN classifier has good classification ability as compared to 3σ classifier. The results of the confusion matrix for all the flagellar movements of bacterial cells are given in the Table IV.
Table 4: Confusion matrix for characterization of flagellar movements of bacterial cells
Total Monotrichous Lophotrichous Peritrichous Amphitrichous Unknown
Monotrichous 290 290 0 0 0 0
Lophotrichous 100 0 100 0 0 0
Peritrichous 110 0 0 100 0 10
Amphitrichous 64 21 0 0 43 0
Unknown 10 21 0 0 0 10
V. CONCLUSIONS
In this paper, an automated method is proposed for bacterial cell characterization based on their different characteristics of flagellar movements by segmenting digital bacterial cell images and extracting geometric shape features for cell morphology. The classification techniques, namely,
using only 3 features, namely, elongated, eccentricity, and tortousity. In general, the performance comparison indicates that the K-NN classifier has good classification ability as compared to 3σ classifier.
VI. ACKNOWLEDGEMENT
The authors are indebted to Dr. A. Dayanand, Professor of Microbiology, Gulbarga University, Gulbarga, for providing bacterial cell images and manual results by visual inspection.
VII. REFERENCES
[1] Koji Yonekura, Saori Maki-Yonekura and Keiichi Namba, Complete atomic model of the bacterial flagellar filament by electron cryomicroscopy, NATURE, Vol. 424, 2003, pp. 643-650.
[2] Linda Turner, William S. Ryu, and Howard C. Berg, Real-Time Imaging of Fluorescent Flagellar Filaments, Journal of Bacteriology, Vol. 182, No. 10, 2000, pp. 2793–2801.
[3] Jaan Mannik, Rosalie Driessen, Peter Galajda, Juan E. Keymer, and Cees Dekker1, Bacterial growth and motility in sub-micron constrictions, PNAS, Vol. 106, No. 35, 2009, pp. 14861–14866.
[4] P.S. Hiremath and Parashuram Bannigidad, Automated Gram-staining characterisation of bacterial cells using colour and cell wall properties, Int. J. Biomedical Engineering and Technology, Vol. 7, No. 3, 2011, pp. 257-265.
[5] Carolina Wählby, Joakim Lindblad, Mikael Vondrus, Ewert Bengtsson and Lennart Björkesten,“ Algorithms for cytoplasm segmentation of fluorescence labeled cells”, Analytical Cellular Pathology, 24, 101-111 (2002).
[6] Venkataraman S., D.P. Allison, H. Qi, J.L. Morrell-Falvey, N.L. Kallewaard, J.E. Crowe Jr. and M.J. Doktycz(2006) Automated image analysis of atomic microscopy images of rotavirus particles, Ultramicroscopy, Elsevier, Vol.106, pp. 829-837.
[7] Kima, Y.J., Choib, Y.G. and Chunga, T.H. (2008) „A simple image analysis algorithm for evaluation of extended filaments length based on the enhanced digitized image‟,
Journal of Environmental Science and Health Part A, Vol. 43, pp.1489–1494.
[8] Saida, H., Kamekura, M., El-Sayed, W.S.M., Abu-Shady, M., Abe, Y., Yamaguchi, T., Yang, P., Maekawa, T. and Seki, H. (2001) „Gram Stain Index (GSI) of bacterial and archaeal cells in the natural microbial communities of slightly and extremely saline environments‟, Journal of Oceanography, Vol. 57, pp.109–113.
[9] Velho-Pereira, S. and Kamat, N. (2010) „Digital image analysis of actinomycetes colonies as a potential aid for rapid taxonomic identification‟, Nature Preceding: doi: 10.1038/npre. 2010.4209.1, pp.1–13.
[10] Pandolfi, D., Pons, M-N and da Motta, M. (2007) „Characterization of PHB storage in activated sludge extended filamentous bacteria by automated colour image analysis‟, Biotechnol. Lett., Vol. 29, pp.1263–1269.
[11] Rafael C. Gonzalez and Richard E. Woods (2002). Digital Image Processing, Pearson Education Asia, India.
[12] John C. Russ, The Image Processing Hand Book, (2007),
5th Ed. CRC Press, New Jersey.
[13] Evangelia Micheli-Tzanakou “Supervised and Unsupervised Pattern Recognition – Feature Extraction and Computational Intelligence”, (2000) CRC Press LLC, Florida.
[14] Jeffrey C. Pommerville (2010) Alcamo‟s Fundamentals of Microbiology Body systems edition, Jones and Bartlett Publishers, USA.
[15] Earl Gose, Richard Johnson baugh and Steve Jost (2007). Pattern Recognition and Image Analysis, Pearson Education Asia, India.
[16] P.S. Hiremath, Parashuram Bannigidad and Soumyashree Y. Identification of Flagellated or Fimbriated Bacterial Cells using Digital Image Processing Techniques, Journal of Computer Applications (IJCA), Vol. 59, No. 12, pp.12-16, 2012.