Bridging the gap between homopolymer and protein models:
A discontinuous molecular dynamics study
Anne Voegler Smith and Carol K. Hall
Department of Chemical Engineering, North Carolina State University, Box 7905, Raleigh, North Carolina 27695-7905
共Received 10 July 2000; accepted 1 September 2000兲
A series of seven off-lattice protein models is analyzed that spans a range of chain geometry from a simple, low-resolution homopolymer model to an intermediate-resolution model that accounts for the presence of side chains, the varied character of the individual amino acids, the rigid nature of protein backbone angles, and the length scales that characterize real protein bead sizes and bond lengths. Discontinuous molecular dynamics is used to study the transition temperatures and physical structures resulting from simulations with each protein model. Our results show that each protein model undergoes multiple thermodynamic transitions that roughly correlate with protein transitions during folding to the native state. Other realistic protein behavior, such as burial of hydrophobic side chains and hindered motion due to backbone rigidity, is observed with the more-detailed models. The results suggest that, despite their simplicity when compared with all-atom protein models, the models presented here display a significant amount of protein character and, when coupled with the efficient discontinuous molecular dynamics algorithm, may enable simulation of multiprotein systems over long times. © 2000 American Institute of Physics.关S0021-9606共00兲51944-8兴
I. INTRODUCTION
We are engaged in a program of research aimed at in-vestigating protein aggregation, a phenomenon that causes serious problems in the biomedical and pharmaceutical industries1–5and has been linked to a number of human con-ditions including Alzheimer’s disease and cataracts.6,7 De-spite its importance, protein aggregation has received little attention from the theoretical community, and as yet, a gen-eral understanding of its physical basis is far from complete. To study aggregation computationally, protein models must be developed that contain enough genuine protein character to mimic real proteins yet are simple enough to allow com-puter simulation of multiprotein systems over long times. In this article, we describe our efforts to construct a minimalist protein model that is computationally tractable and could eventually serve as the basis for studies of protein aggrega-tion.
The ability of idealized, or minimalist, models to provide insights into the coarse-grained structure and folding mecha-nisms of proteins has long been recognized.8–13 All-atom models are physically more realistic than minimalist models; however, their complexity precludes their use for studies of long-time events. Minimalist models, on the other hand, have played an important role in theoretical and computational studies that describe the shape of the protein folding land-scape and the major physical changes experienced by a pro-tein during folding from denatured random conformations to the native state, albeit with a sacrifice in detail.14–22Among the more popular minimalist models are the homo- and het-eropolymer chain models in which each amino acid residue is represented by a single sphere with identical 共homo兲 or varied 共hetero兲 interaction parameters.23–25 In addition to studies of physical transitions during folding of the
chain,20,26,27 homopolymer simulations have been used to probe for molten globule intermediates during the globule-to-coil transition28,29 and have successfully produced experimentally-characterized structures.30 Recently, hetero-polymer models have gained popularity as they can more accurately represent the character of real protein chains. Both lattice and continuous models have been used to demonstrate that heteropolymers ‘‘fold’’ to a small set of low energy 共‘‘native’’兲structures.8,14,15,31–35
Toward our goal of building a protein model suitable for simulations of protein aggregation, we previously performed single-chain simulations of a freely-jointed, tangent, square-well chain homopolymer model, a very simple protein model in which each amino acid residue is represented by a sphere.26,27 Despite the simplicity of the model, the system undergoes multiple equilibrium thermodynamic transitions that roughly correlate with gas-to-liquid, liquid-to-solid, and solid-to-solid transitions. Similar multiple phases are also observed during protein folding wherein proteins transition between denatured, collapsed globule, and native states.36 The gas-to-liquid collapse transition observed in homopoly-mer simulations mimics the structural collapse in the early stages of protein folding that is often driven by hydrophobic attraction. A homopolymer liquid-to-solid transition qualita-tively corresponds to a protein transition from the collapsed, molten-globule state to the native state. The third transition seen for homopolymers at very low temperatures corre-sponds to complete solidification of the protein and may in-dicate a cold denaturation process to an inactive state.27That the simplest of chain models, the homopolymer, can qualita-tively describe the stages of protein folding prompted us to consider the behavior of a range of simple protein models based on the homopolymer model studied previously.
9331
In this work, we systematically add selected protein-like features to the square-well homopolymer model studied pre-viously and use computer simulation to evaluate the impact that each new feature has on the phase transitions displayed by the model. Our focus here is on developing a simple representation of protein geometry that accounts for the pres-ence of bulky side chains, the varied character of the indi-vidual amino acids, the rigid nature of protein backbone angles, and the length scales that characterize real protein bead sizes and bond lengths. The homopolymer model is modified in four steps by adding the following physical fea-tures piece-by-piece:共a兲branched structure,共b兲 heterogene-ity, 共c兲 realistic backbone angles, and 共d兲 realistic ratios of bead sizes to bond lengths. By building the model in a step-by-step fashion, we create a hierarchy of distinct protein models that allows us to assess the relative importance of these features as measured by their impact on the phase tran-sitions in the system. We perform discontinuous molecular dynamics simulations on each of the protein models in this hierarchy at several different temperatures, monitoring the radius of gyration, specific heat, internal energy, and overall chain conformation. For each model studied, we report how the particular modification affects the observed thermody-namic phase transitions and the resulting physical structures. Highlights of our simulation results are the following. We find that introducing branching to the homopolymer model has little effect on either the temperatures or the strengths of the thermodynamic transitions. As with the ho-mopolymer model, branched hoho-mopolymers adopt symmet-ric conformations at moderately low temperatures and tight, spherical conformations at very low temperatures. Heteroge-neity, however, causes both a downward temperature shift and a strengthening of the individual transitions which can be attributed to a loss of constraints. Heterogeneous chains assume different types of compact conformations since only a fraction of their segments are subject to hydrophobic col-lapse. In the systems that incorporate realistic backbone angles and realistic ratios of bead sizes to bond lengths, we find multiple transitions similar to those obtained for the other models studied. The low-temperature structures of the chains, however, are influenced by the increased chain rigid-ity. In a forthcoming article, we define a potential energy function for use with the most realistic physical model de-veloped here, and we show that this physical model is indeed detailed enough to exhibit protein-like behavior but simple enough to allow for simulations covering very long time scales.37
The remainder of the article is organized as follows. Sec-tion II describes the models studied and the discontinuous molecular dynamics simulation technique used. In Sec. III, we present the results associated with the four types of modi-fications to the homopolymer model considered here: 共a兲 chain branching, 共b兲 chain heterogeneity, 共c兲 chain rigidity, and共d兲bead overlap. Section IV provides a brief conclusion.
II. MODELS AND METHODS
We use discontinuous molecular dynamics共DMD兲 com-puter simulations to study the effect of different chain geom-etries on the observed phase transitions and types of
equilib-rium structures. Here we provide a brief review of the DMD algorithm and define the types of interactions present in the simulations. We then describe the seven models studied and discuss the importance of each. At the end of this section, we specify the simulation parameters and the properties mea-sured during the simulations.
The DMD computer simulation technique was devel-oped by Alder and Wainwright to calculate the properties of systems containing hard spheres or square-well spheres.38 DMD is inherently faster than ordinary molecular dynamics, which is based on continuous potentials, because the equa-tions of motion for DMD can be solved analytically. The compromise, however, is that the energy function must be limited to discontinuous functions, such as the hard-sphere and square-well potentials. Pairs of hard-sphere beads inter-act via the hard-sphere potential,
ui j共r兲⫽
再
⬁, r⭐,
0, r⬎, 共1兲
where r is the distance between beads i and j and is the bead diameter. A mixed pair, that is a hard-sphere bead and a square-well bead, also interact via the hard-sphere poten-tial. Pairs of square-well beads interact via a square-well potential,
ui j共r兲⫽
再
⬁, r⭐,
⫺⑀, ⬍r⭐, 0, r⬎,
共2兲
whereis the well diameter and⑀is the well depth. After the pioneering work of Alder and Wainwright, Rapaport39 and Bellemans, Orban, and Belle40 proposed a method of simulating chain systems with discontinuous potentials wherein the bond between neighbors along the chain is al-lowed to vary freely over a small range around the true bond length. With this method, successive chain segments are es-sentially decoupled, allowing the chain system to be simu-lated with the DMD technique.
are used in this work, including neighbor lists, binary trees, and false positioning, and are described in detail by Smith, Hall, and Freeman.41
Seven types of chain geometry are considered in this study. The first, the ‘‘homopolymer’’ model shown in Fig. 1共a兲, is a freely-jointed, tangent, square-well chain with 80 beads. Homopolymer models were studied previously in our group for a range of chain lengths26,27and serve as our base structure. The remaining models studied are each built up from this foundation. The second model, the ‘‘homoprotein’’ model shown in Fig. 1共b兲, is a branched chain composed of a backbone of 60 freely-jointed, tangent, square-well beads and 20 freely-jointed, square-well side chain beads. The
ho-moprotein geometry is reminiscent of protein models in which each amino acid residue is represented by a four-bead monomer unit with three beads along the backbone and one side chain bead.42–44Physically, a four-bead amino acid rep-resentation is significantly more realistic than a one-bead representation since it allows for separate backbone and side chain interactions. The third model, the ‘‘heteroprotein’’ model shown in Fig. 1共c兲has the same four-bead, branched structure as the homoprotein model but contains hard-sphere backbone beads and square-well side chains. In Fig. 1, hard spheres are depicted by open circles, and square-well spheres are depicted by filled, gray circles. The attractive regions that surround square-well beads mimic attractions within real proteins, such as those due to hydrophobic forces. Heteroge-neity is an important feature in proteins. The heteroprotein model, in which the side chains are attractive beads and the backbone beads are hard spheres, is a simple representation of a peptide chain composed of identical hydrophobic resi-dues.
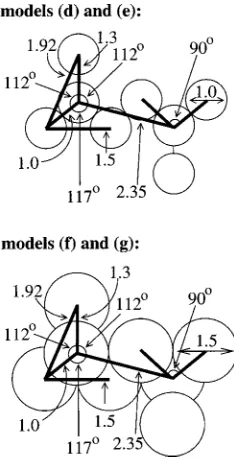
The fourth and fifth models, the ‘‘rigid homoprotein’’ model and the ‘‘rigid heteroprotein’’ model, are shown in Figs. 1共d兲 and 1共e兲, respectively. The rigid homoprotein model 关Fig. 1共d兲兴has the same branched, square-well struc-ture as the homoprotein model关Fig. 1共b兲兴; the rigid hetero-protein model关Fig. 1共e兲兴has the same branched, mixed hard-sphere and square-well structure as the heteroprotein model 关Fig. 1共c兲兴. In each rigid model, however, extra bonds共bold, black lines in Fig. 1兲 have been added to implement rigid, angular constraints like those present in real proteins. For the purpose of the simulation, these extra bonds are treated iden-tically to the original, neighbor–neighbor bonds. Extra bonds are added between next-neighbors along the backbone, effec-tively fixing all bond angles along the backbone. Bonds are also added between the central beads of each four-bead monomer building block. These bonds are used because, in real proteins, the distance between central atoms of neigh-boring amino acids are relatively fixed due to the fixed back-bone bond angles and the trans nature of peptide 共 interresi-due兲bonds. Finally, the side chain bead is bonded to all three backbone beads in its monomer unit instead of just to the central bead. These extra side chain bonds are necessary be-cause real amino acids have a chiral center atom. Two of the chiral atom’s constituents are the neighboring backbone beads; the other two are a side chain 共one of 20 different chemical groups, the side chain mimicked here兲and a hydro-gen atom. In all models here, we neglect the hydrohydro-gen atom side chain. We model the chirality of the central atom by fixing the remaining side chain bead’s position such that the model chain is composed of identical isomers.
The final two models, the ‘‘overlapping rigid homopro-tein’’ model and the ‘‘overlapping-rigid heteroprohomopro-tein’’ model, are shown in Figs. 1共f兲 and 1共g兲, respectively. The overlapping rigid homoprotein model 关Fig. 1共f兲兴 has the same geometry and set of bonds as the rigid homoprotein model 关Fig. 1共d兲兴; the overlapping rigid heteroprotein model 关Fig. 1共g兲兴 has the same geometry and set of bonds as the rigid heteroprotein model 关Fig. 1共e兲兴. However, the overlap-ping models have enlarged bead diameters. The resulting chains have smoother overall surfaces that more accurately FIG. 1. Model chains: 共a兲 ‘‘homopolymer’’ model, 共b兲 ‘‘homoprotein’’
reflect the atomic-level surface topography of real molecules. We perform DMD simulations on each of the seven pro-tein models described above. Simulations are performed on DEC Alpha workstations and range in length from 50 million to 1 billion collisions, with longer simulations required to reach equilibrium at lower temperatures. For each simula-tion, initial chain conformations and velocities are random. In all models, the backbone bond lengths are chosen to be unity and all other lengths are scaled relative to the backbone bond length. The side chain bond length, present in models 共b兲 through 共g兲, is chosen to be larger than the backbone bond length to mimic the geometry of real amino acids in which the center of a side chain group may be extended from the backbone by a distance much larger than that of a back-bone bond; the side chain bond length is arbitrarily set to 1.30. The bond lengths and angles for models共d兲through共g兲 are shown schematically in Fig. 2 and include next-neighbor bond lengths of 1.50, chiral center to chiral center bond lengths of 2.35, and side chain to nonchiral center backbone bead bond lengths of 1.92. For models 共a兲 through共e兲, the bead diameters共兲are unity; for overlapping models共f兲and 共g兲, the bead diameters are 1.50. All square-well beads have well widths共兲of 1.5. The bond tolerance,␦, is set to 0.1; therefore, all bonds are held to within 10% of their ideal lengths.
During the simulations, we monitor several thermody-namic and structural properties including radius of gyration, specific heat, and internal energy. The reduced squared ra-dius of gyration, Rg*, is given by
Rg*⫽
具
1/N兺i⫽1N 关共x
i⫺xc兲2⫹共yi⫺yc兲2⫹共zi⫺zc兲2兴
典
2N , 共3兲
where N is the number of beads; xi, yi, zi are the
coordi-nates of bead i, and xc, yc, zc are the center-of-mass
co-ordinates of the chain. The reduced specific heat, Cv*, is given by
Cv*⫽Cv kB⫽
关
具
E2典
⫺共具
E典
兲2兴共⑀T*兲2 , 共4兲
where kB is Boltzmann’s constant, E is the internal energy,
and T*is the reduced temperature, defined to be kBT/⑀. The
reduced internal energy, E*, is given by
E*⫽
具
E典
⑀ . 共5兲
Thermodynamic transitions can be characterized by changes in Rg*, Cv*, and E* with temperature. A sigmoidal shape in an Rg*vs T*plot is characteristic of a second-order, gas-to-liquid collapse transition. The number of plateaus and peaks in a Cv*vs T*plot corresponds to the number of equilibrium transitions. Discontinuities in an E*vs T*plot are evidence of a first-order, liquid-to-solid phase transition.
III. RESULTS AND DISCUSSION
A. Chain branching
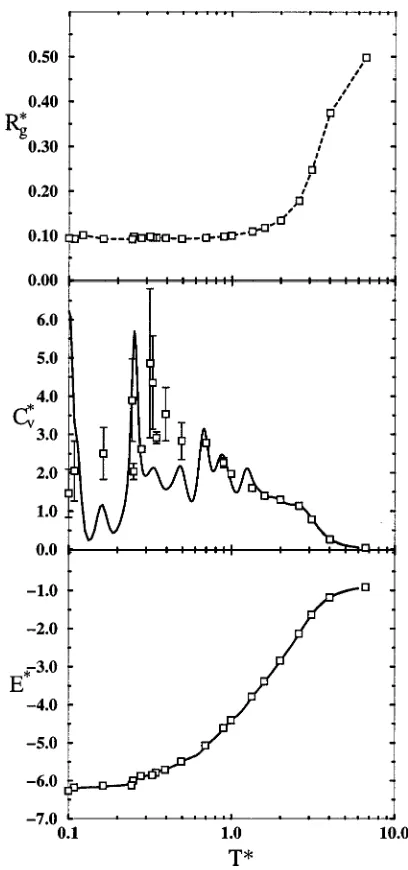
To study the effect of branching, we compare the behav-ior of an unbranched chain 关the homopolymer in Fig. 1共a兲兴 with that observed for a chain with separate backbone and side chain beads 关the homoprotein in Fig. 1共b兲兴. Figures 3 and 4 show Rg*, Cv*, and E* vs T* for the homopolymer
and the homoprotein, respectively. In this and in all thermo-dynamic data shown in this study the symbols represent the average equilibrium value from at least three independent simulations. Error bars are shown on all points and are the standard deviation in the measured values. However, the er-ror bars are only visible when they exceed the size of the symbol. The dashed lines on the Rg*plots are meant only to guide the eye between the points. The solid lines on the Cv*
and E*plots are the result of a weighted histogram analysis wherein degeneracy factors are extracted from the results of runs at different temperatures and a partition function is obtained.45 The error in the Cv* measurement can be quite large, especially at low temperatures, since it is a measure of fluctuations about a simulation variable共energy兲. As a result, the error bars on the Cv data can be large and, at times, the
histogram data lies outside these error bars. Consequently, we confirm the presence of a phase transition by comparing pairs of plots, either a sigmoidal collapse in the Rg* vs T*
curve and a peak in Cv*at the same temperature or a discon-tinuity in the E* vs T* curve and a peak in Cv*at the same temperature, and by examining the chain structure at the given temperature.
The homopolymer model exhibits multiple phase transi-tions, as was seen previously for shorter chains.26,27 As shown in Fig. 3, at a high temperature共T*of approximately 2.6 as measured at the midpoint of the transition兲, the ho-mopolymer system undergoes a collapse, where the Rg*
drops rapidly and the Cv*curve plateaus. At a lower tempera-ture, T* of 0.34, we observe a discontinuity in the E* plot and a corresponding spike in the Cv* plot, behavior charac-teristic of a first-order phase transition. As the temperature is FIG. 2. Bond lengths, bond angles, and bead sizes for models共d兲through
lowered further, the energy decreases gradually, and a spike in the specific heat at approximately T*⫽0.15 suggests a third transition. However, considerable variability in Cv data at such low temperatures makes confirming a third transition difficult. The equilibrium structures of chains in this low-temperature regime will be discussed below. The homopro-tein system共Fig. 4兲displays almost exactly the same transi-tion pattern as the homopolymer system, with a collapse transition at T*⫽2.6 and a lower-temperature transition at 0.34. Below T*⫽0.34 the energy continues to decrease, and an increase in Cvat a T*of approximately 0.15 may indicate a third transition. Transition temperatures for all models are summarized in Table I. Since the only difference between these two models is the way in which the beads are con-nected 共each system contains 80 square-well beads and 79 bonds兲, it is apparent that varying the connective arrange-ment of beads has little effect on the transition temperatures or on the strength 共steepness兲 of each transition. These
re-sults are in agreement with a lattice study of branched poly-mers which shows that a polymer with short side chains 共single beads兲adopts a global shape that is similar to that of a linear chain.46
Figures 5 and 6 are snapshots of typical conformations of the homopolymer and homoprotein systems at a T* of 0.30. Backbone beads are dark gray, and side chain beads are light gray. Both figures show symmetric structures with cu-bic lattice geometry. When viewed from the side, the struc-tures exhibit hexagonal lattice geometry. The mixed-lattice structure results from the square-well diameter of 1.5 at which cubic and hexagonal lattice geometries are equally stable. At temperatures below approximately 0.15, the chains exhibit less-symmetrical structures, such as the one shown in Fig. 7 for the homoprotein at T*⫽0.125, in which the simple lattice structure seen at T*⫽0.30 is sacrificed for a more spherical, lower energy structure. This reorganization at very FIG. 3. Reduced-squared radius of gyration (Rg*), reduced specific heat
(Cv*), and reduced energy (E*) as a function of reduced temperature (T*) for the homopolymer.
FIG. 4. Reduced-squared radius of gyration (Rg*), reduced specific heat
low temperatures, along with the peak in Cv at T*⫽0.15, suggests a polymorphic solid–solid transition. Similar results were obtained previously with shorter homopolymer models.26,27
The homoprotein model, in which we introduce branch-ing to the homopolymer model, will be useful in future, more realistic protein models because of the increased geometric detail possible due to its discretized backbone and side chains. As shown by the results in this section, the introduc-tion of branching did not disrupt the multiple thermodynamic phase transition behavior seen with homopolymers. This be-havior is qualitatively characteristic of phase transitions dur-ing protein folddur-ing and, consequently, an important behavior in any protein model.
B. Chain heterogeneity
We study the effect of heterogeneity by comparing be-havior of the homoprotein, Fig. 1共b兲, with that of the hetero-protein, Fig. 1共c兲. Figure 8 shows Rg*, Cv*, and E* vs T*
for the heteroprotein. While the same phase transitions are present as in the homoprotein system 共Fig. 4兲, introducing heterogeneity causes both a downward temperature shift and a strengthening 共steeper curve兲of the individual transitions. The collapse occurs at T*of 0.55, and a first-order transition occurs at approximately 0.19. 共Compare with homoprotein results of T*⫽2.6 and 0.34.兲 Additional low-temperature transitions for this model, if possible, exist below T*⫽0.1, the lowest temperature studied here. The shift in transition temperatures from the homoprotein and the heteroprotein models is expected when examined in light of the results for a cluster共no bonds兲of square-well beads.27A comparison of a 64 bead square-well chain with a 64 bead square-well clus-ter demonstrates that the lack of bonds in the clusclus-ter共a lack of physical constraints兲leads to sharper, steeper curves, cor-TABLE I. Transition temperatures observed for each model studied.
Model
Transition temperatures 共reduced units兲
Homopolymer 关Fig. 1共a兲兴
2.6,0.34,0.15a
Homoprotein 关Fig. 1共b兲兴
2.6,0.34,0.15a
Heteroprotein 关Fig. 1共c兲兴
0.55,0.19
Rigid homoprotein 关Fig. 1共d兲兴
2.5,0.16,0.12a
Rigid heteroprotein 关Fig. 1共e兲兴
0.50,0.17
Overlapping rigid homoprotein 关Fig. 1共f兲兴
3.2,0.25,0.15a Overlapping rigid heteroprotein
关Fig. 1共g兲兴
0.65,0.17
a
Rough estimates of temperature.
FIG. 5. A snapshot of the homopolymer chain at T*⫽0.30. The square-well beads assume cubic and hexagonal symmetry at this temperature. Chain structures were visualized using theAVSsoftware package from Advanced Visual Systems Inc.
FIG. 6. A snapshot of the homoprotein chain at T*⫽0.30. Backbone beads are dark gray; side chain beads are pale gray. The square-well beads assume cubic and hexagonal symmetry at this temperature.
responding to stronger physical transitions at lower tempera-tures. Since the cluster has considerably fewer constraints than the chain, it is necessary to subject it to a lower tem-perature to force a transition. In this study, the heteroprotein has fewer constraints than the homoprotein in that the beads experiencing the attractions that enable the phase transitions 共the square-well side chains兲 are separated from each other by five bonds. The system can be thought of as 20 square-well beads that are distantly constrained to each other through loops of four hard-sphere beads. The collapse tran-sition occurs via the side chain square-well interactions in spite of the fact that the side chains must drag the hard-sphere backbone along with them.
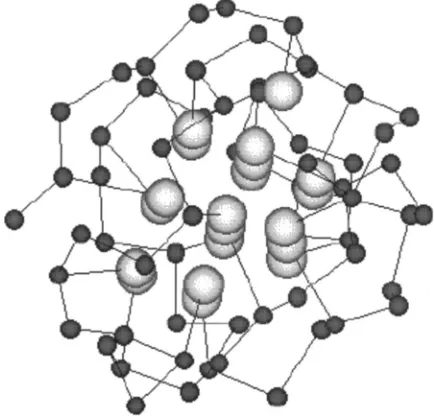
Figure 9 shows a symmetrical, low-temperature (T*
⫽0.17) conformation for the heteroprotein chain. Since the backbone beads are not square-well, they do not participate in ordering. The size of the backbone beads in Fig. 9 is
significantly reduced to highlight the hexagonal ordering of the side chain beads. As in the homopolymer and homopro-tein systems, decreasing the temperature leads to even lower-energy structures共not shown兲that do not exhibit lattice sym-metry.
Heterogeneity, like branching, is introduced to this hier-archy of models since it will be beneficial in future, more realistic protein models. The addition of heterogeneity al-lows the study of hydrophobic core formation, an important aspect of protein folding. The low-temperature conforma-tions observed, like the one shown in Fig. 9, readily adopt structures with the hydrophobic side chains clustered at the center and the nonhydrophobic backbone beads buffering them from solvent. However, in contrast to real protein na-tive states, the observed structures are not unique.
C. Chain rigidity
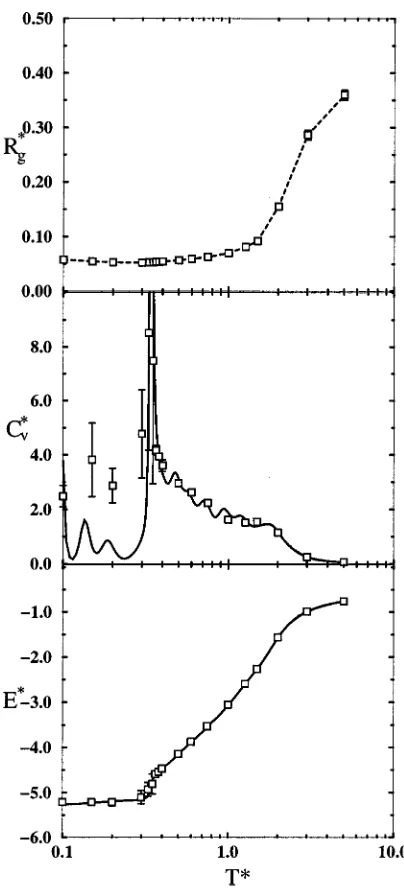
We assess the effect of chain rigidity on phase transi-tions by comparing the results from the homoprotein model, Fig. 1共b兲with those from the rigid homoprotein model, Fig. 1共d兲. Figure 10 shows Rg*, Cv*, and E* vs T* for the rigid
homoprotein. The rigid homoprotein system displays mul-tiple phase transitions with a collapse transition at a T* of 2.5 and a first-order transition at a T* of 0.16. A lower-temperature transition is suggested by the peak in the weighted histogram Cv data at a T* of approximately 0.12; however there is too much variability in Cv data at such low temperatures to confirm this third transition. These transi-tions occur at lower temperatures than with the homoprotein model 共compare with homoprotein results of T*⫽2.6, 0.34, and 0.15兲, demonstrating that lower temperatures are re-quired to force the rigid homoprotein chain into compact conformations. The extra bonds introduced in the rigid model effectively work against compaction by holding next-neighbor and, in some cases, next-next-next-neighbor beads apart. Although the rigid homoprotein can collapse to a similar overall Rg* as the homoprotein, it is unable to make the FIG. 8. Reduced-squared radius of gyration (Rg*), reduced specific heat
(Cv*), and reduced energy (E*) as a function of reduced temperature (T*)
for the heteroprotein.
subtle structural rearrangements necessary to achieve similar low energies. At the lowest temperature studied (T*⫽0.1), the homoprotein has an E*of⫺5.25 and the rigid homopro-tein has an E*of⫺4.25. This difference can be attributed to decreased conformational freedom due to the increased num-ber of bonds in the chain.
We note that our downward shift in transition tempera-tures with increased model stiffness is contrary to the upward shift reported elsewhere for lattice47 and off-lattice48–50 Monte Carlo simulations of stiff square-well and stiff Lennard-Jones homopolymer chains. The difference is most likely due to significant differences between the model chains studied. Other reports have focused on the phase tran-sitions in homopolymer chains with uniform stiffness, where stiffness is introduced as an attraction between each bead, i, and its next-neighbor bead, i⫹2. In the models developed here, a nonuniform rigidity results from the three types of
bonds used in models共d兲through共g兲to mimic constraints in proteins关Figs. 1共d兲–1共g兲and Fig. 2兴. The first type of bond, a constraint between each bead, i, and its next-neighbor bead, i⫹2, generates a rigidity similar to that introduced in the other studies and causes the chain to maintain a zigzag shape. Figure 11 shows the geometric constraints resulting from the other two types of bonds. The fixed distance be-tween consecutive central beads of each four-bead monomer building block causes that pair of beads and the two inter-FIG. 11. Nonuniform rigidity in models 共d兲through 共g兲. Three four-bead monomer building blocks are shown; the central bead of each monomer is striped. Consecutive central beads along the backbone and the two interven-ing beads are fixed in a plane, as highlighted by the bold parallelogram on the left. All four beads of each monomer are linked in a pyramid shape, as shown with bold lines on the right. The fixed planes and pyramids propagate throughout the structure; one of each type is shown.
FIG. 12. Snapshots of the rigid homoprotein chain at T*of 0.15,共a兲and共b兲, and at T*of 0.10,共c兲. Backbone beads are dark gray; side chain beads are pale gray.
FIG. 10. Reduced-squared radius of gyration (Rg*), reduced specific heat
(Cv*), and reduced energy (E*) as a function of reduced temperature (T*)
vening backbone beads to remain fixed in a plane, as shown by the bold parallelogram in Fig. 11. In the final type of constraint, side chain beads are pinned to all three backbone beads of the monomer unit such that each monomer is fixed in a pyramid shape, as shown with bold lines on the right in Fig. 11. The consequence of this nonuniform rigidity is that rotational motion around different bonds is hindered to dif-ferent degrees, and the hindered motion opposes ordering of the chain.
The structures observed for the rigid homoprotein model reflect the influence of the extra geometric constraints de-picted in Fig. 1共d兲. With the homoprotein model, the collapse transition always results in spherically-shaped structures. However, in rigid homoprotein runs, collapse of the chain results in either spherical or ellipsoidal conformations, such as the ellipsoidal structure shown in Fig. 12共a兲 共front view兲 and 12共b兲 共side view兲 for a T* of 0.15. While the packing
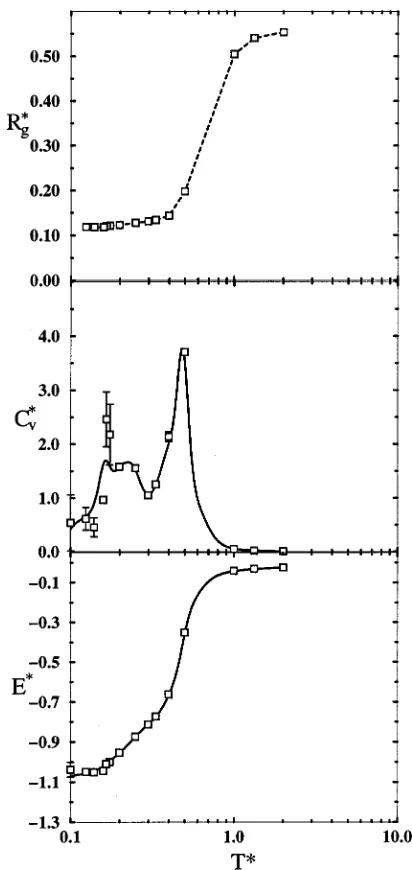
appears quite dense, lower-energy ordered structures, such as the one shown in Fig. 12共c兲 for a T* of 0.10, are possible. The extra bonds present in the rigid homoprotein model pre-vent the chain from adopting the cubic and hexagonal packed structures like those observed for the homoprotein chain. El-lipsoidal structures similar to those seen here were shown previously to be characteristic of semiflexible polymers.50,51 We also consider the effect of chain rigidity on phase transitions for heterogeneous chains by comparing the results from the heteroprotein model, Fig. 1共c兲 with those from the rigid heteroprotein model, Fig. 1共e兲. Figure 13 shows Rg*,
Cv*, and E* vs T* for the rigid heteroprotein. The rigid heteroprotein system displays multiple phase transitions with a collapse transition at a T* of 0.50 and a first-order transi-tion at a T* of 0.17. As in the comparison above for homo-geneous chains, the transitions for the rigid heteroprotein system occur at lower temperatures than for the 共nonrigid兲 heteroprotein system 共compare with heteroprotein results of
T*⫽0.55 and 0.19兲. Lower temperatures are required to force rigid chains into compact conformations. In contrast to the homogeneous results above, the rigid heteroprotein is able to achieve equally low energies as the heteroprotein 共compare Figs. 8 and 13兲. This can be explained by the fact that the side chains alone account for the energy of the sys-tem. The extra bonds in the rigid heteroprotein model make overall compaction more difficult; however, once the side chains are clustered in the center of the structure, they are able to make the rearrangements necessary to achieve low energy states.
The structures for the rigid heteroprotein model, such as the one shown in Fig. 14 for T*⫽0.16, are notably similar to those observed for the heteroprotein 共compare with Fig. 9兲. Again, it is the side chains that dictate structure in these heterogeneous models; the backbone beads are not involved in stabilizing equilibrium structures. Once the side chain FIG. 13. Reduced-squared radius of gyration (Rg*), reduced specific heat
(Cv*), and reduced energy (E*) as a function of reduced temperature (T*)
for the rigid heteroprotein.
beads have aggregated in the center of the conformation, the pseudobonds have little impact and do not prevent the for-mation of structures with local ordering of the side chains.
In a real amino acid residue, the backbone bond angles are fixed and the side chain is constrained to a particular location relative to the backbone atoms. These constraints severely limit the conformational freedom of the atoms in the amino acid residue and contribute to important features of folded protein structure, such as ␣-helices and -sheets. A protein model that utilizes multiple backbone beads to rep-resent a single amino acid residue should incorporate con-straints that mimic the concon-straints in real amino acid resi-dues. The rigid homoprotein and rigid heteroprotein models here include these important constraints in the form of extra bonds between next-neighbor beads and, in some cases, next-next-neighbor beads. The simulation results show that the rigid models 关Figs. 1共d兲–1共e兲兴, despite their decreased flexibility when compared with the nonrigid models 关Figs.
1共b兲–1共c兲兴, experience multiple thermodynamic phase transi-tions which qualitatively correspond to the stages of protein folding and successfully bury hydrophobic side chains, two important characteristics of a protein model.
D. Overlapping beads
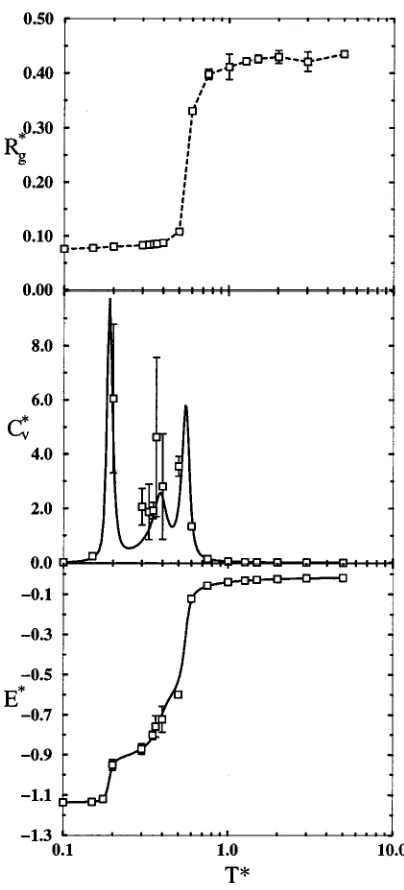
To study the effect of bead overlap, we perform simula-tions of the overlapping rigid homo- and heteroprotein mod-els shown in Figs. 1共f兲and 1共g兲, respectively. These models have bead sizes that are 1.5 times larger than in the previous five model systems, as depicted in Figs. 1 and 2. Figure 15 shows Rg*, Cv*, and E* vs T* for the overlapping rigid homoprotein. This system displays multiple phase transitions with a collapse transition at a T* of approximately 3.2, a first-order transition at a T*of 0.25, and a lower-temperature transition as suggested by the Cv data at T* approximately equal to 0.15. These transitions occur at higher temperatures than for the rigid homoprotein model 共T*⫽2.5, 0.16, and FIG. 15. Reduced-squared radius of gyration (Rg*), reduced specific heat
(Cv*), and reduced energy (E*) as a function of reduced temperature (T*)
for the overlapping rigid homoprotein.
0.12兲. The shift in transition temperatures and the ability to reach lower overall energies result directly from the greater range of attraction for each square-well bead in the overlap-ping rigid homoprotein model.
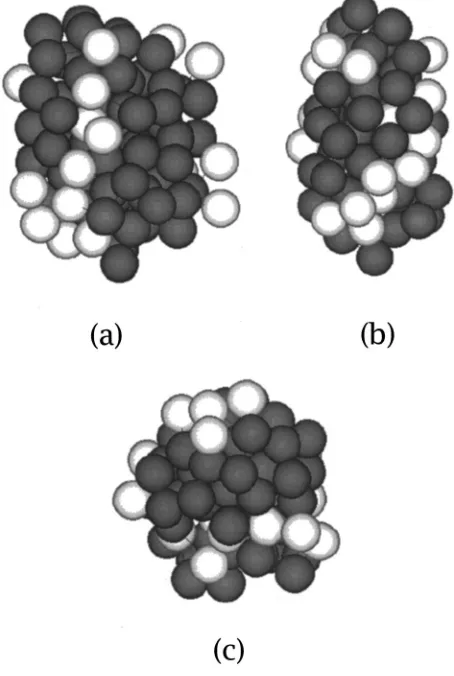
The structures observed for the overlapping rigid ho-moprotein model are similar to those for the rigid homopro-tein model and reflect the influence of the next-neighbor and next-next-neighbor bonds depicted in Fig. 1共f兲. In some overlapping rigid homoprotein runs, collapse of the chain results in rod-shaped conformations, such as the one shown in Fig. 16共a兲 共side view兲 and 16共b兲 共top view兲 for a T* of 0.23. Rod-like structures are shown elsewhere to be charac-teristic of semiflexible polymers.50,51Other low-temperature structures, such as the one shown in Fig. 16共c兲for a T* of 0.10 tend to be ordered and spherical. The extra bonds present in the overlapping rigid homoprotein model hinder the flexibility of the chain and prevent it from adopting
struc-tures with cubic and hexagonal packing similar to those ob-served for the simple homoprotein chain.
Figure 17 shows Rg*, Cv*, and E* vs T* for the over-lapping rigid heteroprotein model shown in Fig. 1共g兲. The overlapping rigid heteroprotein system displays multiple phase transitions with a collapse transition at a T* of 0.65 and a first-order transition at a T* of 0.17. The collapse occurs at a higher temperature than for the rigid heteropro-tein system 共compare to T* of 0.50兲, which can again be attributed to the longer-range attraction of the square-well beads in the overlapping rigid heteroprotein. The low-temperature transition seems to occur at the same tempera-ture as in the rigid heteroprotein system (T*⫽0.17). This probably results from the small number of hydrophobic beads in these systems共20 side chains兲and the heterogeneity of the chain. After the collapse transition, the side chains 共pale beads兲 are clustered in the center of the structure and the backbone共dark beads兲snakes around the outside. Subse-quent, lower-temperature transitions involve rearrangements of these relatively uncoupled side chain beads. Once the side chains have been segregated and tightly packed in the core of the structure, small changes in the range of the attractive wells are relatively unimportant. In contrast, the comparison above between the rigid homoprotein and the overlapping rigid homoprotein showed a shift in the low-temperature transition. In the homogeneous systems, all beads have at-tractive wells and small changes in structure can have a dra-matic effect on the overall energy depending on the range of the attractive well.
We observe similar side chain packing geometries for all heteroprotein models. As with the heteroprotein and rigid heteroprotein models, the overlapping rigid heteroprotein model displays symmetrical side chain conformations, such as the one shown in Fig. 18 for a T* of 0.16. Figure 18共a兲 shows the chain with reduced bead diameters to highlight the symmetrical arrangement of side chain beads. Figure 18共b兲 shows the same structure from a different angle with full-size beads to demonstrate the way in which the backbone snakes FIG. 17. Reduced-squared radius of gyration (Rg*), reduced specific heat
(Cv*), and reduced energy (E*) as a function of reduced temperature (T*)
for the overlapping rigid heteroprotein.
along the outer surface of the structure, encasing the hydro-phobic side chains.
Real protein atoms have significant overlaps. Space-filling pictures of proteins at the atomic level look more like the overlapping models introduced in this section than the five tangent-bead models discussed previously. To properly mimic real protein steric interactions, appropriate bead size to bond length ratios should be chosen when constructing a protein model. The results shown here indicate that overlap-ping chains are capable of displaying protein-like character. The overlapping rigid models are able to selectively bury hydrophobic side chains and experience multiple thermody-namic phase transitions which qualitatively correspond to the stages of protein folding.
IV. CONCLUSIONS
We have presented results from a series of simulations with different protein models in which we build from a simple, tangent, homopolymer chain to an intermediate reso-lution model containing several important modifications: branched geometry, heterogeneity, backbone rigidity, and overlapping beads. These four modifications provide a sig-nificant amount of physical protein-like character that is lacking in common tangent linear chain models. Although still simple representations of a protein, the models intro-duced in this work display some degree of protein-like be-havior in that the multiple transitions observed qualitatively correspond to structurally significant changes in the protein during folding.
We are currently investigating other modifications to the heteroprotein model, including the effect of a hydrogen bonding term and the competition between backbone– backbone hydrogen bond formation and side chain–side chain hydrophobic interactions. We find that the simple fea-tures introduced in this study, in concert with specific hydro-gen bonding and hydrophobic potentials, provide a signifi-cant amount of protein-like character.37 The resulting model may serve as the basis for studies of protein aggregation.
ACKNOWLEDGMENTS
We would like to thank Dr. Yaoqi Zhou for helpful dis-cussions and for providing the code for the weighted histo-gram analysis of simulation results. This work was supported by the GAANN Biotechnology Fellowship of the U.S. De-partment of Education. Partial funding was also provided by the National Science Foundation under Grant No. CTS-9704044 and the National Institutes of Health under Grant No. GM-56766.
1W. Wei, Int. J. Pharm. 185, 129共1999兲. 2J. King, Chem. Eng. News, April 10, 52共1989兲.
3E. DeBernardez-Clark and G. Georgiou, ACS Symp. Ser. 470, 1共1991兲. 4
H. R. Costantino, R. Langer, and A. M. Klibanov, J. Pharm. Sci. 83, 1662 共1994兲.
5S. P. Schwendeman, H. R. Costantino, R. K. Gupta, G. R. Siber, A. M.
Klibanov, and R. Langer, Proc. Natl. Acad. Sci. U.S.A. 92, 11234共1995兲.
6D. J. Selkoe, J. NIH Res. 7, 57共1995兲. 7M. D. Perng, J. Biol. Chem. 274, 33235共1999兲. 8
K. A. Dill, S. Bromberg, K. Yue, K. M. Fiebig, D. P. Yee, P. D. Thomas, and H. S. Chan, Protein Sci. 4, 561共1995兲.
9
K. A. Dill and H. S. Chan, Nat. Struct. Biol. 4, 10共1997兲.
10
C. Wilson and S. Doniach, Proteins: Struct., Funct., Genet. 6, 193共1989兲.
11
N. D. Socci and J. N. Onuchic, J. Chem. Phys. 103, 4732共1995兲.
12
D. Thirumalai and D. K. Klimov, Curr. Opin. Struct. Biol. 9, 197共1999兲.
13
E. I. Shakhnovich, Folding Des. 1, R50共1996兲.
14
A. R. Dinner and M. Karplus, J. Phys. Chem. B 103, 7976共1999兲.
15A. Irback, C. Peterson, F. Potthast, and O. Sommelius, J. Chem. Phys.
107, 273共1997兲.
16A. Sali, E. Shakhnovich, and M. Karplus, Nature 共London兲 369, 248
共1994兲.
17S. He and H. A. Scheraga, J. Chem. Phys. 108, 287共1998兲.
18J. N. Onuchic, N. D. Socci, Z. Luthey-Schulten, and P. G. Wolynes,
Folding Des. 1, 441共1996兲.
19T. Veitshans, D. Klimov, and D. Thirumalai, Folding Des. 2, 1共1997兲. 20S. Doniach, T. Garel, and H. Orland, J. Chem. Phys. 105, 1601共1996兲. 21Y. Zhou and M. Karplus, Nature共London兲401, 400共1999兲.
22Y. Zhou and M. Karplus, J. Mol. Biol. 293, 917共1999兲. 23K. F. Lau and K. A. Dill, Macromolecules 22, 3986共1989兲.
24E. I. Shakhnovich and A. M. Gutin, Proc. Natl. Acad. Sci. U.S.A. 90, 7195
共1993兲.
25N. D. Socci and J. N. Onuchic, J. Chem. Phys. 101, 1519共1994兲. 26
Y. Zhou, C. K. Hall, and M. Karplus, Phys. Rev. Lett. 77, 2822共1996兲.
27Y. Zhou, M. Karplus, J. M. Wichert, and C. K. Hall, J. Chem. Phys. 107,
10691共1997兲.
28W. Hu, J. Chem. Phys. 109, 3686共1998兲.
29C. Wu and X. Wang, Phys. Rev. Lett. 80, 4092共1998兲. 30
C. Wu and S. Zhou, Phys. Rev. Lett. 77, 3053共1996兲.
31
D. Bratko, A. K. Chakraborty, and E. I. Shakhnovich, J. Chem. Phys. 106, 1264共1997兲.
32C. J. Camacho and D. Thirumalai, Proc. Natl. Acad. Sci. U.S.A. 90, 6369
共1993兲.
33
H. Nymeyer, A. E. Garcia, and J. N. Onuchic, Proc. Natl. Acad. Sci. U.S.A. 95, 5921共1998兲.
34V. P. Zhdanov and B. Kasemo, Proteins: Struct., Funct., Genet. 29, 508
共1997兲.
35G. Iori, E. Marinari, G. Parisi, and M. V. Struglia, Physica A 185, 98
共1992兲.
36
O. B. Ptitsyn, Adv. Protein Chem. 47, 83共1995兲.
37A. V. Smith and C. K. Hall, Proteins: Struct., Funct., Genet.共submitted兲. 38B. J. Alder and T. E. Wainwright, J. Chem. Phys. 31, 459共1959兲. 39D. C. Rapaport, J. Phys. A 11, L213共1978兲.
40A. Bellemans, J. Orban, and D. Van Belle, Mol. Phys. 39, 781共1980兲. 41
S. W. Smith, C. K. Hall, and B. D. Freeman, J. Comput. Phys. 134, 16 共1997兲.
42S. Sun, P. D. Thomas, and K. A. Dill, Protein Eng. 8, 769共1995兲. 43S. Sun, Protein Sci. 2, 762共1993兲.
44S. Takada, Z. Luthey-Schulten, and P. G. Wolynes, J. Chem. Phys. 110,
11616共1999兲.
45
A. M. Ferrenberg and R. H. Swendsen, Phys. Rev. Lett. 63, 1195共1989兲.
46K. Shiokawa, K. Itoh, and N. Nemoto, J. Chem. Phys. 111, 8165共1999兲. 47J. P. K. Doye, R. P. Sear, and D. Frenkel, J. Chem. Phys. 108, 2134
共1998兲.
48Yu. A. Kuznetsov and E. G. Timoshenko, J. Chem. Phys. 111, 3744
共1999兲.
49Yu. A. Kuznetsov, E. G. Timoshenko, and K. A. Dawson, J. Chem. Phys.
105, 7116共1996兲.
50H. Noguchi and K. Yoshikawa, J. Chem. Phys. 109, 5070共1998兲. 51E. G. Timoshenko, Yu. A. Kuznetsov, and K. A. Dawson, Phys. Rev. E