Thesis by
Menachem Levanoni
In Partial Fulfillment of the Requirements
For the Degree of
Doctor of Philosophy
California Institute of Technology Pasadena, California
1970
ACKNOWLEDGMENTS
Some of the experiments reported here were carried out in collaboration with Dr. F.C. Zawislak and Dr. D.D. Cook. The author wishes to express his appreciation for their contributions to this work.
The author would also like to thank Drs. J.D. Bowman and E.N. Kaufmann who introduced him to the experimental technique and guided him during the early stages of this work.
Mr. H. Henrikson's contributions in designing the experimental apparatus, are gratefully acknowledged.
Finally, the author takes pleasure in expressing his sincere gratitude to Professor Fel ix Boehm for his constant interest and encouragement during the course of this work. Research with the Physics 34 group has been a pleasant and rewarding experience.
ABSTRACT
An automatic experimental apparatus for perturbed angular correlation measurements, capable of incorporating Ge(Li) detectors as well as scintillation counters, has been constructed.
The gamtna-garruna perturbed angular- correlation t.echnique -has been used to measure magnetic dipole moments of several nuclear excited. states in the osmium transition region. In addition, the hyperfine magnetic fields, experienced by nuclei of 'impurity' atoms embedded in ferromagnetic host lattices, have been determined for several '4d' and 'Sd' impurity atoms.
The following magnetic dipole moments were obtained in the osmium transition region
190
0.54 0.06 nm µ
+ (
Os) ±2
µ
+ (
1900s) 0.88 ± 0.48 nm 4192
0.56 0.08
µ
+(
Os) ± nm2
µ
+ (
192Pt) 0.56 ± 0.06 nm 2192
0.62 0.14
µ
+I (
Pt) ± nm.2
These results are discussed in terms of three collective nuclear models; the cranking model, the rotation-vibration model and the pairing-plus-quadrupole model. The measurements are found to be in satisfactory agreement with collective descriptions of low lying nuclear states in this region.
ferromagnetic hosts were determined;
H. (Cd Ni)
int - - (64.0 ± 0.8)kG H. (Hg Fe) .-
-
(440±
lOS)kGint
-H. (Hg Co)
-
(370±
78)kG int-H, (Hg Ni)
-
(86±
22)kG int-H. (Tl Fe)
-
(185±
70)kG int-H. (Tl Co) (90
±
35)kG int-H. (Ra Fe)
-
( 105±
20)kG int-H. (Ra Co)
-
(80±
16)kG int-H. (Ra Ni)
-
(30±
lO)kG, int-where in H. (AB),· A is the impurity atom embedded in the host lattice int
-B. No quantitative theory is available for comparison. However, these results are found to obey the general systematics displayed by these fields. Several mechanisms which may be responsible for the appearance of these fields are mentioned.
Finally, a theoret ical expression for time-differential per -turbed angular correlation measurement, which duplicates experi
I
TABLE OF CONTENTS
INTRODUCTION
_PAR]-~_!__: THE EXPERIMENT~_!.__ TECl!NIQ!!_E AN._l? __ EX_!'~}i!~E~'.l'J\ ~ APPARATUS
II DESCRIPTION OF THE PERTURBED ANGULAR CORRELATION TECHNIQUE
1. Introduction
2. The Directional Angular Correlation between Gannna Rays Emitted in Cascade
3. Perturbation of the Angular Correlation by a Static Magnetic Interaction
4. Perturbation of the Angular Correlation by Fluctu-ating Electric or Magnetic Fields
5. Methods of Analysis of Time-Differential and Time-Integral Measurements
III DESCRIPTION AND OPERATION OF THE EXPERIMENTAL APPARATUS 1. Introduction
2. The Correlation Table and its Operation 3. The Dual Slow/Fast Coincidence System 4. Production of External Magnetic Fields 5. Automatic Operation
6. Experimental Procedure
7
7
12
13
17
PART 2:
-
·
--
-
-
-
-
-
--
MAGNETIC MOMENT MEASUREMENTS IN THE OSMIUM-
- - -
-
-
-·
REGION
TV Tim MAGNETIC MOMENTS OF THE FIRST 2+ J\ND 4+ STATES l 90
IN 08
1. Introduction
2. Source Preparation
3. The 2+ State
4. The 4+ State
v
THE MAGNETIC MOMENT OF THE FIRST 2+ STATE IN 192os1. Introduction
2. Source Preparation
3. The Ganuna-Gamma Cascade
4.
The Method and ResultsVI THE MAGNETIC MOMENTS OF THE FIRST AND SECOND 2+ STATES
IN 192Pt
1.
2.
3.
Introduction
The First 2+ State
+
The Second 2 State
VII DISCUSSION OF EXPERIMENTAL RESULTS
1. Surrunary of Magnetic Moments in the Osmium Region
2. Col lective Nuclear Models and the Osmium Region (a) Introduction
(b) The Cranking Model
(c) The Rotation-Vibration Model
(d) The Pairing-Plus-Quadrupole Model
(e) Discussion
49
50 50 51
59
61
66
66
67
69
69
71
73
75 75 76
79 82
VIII
PART 3: HYPERFINE MAGNETIC FIELDS AT "IMPURITY" ATOMS
IN FERROMAGNETIC HOSTS
INVESTIGATION OF INTERNAL MAGNETIC FIELDS OF lllCd IN
NICKEL
1. Introduction
2. Preparation of Sources
3. The Gamma-Gamma Cascade
4. Experimental Procedure
5. Data Analysis and Results
IX THE INTERNAL MAGNETIC FIELDS AT Hg SITES IN Ni, Co,
AND Fe HOSTS
1. Introduction
2. Source Preparation and the Cascade
3. Results
X THE HYPERFINE MAGNETIC FIELDS EXPERIENCED BY Tl NUCLEI IN
THE FERROMAGNETS
1. Introduction
2. Source Preparation
3. The Gamma-Gamma Cascade and Results
XI THE MAGNETIC MOMENT OF THE 50 keV, 3/2 STATE IN 223Ra
AND THE INTERNAL MAGNETIC FIELDS ACTING ON Ra NUCLEI
DIFFUSED INTO FERROMAGNETIC HOSTS
l. Introduction
Z. The Magnetic Moment of the 3/2 State
89
90
90
91
94
95
103
103 106
107
107
109
111
3. Preparation of Ferromagnetic Sources 115 4. Experimental Techniques and Results 115
XII DISCUSSION OF EXPERIMENTAL RESULTS
1. Sunnnary of Experimental Results 118
2. Status of Theoretical Investigations 120
APPENDIX A: ANALYSIS OF TIME-DIFFERENTIAL MEASUREMENTS
1. Introduction 126
2. The General Theoretical Expression 129
3. Time Dispersion in the Detector System 130 4. Time Dispersion in the 'Electronics' Section 131 5. Time Response of the Detector-Plus-'Electronics'
System 132
6. The Modified Perturbed Correlation Function 133 7. Time-Dispersion in the Multichannel Analyzer 135 8. The Observed, Discrete Perturbed Angular Correlation
Function 135
9. Useful, Simplified Versions of the Observed Correlation 139
APPENDIX B: SOURCE THICKNESS EFFECTS ON ANGULAR CORRELATIONS 141
I INTRODUCTION
The measurements described in this manuscript deal with two,
related, branches of physics, namely nuclear structure and hyperfine
interactions. The conuuon factor is the experimental technique of
perturbed angular correlation, which very often makes use of
hyper-fine interactions as a nuclear probe. The discussion is presented
in three parts.
In part one the experimental technique and apparatus are
described. Chapter II reviews the perturbed angular correlation
technique. Perturbations relating from the interactions of nuclei
with their environment are discussed. Specific measuring techniques
and data analysis methods are also described. Chapter III describes
in detail an experimental apparatus which was used in most of the
measurements described below. This automatic system, capable of
in-corporating any combination of Ge(Li) and scintillation detectors,
has been used to improve existing measuring techniques. In effect,
it enables data collection and analysis at twice the rate of the
con-ventional system. The automatic operation of this system is
des-cribed in enough detail to permit easy duplication.
Part two is devoted to magnetic dipole moments of excited
states in the osmium region.
Nuclear ground-state spins and magnetic moments, determined
from nuclear magnetic resonance, atomic and molecular beam, and
optical spectroscopy experiments have played a large part in the
effect and perturbed angular correlation methods has permitted the
measurement of spins and moments of nuclear excited states. Based on these and other spectroscopic properties of excited states in nuclei, theoretical descriptions of nuclear structure have been developed, which account for many of the observed nuclear propert:l.e.s. In foct,
large deviations of measured magnetic moments from shell model
pre-dictions were instrumental in the discovery of collective ex
-citations.
Collective excitations in nuclei are usually divided into two groups; "spherical" nuclei exhibit energy spectra which could be explained in terms of vibrations about a spherical core. These are the so-called vibrational nuclei found near closed shells. The "deformed" nuclei display energy level bands, similar to those found in molecular spectra, which are described as rotational bands of a deformed rigid rotor. These nuclei are found in regions away from
closed shells. In between the spherical and deformed regions a third
class of nuclei is found. These exhibit large deviations from both the rotational and the vibrational excitation models. Such is the case of the osmium transition region, a region of disappearance of nuclear deformation. This region, which includes the isotopes of W, Os, and Pt, has been used for a number of years as a critical
testing ground of nuclear structure models. Chapters IV, V, and VI describe the measurements of five magnetic moments of low excited
190 192 192p
states in Os, Os, and t, respectively. The results are
discussed and compared with collective nuclear models, in Chapter VII.
rotation-vibration model, and the pairing-plus-quadrupole model. The
pairing-plus-quadrupole model currently offers the best microscopic description of collective excitatlons in nuchd, over a wi.de rt:mgt.• .. of the peri.odic table. It is the only successful collective model, so far, in which no a priori assumptions about the nuclear shape, were made. It is therefore capable of investigating "vibrational" nuclei, "rotational" nuclei, and in particular, nuclei in transition regions. Until recently, the osmium-transition region has been carefully avoided by theorists who wished to compare their pre-dictions with experimental results.
Part three deals with hyperfine interactions. This field has been growing steadily in recent years and provides valuable data in
the understanding of magnetic and electric properties of solids. Its growth started from within nuclear physics by experimentalists who, for the last ten years, have been utilizing the strong
hyper-fine interactions to probe the nucleus.
The hyperfine magnetic field at a nucleus of an atom in a ferromagnetic crystal has a complex origin. It involves phenomena incompletely understood even for the elemental crystals such as Fe, Co, and Ni. Substituting one ferromagnetic atom by an 'impurity' atom, further complicates theoretical investigation and indeed this problem is largely unresolved. These fields exhibit systematic oscillatory behavior (apart from the rare earths region) as a
recent attempts encountered difficulties in predicting the correct
signs of several observed fields (the sign is determined relative to
the external field needed to polarize the ferromagnetic domains).
The mechanisms responsible for these internal fields, are
pre-sumably known. However, theoretical investigations are very
difficult and reflect our poor understanding of the solid state and
in particular, magnetism. Chapters VIII, IX, X and XI describe
measurements of nine hyperfine magnetic fields. They were performed
on Cd, Hg, Tl, and Ra nuclei, embedded in the ferromagnetic host
lattices of Fe, Co, and Ni. The measurement on Cd was a search for
internal magnetic fields other than the field experienced by those Cd
nuclei whose atoms are located in regular sites. The Hg measurement
resolved large discrepancies in earlier results. The measurements on
Tl and Ra are particularly important since they are in regions where,
from systematics, one expects the hyperfine fields to change their
signs. As such, these measurements are sensitive tests of
forth-coming hyperfine interaction models. In Chapter XII the experimental
results are summarized. The status of current theoretical
investi-gations is also discussed.
Appendices A and B treat two experimental difficulties
related to the measuring techniques. In Appendix A an expression is
developed for the time-differential perturbed angular correlation
measurement, which takes into account all time-dispersions in the
response of various components of the experimental apparatus to
timing information. The importance of the various terms in it is
sources, used in an angular correlation experiment, are discussed and the necessity for use of thin sources in the case of low energy gamma rays is demonstrated.
The large number of individual experiments reported here made a concise description of them a necessity. These experiments
PART 1: THE EXPERIMENTAL TECHNIQUE AND EXPERIMENTAL APPARATUS
The perturbed angular correlation technique is an
experimental method which permits the measurement of the
Larmor precession frequency of the magnetic moment (or
spin) of an excited state of a nucleus, under the
influ-ence of a static magnetic field. It makes use of the
fact that the prc(c>rred direction of cmisi-don of elec
tro-magnetic radiation from a radioactive nucleus depends on
the nuclear spin orientation in space. The experimental
system consists basically of two, garruna sensitive
de-tectors. One detector is stationary and is used to
de-fine a preferred direction in space with respect to
which the other, movable detector is used to trace the
angular correlation pattern. The introduction of high
resolution Ge(Li) detectors, made possible the use of this
technique in many cases (such as the ones described here)
of Lntcrest to the nuclear physicist as well as the solid
11. DESCRIPTION OF THE PERTURBED ANGULAR CORRELATION TECllNIQUE
I I . l Introduction
In 1950, Brady and Deutsch(l) recognized the possibility of
measuring the g-factors of nuclear excited states using an anisotropic
angular correlation between gamma rays emitted in cascade. Aeppli et
al. (2) performed the first such measurement in 1951. Since that time
the t1c~clmique has been used extensively, and improvements in
elec-t1·onics and radiation detectors in recent years have allowed the
m~~asurcmcnl of moments previously inaccessible . The complete
mathe-matical treatment of the theory of angular correlations is to be found
in several comprehensive articles(3). A short outline of the
theo-retical results needed to analyze data collected in our experiments is
presented below.
11.2 The Directional Angular Correlation between Gamma Rays Emitted in
Cascade
The probability of emission of a gamma ray from a nucleus depends
on the angle between the emission direction and the nuclear spin axis.
Gctwra 1 ly, in a radi.oactive sample the nuclear spins are randomly
or.iented leading to an isotropic emission pattern for gamma rays.
How-ever, the observation of the direction of emission of the first gamma
ray of a gamma-gamma cascade selects an ensemble of nuclei whose spins
have a preferred orientation in space relative to the observed
propa-gation direction. If one then measures the emission direction of the
second member of the cascade, i t will in general show an anisotropic
- - - I
I,
T
- - - I
f
Figure 1
[image:16.558.110.441.81.559.2]H
DETECTOR I
DETECTOR 2
I
Figure 2
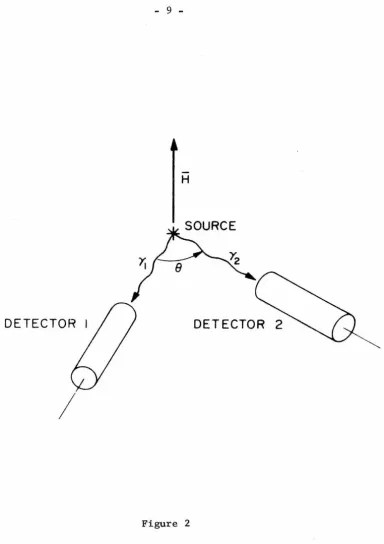
[image:17.557.81.465.49.593.2]An idealized garrnua-ganuna cascade is depicted in Figun! l, where I i ' I, and If arc the spins of the initial, intermediate, and f.ina·1
state., respectively. The two ganuna rays, y
1 and y2, have multi-polarities (1
1, L1') and (12, 12 1
) . The notation (L,L') indicates a possibly mixed multipole transition: for instance, for a mixed Ml
+
E2(or El
+
M2) transition, L and L' would be equal to l and 2, res-pectively. If y1 and y2 are detected by counters separated by the angle
e
in the geometry shown in Figure 2, then the probabilitydis-tribution for the observation of y
2 at the angle
e
relative to y1 isgiven by k
max
W(8) a;; 1
+
L
AkkPk(cos 8). k=2(even)
(1)
The Pk(cos G) are Legendre polynomials and the coefficients Akk depend on the spins of the nuclear states, Ii, I, and If' and the multipolarities of the two ganuna radiations, (L
1, L1') and (12, 12 1
) . It turns out that the Akk can be written in the factored form(l),
(2)
where Ak(y
1) and Ak(y2) each depend on the properties of only one of the transitions of the cascade. For a mixed multipole transition, Ak(y) has the explicit form(4),
where the Fk are tabulated coefficients(S) and the mixing amplitude 5 is defined as the ratio of the reduced transition matrix element for
(4)
A similar expressions holds for Ak(y
2). Thus, the measurement of Akk can determine the size and sign of a mixing amplitude.
In practice, radiation detectors subtend a finite solid angle. Therefore, the detection of y
1 and y2 indicates that the angle between emission directions falls in a range of angles centered about
e
.
Also the detection efficiency for gamma-ray pairs within this range of angles is not uniform, because the efficiency of each detector depends on the path length traversed by the radiation in the active detector volume. The replacement of Akk in Eq. (1) by Qk Qk Akk is needed to
1 2
1
2
.
account for these effects, where Qk and Qk are correction factors for the smearing of the angular correlation in the detector accepting y
1 and y2, respectively. In the following, the Qk,s will not be written explicitly but are understood to be present in all expe ri-mentally measured angular correlation coefficients. The index k of
tlw sum in Eq. (1) must satisfy the inequality
(Sa) for mixed multipole radiation and
(Sb) for pure multipole radiation. In all measurements reported here, k is not greater than 4.
II.3 Perturbation of the Angular Correlation by a Static Magnetic
Interaction
The presence of an electromagnetic field at the nucleus, while it
is in the intermediate state with spin I, will cause transitions among
the (2I
+
1) magnetic substates corresponding to different projectionsof the spin on the chosen direction of the quantization axis. In
other words, the preferred direction of orientation of the spin vector
in the intermediate state is altered, thereby changing the angular
correlation. The application of a static magnetic field causes a
precession of the nuclear spin about the applied field direction with
the Larmer frequency
(6)
-in which H is the applied magnetic field, g is the nuclear g-factor
of the intermediate state, and µN is the nuclear magneton. If
H
isperpendicular to the plane of the detectors (cf. Fig. 2) and y
2 is
emitted after the nucleus has been in the intermediate state for a
time t , then the angular correlation pattern will be of the form, k
max
W(9,H,t) oC 1
+
L
AkkPk(cos(e - (l)t)). (7)k=2
(even)
The observed pattern is obtained by multiplying Eq. (7) by the
probability that y
2 will be emitted at time t after the
emission of y
1. This is given by a Poisson distribution.
1 -t/T .
P(t)
=
-
e where T is the mean life of the intermediate state inT
k max
1 -t/T
G
I
AkkPk(cos(B - mt ) jWT(B,H,t) oC - e
+
T
k=2 (even)
k max
oC
l
-t/TG
+
I
bk cos (kB -k
m
t~
(8)e
T
k=2 (even)
k max
oel
e -t/T~
+
I
ck(cos (B - mt))k]T
k=2 (even)
where
1
+
and
1 -
2
1
+
B
3
A44Equation (8) describes the pattern which would have been observed experimentally if the experimental apparatus had a perfect time
response . However, since the correlation apparatus has a character-istic resolving time
TO'
the observed pattern depends on the relative magnitudes of TO and the mean life of the intermediate state T· IfTO<<
T
the observed pattern resembles closely that of Eq. (8). Ifresponse of the apparatus is taken into account in data analysis. Appendix A describes in detail the intrinsic time dispersions in the various components of a typical experimental apparatus and presents a modified expression) for the time differential perturbed angular correlation) which duplicates experimental conditions. If
TO
>>
T
the observed correlation pattern will be that of Eq. (8)) integrated over all time) resulting in the integral correlation
00 k
max
bNcos(Ne - N.6.e)
·
----
if
-th
I
W (e) H) = ~ e w(e)H)t)dt oC1
+
J1
+
(Nmr) 210 N=2
(9)
(even) where tan (N6e)
II.4 Perturbation of the Angular Correlation by Fluctuating Electric or Magnetic Fields
knowl-edge of ' f ' at the earlier time ' t - T'. Abragam and Pound(6) assume that the form G(T)
=
G(O)·exp(-T/T) applies to the case of a liquidc
source. The constant T , so defined, is known as the correlation time c
and represents the time after which f(t) has significantly changed its value. When taking the time-dependent perturbating fields into
account, they find that Eqs. (1) and (7) are modified to
and
k
max
W(El,t) ciC: 1
+
L
exp(-A.kt)AkkPk(cos El) k=2(even)
k
max
W(G,H,t) oC 1
+I
k=2 (even)
(10)
respectively. The exponential character of the at tenuation factors has been predicted by Dillenburg and Maris(l) for an interaction random in space and time, regardless of the nature, strength, or frequency of the interaction. The constant A.k is proportional to the correlation time T .
c
S
peci ica .f.11
y, f or an e ectric interaction1
.
.
.
( 8 )
A. c (1
+
l)(21+
3 )~
0 (1 - (21+
l)W(l2kl,ll)], T (efin ) 2 ( -:,.d2Zi ) 2k 40 (21 - 1)1
(12) d f . . . (8)
an or a magnetic interaction
1(1
+
1) (gl-1N:int) 2(1 - (21
+
l)W(Ilkl,II)]. (13) The undefined quantities are the elect r ic quadrupole moment of theintermediate state,
Q,
the g-factor of that state, g, the electric2 2
respectively, and the Racah(9) coefficients, W.
The total time integrated correlation functions corresponding to
Eqs. (10) and (11) are
k max
W(G) oc. 1
+I
GkkAkkPk(cos e)k=2
(even)
and, the complex but manageable expression for k
4,
max
(14)
(15)
respectively, where tan(N68Nk)
=
NmrGkk and Gkk=
1/(1
+ ~
kT).These effects are clarified by the following simple argument. The
integrated correlation function including the exponential attenuation
is given by
k max
W ( 0, H) CC 1
+ )
~ k=2
(even)
using the substitution t
=
k
max
w
c
e
,
H) o<. 1+
L
k=2(even)
00
- mt))dt (16)
1
- - - - T
1
+
~kT=
GkkT we obtain- mGkkT)) dT . (17).
Equation (17) is seen to be identical to the expression for W(B,H)
which has the angular correlation coefficients Akk
=
Akkc22, and
which is rotated with the Larmor precession frequencies
w' =
kk Therefore, not only is the angular correlation
attenu-ated, but also the precession frequency is effectively reduced.
In the measurements on osmium and platinum, the radioactive atom
is assumed to be located in a regular lattice site of cubic Fe metal.
The short intermediate state lifetime, T "" 10 -11 sec., and the absence
of ;:m electric quadrupole interaction in a cubic synunetry lndicatc
the product A. ·1 Ls very small and the integra·l attenuation coeffi.cic11L11 k
Gkk are approximately unity. The g-factor measurement of the 50 kcV
223
state in Ra was performed with a
has a rather long lifetime (T
=
9.1liquid source.
-10
x 10 sec) so
Also, this state
that considerable
attenuation was expected. However, no such attenuation could be
found and the angular correlation coefficients (corrected for finite
solid angles subtended by the detectors) agreed well with the
theoretical values given by Eqs. (2) and (3).
On the other hand, the attenuations found in the Ra Ni, Ra Co
and Ra Fe sources cannot be explained as resulting from magnetic
interactions. Scattering of the 50 keV gamma ray in the source
material is partially responsible for the observed attenuation while
electric quadrupole effects could explain the rest.
II.5 Methods of Analysis of Time-Differential and Time-Integral
Measurements
In a time-differential measurement, the Larmor frequency of
magnetic field is usually reversed periodically and the quantity k
R(B,t)
max
'\:""'
~ bksin(kB)sin(kmt) k=2
=
(even)k
WT(B,+H,t) - WT(B,-H,t) WT (
e'
+H' t)+
WT (e
' -
H' t)1 +
fx
bkcos(kB)cos(kmt) k=2(even)
(18) which is independent of the lifetime of the intermediate state, is
111
determined. The measurements in Cd (Chapter VIII) were analyzed in terms of the difference WT(B,+H,t) - WT(B,-H,t) and the mean life of the intermediate state was also determined.
In all other measurements, the integral correlation was observed. In such cases, the spin rotation angle ffiT is determined. It represents the mean angle of precession of the nuclear spin while in the inter-mediate state.
Three different methods are often used in obtaining ffiT.
(a) In the integral-rotation method, the angular correlation is measured first without and then with the perturbing magnetic field and the mean precession angle ffiT is determined from Eq. (9). The
+
190measurements of the 2 state of Os and of the Ra Fe alloy were performed with an improved version of this method in which the angular correlation parameters and the field effect parameters were deter-mined simultaneously.
(b) In the integral-reverse-field method, the magnetic field
R(B)
w
<
e,
+H) -w
<
e
, -
H)W(B,+H) + W(B,-H)
(19)
which is independent of the normalization of the function W(O,H),
is determined. In most available cases,
IDT
<<
l . Equat·ion ('19) tlwnsimplifies considerably and one gets:
R(O)
-2b
2sin(28) - 4b4sin(48) 3
b (2e) + b4cos(4e)
illT
+or(illT)
J.
1
+
2cos (20)Thus, the field reversal ratio R(B) is proportional to the mean
precession angle
an-
.
The proportionality constant representsthe logarithmic derivative
"(j;1
(8) /W (8) of the angular distribution.Most of the measuremenm described below were performed using this
method.
(c) Equation (9) was derived on the assumption that each detector is
used to detect only one gamma ray in the investigated cascade. If,
however, both detectors are used to detect both y
1 and y2, the
ob-served correlation is described by a superposition of two functions
of the form
(9),
describing rotations in opposite directions. Arotation is no longer present and only an attenuation of the angular
correlation pattern can be observed:
k
max
W (
e
,
H) oe 1+
~
atten L-.J
N=2 (even)
2
1
+
(NillT)cos (NB) · (21)
Use of this, the integral-attenuation method is limited to cases in
which the mean precession angle is appreciable
(illT
~ 1) because ofcounting statistics. Also, only the magnitude of
illT
can be determined190
Os and the Ra Fe alloy mentioned above1 the two opposite pre
-cessions can be separated1 a significant improvement is achieved.
In all integral measurements the quantity actually determined is the mean precession angle. At present1 a value for mr of about
0.01 radians is the smallest one can measure with good accuracy. For
-9
a g-factor of ~ 0.3 and a mean life of~ 10 sec, Eq. (6) indicates that a magnetic field of about 6 kG may be sufficient to produce a measurable mr. This is the case for the measurement of the magnetic
223
moment in Ra described in Chapter XI. In the measurements on osmium and platinum (cf. part 2) the lifetimes of all but one of the
-11
investigated states are of the order of 10 sec. For these, a magnetic field of at least 500 kG is needed. No laboratory magnet can produce such a large field. In these cases, the large internal hyperfine.fields at the sites of osmium or platinum nuclei in a ferromagnetic lattice were utilized in the measurements of magnetic moments. On the other hand, in the measurements on thalium, mercury,
rn.
DESCRIPTION AND OPEHATION OF 'J'llE EXPEH.IMENTJ\l. Al'PJ\l{J\'l'LJSIII.l Introduction
The perturbed angular correlation apparatus described below was constructed during the spring and summer of 1968. The cor-relation table was designed by Mr. H. Henrikson of Physics 34, and
all parts were expertly machined by Mr. V. Stephensen at the central
engineering shop. Digital electronic circuits, necessary for com-plete automation of the apparatus were designed and built by the .:1uthor, as well as several interface units (routing, gating, etc.).
Comn1L'1·c.i<1l units wt>re used in the coincidence circui.ts th<~mselves.
Actual experimentation with this apparatus started in September 1968. The design criteria of the apparatus were as follows. It
should be reliable over an extended length of ti.me. Its properties
should be independent of small temperature fluctuations with time. It should be capable of using two Ge(Li) detector systems, two
scintillation spectrometers, or a combination of both types. It
should be capable of mounting small aligning magnets as well as
Large electromagnets, and it should be fully automated. The results are described in detail, below.
III.2 The Correlation Table and its Operation
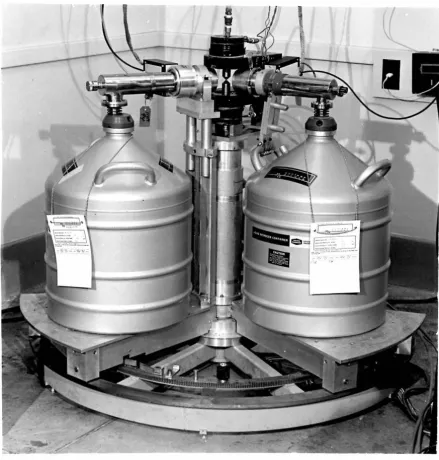
The correlation table, shown in Figs. 3 and 4, consists of four sections: a circular rail, a motorized carriage, a clamped
carriage and a center post.
The circular rail supports both carriages and the center post.
Figure 3· The correlation table uti lizing two Ge(Li) detectors. The radioactive source is fixed between the pole tips of the
magnet on the center post. The motorized carriage is at
[image:30.557.58.498.102.562.2]carriage is clamped in a fixed position while the other is <illowc·d to rotate through a maximum angle of 180°. A J/50 HP, 115 VDC motor is mounted under the rotating carriage. A spur-gear on the motor shaft engages a large diameter ring-gear which is concentric with the circular rail. The two detector systems are set on their
respective carriages, facing the center post. The center post supports the aligning magnet and the radioactive source. Its height is adjustable to allow lining up of the source with the detectors.
Angular positions are precisely marked on the rail, in steps of 1°. In addition, there are seventy-two holes in increments of 5° on the rail. One-half inch diameter steel pins are secured, at preset angles, in their respective holes (special attachments are available for any angle between two holes). The moving system is stopped at the preset angles by means of a latching device. The accuracy of this arrangerrent is better than one minute of arc.
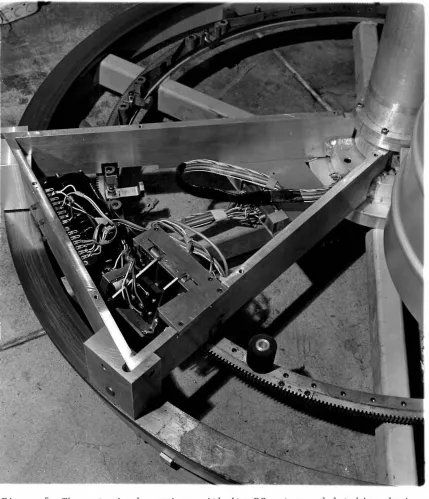
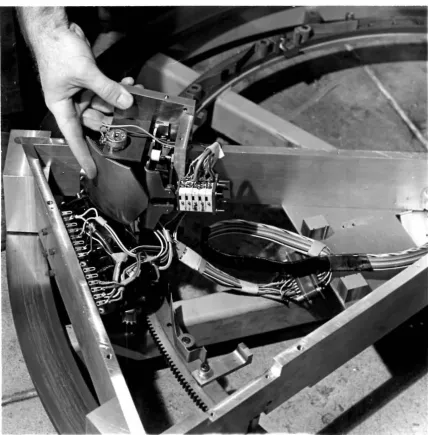
The latching device, shown in Figs. 5 and 6, is located in-side the motorized carriage. It consists of a spring loaded latching yoke, a potentiometer, a push-button switch and a solenoid. The
latching yoke engages the steel pins on the rail. The potentio-meter controls the current supplied to the motor's armature circuit
(cf. Fig. 7). The switch is of the double-pole, double-throw type. When actuated, it first opens the motor's armature circuit, stopping
the motor. It then shorts the armature circuit to supress harmful
Figure 5: The motorized carriage with .Lts DC motor and latching de.vice. The solenoid which disengages the latching yoke and the
"brake" switch which stops the motor, are clearly visible.
[image:33.553.69.498.79.578.2]Figure 6: The motorized carriage with the latching device partially removed. The latching yoke, potentiometer and the series of
[image:34.557.60.489.111.546.2]Two other mechanisms are also located under the motorized carriage (cf. Fig. 6). The first consists of two push-button
switches, one on each side of the carriage. When the proper one is actuated it triggers a latching relay located inside the control panel. The latching relay, in turn, reverses the motor's armature current. This reverses the direction of rotation of the moving system. The second mechanism is a series of four push-button
switches. Depending on the angle at which the moving carriage stops, a different switch is actuated. This information is essential in monitoring the operation of the correlation table (cf. Sec. III.4). It is also used in the routing of the coincidence spectra (cf. Sec. III.3).
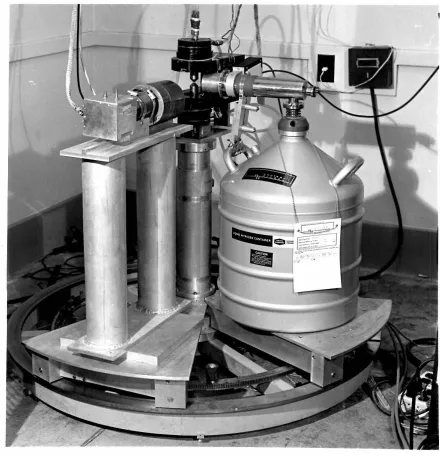
It should also be mentioned that both carriages were
specifically designed to carry the full load of Ge(Li) detectors with their associated liquid nitrogen, cryostat/dewar systems.
However, mountings for scintillation counters are also availabJe, as seen in Fig. 4.
The operation of the correlation table will be described next. The reader is frequently referred to Figs. 7 and 8. These figures describe the controls of the system. Several of these controls are also duplicated on the control panel for manual operation.
POWER FROM PANEL
.75 Amp
FIELD
CURRENT
Figure 7
ARMATURE
CURRENT
Power circuit and motor speed controls for the 1/50 HP, 115 VDC motor.
The potentiometer P
1 and P2 control the motor armature current and
POWER TO RECTIFYING CIRCUIT
115
VAC
l\RMATURE
CURRENT
C.W. C.C.W
.75 Amp.
._-~-~~-+-~~~~~~~...-~~~
LATCH ING
.----+--<...-.----. RE LAY
FIELD
I
I
I
I
L _
CURRENT
g
:
©
FIELD
(TABL.E)
(PANEL)
ARMATURE
(TABLE)
®
MOTOR START (FIG. 16)
II
SOLENOID
[image:37.553.82.456.118.529.2](TABLE)
Figure 8
,-1
I
I
CD
C.C.W0
~(TABLE)
I
REV SW.
l<TABLE)
I
©cw
I
LP•NEL!_
___
J
Control circuit for automatic operation of the correlation table.
power. It then actuates switch No. 2 which supplies power to the
rectifying circuit (Fig. 7). At this time, the motors' field-coils
(C) are energized but no current is supplied to its armnturc
cir-cuit. Swi.tch J is actuated last and supp'lics curn·nt Lo L11t•
armature circuit (D) via contacts (E) on the latching relay. The
motor is now turning and the motorized carriage is rotating about
the center post. Its rotation speed is set by a potentiometer
(P
1 in Fig. 8 ) on the control panel. As the moving system
approaches its intended stopping angle, the latching yoke (cf.
Fig. 6 ) is slowly raised by special guides on the correlation rail
(cf. Fig. 4) . The yoke in turn, slowly turns potentiometer P 2
(Fig. 5) . As a result, the motor's armature current is reduced,
and the moving system smoothly slows down. When the intended
stopping point is reached, the spring-loaded yoke starts its motion
toward the pin on the rail. This actuates the "brake" switch (F)
which stops the motor by first opening the armature circuit and then
shorting it. The system is set in motion again when the solenoid
(G) is actuated. This is done, manually or automatically by
closing the power circuit at (H). When the moving system reaches
one of its end points, the appropriate reversal. switch (I) is
actuated. It, in turn, actuates the latching relay at (J), which
then reverses the motor's armature current via contacts (E).
III.3 The Dual Slow/Fast Coincidence System
A block diagram of a dual slow/fast coincidence system is
H.V. SUPPLY H.V. SUPPLY
DISCRIMINATOR----.. ---DISCRIMINATOR
AMPLIFIER
SINGLE
START
VALID STOP
TIME TO AMPLITUDE CONVERTER
TAC OUT
INPUT MULTI-CHANNEL ANALYZER
GATE
STOP
VALID STOP
CONFIGURATION RELAY
CONFIGURATION RELAY
SLOW SINGLE
AMPLIFIER
CHANNEL ~---- COINCIDENCE SLOW CIRCUIT
COINCIDENCE ----tCHANNEL
CIRCUIT ANALYZER
ANALYZER
SINGLE
CHANNEL i - + - e - + - - - + - - - + - - - . . SINGLE CHANNEL ANALYZER
... ---1---+---..,--....
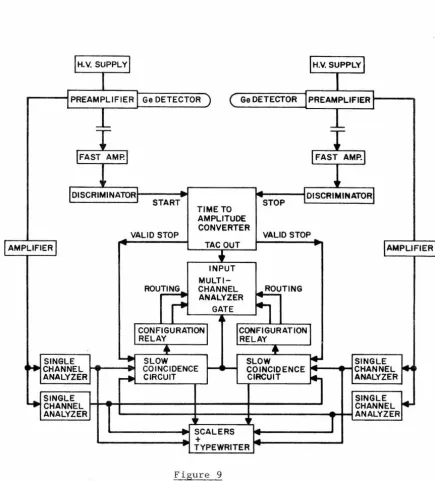
+-1ANALYZERFigure 9
Block diagram of the dual slow/fast coincidence circuit for two
[image:39.558.66.501.86.567.2]H.V. SUPPLY H.V. SUPPLY
Nol DETECTOR
DISCRIMINATOR DISCRIMINATOR
AMPLIFIER
SINGLE CHANNEL
ANALYZER
SINGLE CHANNEL
ANALYZER
START STOP
TIME TO AMPLITUDE CONVERTER VALID STOP
SLOW
COINCIDENCE
CIRCUIT
TAC OUT
INPUT
VALID STOP
AMPLIFIER
SLOW SINGLE
COINCIDENCE ----~CHANNEL
CIRCUIT ANALYZER
SINGLE CHANNEL
. . _ - - - + - - - + - - - 4 . . - + - ! A N A L Y Z E R
Figure 10
[image:40.558.65.485.85.526.2]detectors. A similar system (Fig. 10) was used for scintillation
counters. The system consists, basically, of two slow/fast
coincidence circuits, coupled to a single time-to-amplitude
con-verter (TAC). The two coincidence circuits operate in parallel
independently of one another. Data are stored in appropriate
sections of a multichannel analyzer (MCA). A digital routing
cir-cuit controls the routing of input data. Also, other data, important
for monitoring the operation of the correlation apparatus, are
stored in counting scalers and printed out at regular intervals.
A slow/fast coincidence circuit consists of two sections.
The 'fast' section is sensitive mainly to time differences between
any two gamma rays, detected by the two detectors. There is
prac-tically no energy discrimination in this section and therefore no
information (except in very special cases) about any particular
cascade. This section simply tells us that two gamma rays were
detected, one in each detector, with a known delay between them.
However, by making the resolving time of this section extremely
short, it discriminates against random coincidences. As a result,
the majority of coincidences it reports are 'true' ones, belonging
to a real cascade although not necessarily to the investigated one.
The 'slow' section on the other hand, is energy sensitive. It
selects the gamma-ray energies which belong to the cascade under
investigation, and rejects all others. It does not discriminate
against random coincidences and accepts all gamma rays which satisfy
the energy conditions, regardless of their origin. Coupling the two
efficiency in selecting a particular cascade out of the multitude
of gamma rays of different energies and different origins, emitted
by a radioactive source.
In Fig. 9, the 'fast' section consists of the following
com-ponents: two 0.01 µf capacitors, which differentiate the output
pulses from the charge-sensitive preamplifiers (ORTEC model 118A).
Two fast amplifiers (EG
&
G model AN 201/N) which amplify andshape the timing pulses. The outputs of two fast discriminators
(EG
&
G model T 105/N) are~triggered when t heir inputsexceed their preset threshold levels, and a TAC (EG
&
G modelTH 200 A/N), which converts the time delay, between its 'start' and
'stop' input pulses, to a proportional voltage pulse. A TAC
resolving time of 100 nsec is often used as the 'fast' coincidence
requirement. The 'slow' section consists of two linear amplifiers
(Canberra model 1416), and two single-channel analyzers (ORTEC model
406A) which select the appropriate gamma-ray energies and reject all
others. The use of this 'slow' section, coupled to two higher
resolution Ge(Li) detectors makes it possible to investigate
parti-cular cascades with radioactive sources, whose energy spectra are
highly complex. This was not possible with scintillation
spectro-meters which have an energy resolution which is an order of mag
ni-tude worse than the resolution of Ge(Li) spectrometers. The two
'slow' pulses from the single-channel analyzer, and the 'fast'
valid-stop pulse of the TAC output (corresponding to a successful
com-pletion of a time-to-amplitude conversion) enter a 'slow' coincidence
The time spectrum from the TAC is stored in the MCA which is gated by the triple coincidence output pulses of the coincidence circuit. These pulses are also used to route the time spectrum to different sections of the MCA (corresponding to the different angles in an angular correlation measurement, or to the opposite magnetic field dircctLons in a field reversal measurement).
SLnce each spt~ctrometcr is capable of detecting both gamma rayl:l in the investigated cascade, it is obviously advantageous to use two such coincidence systems, simultaneously. In this case (Figs. 9 and 10) one coincidence system uses y
1 from detector A and y2 from detector B, while the other uses y
2 from detector A and y1 from detector B.
The advantages of such a system are twofold: It increases the counting efficiency of the conventional coincidence system by a factor of 2 since the two coincidence systems operate independently of each other; also, since the roles of the two gamma rays in one
coincidence system are reversed in the other, it makes possible the simultaneous observation of the two opposite precessions of the angular correlation pattern in a transverse magnetic field (see Sec. II.5). The TAC time spectrum, stored in the analyzer,is
therefore a superposition of two time spectra. It thus results in a
possible to determine the angular correlation coefficients and the me;m
prpcessi.on angle, in one step. This is a significant improvement fur the usua I Ly t imc>-consuming, c:oinc iclencc t•xper lments.
III.4 Production of External Magnetic Fields
Two types of electromagnets were used in the various ex
peri-ments.
All measurements of magnetic moments in the osmium region
utilized the strong internal magnetic fields of impurities in Fe
lattice host. For these cases, the small polarizing field, needed to
align tlw magnetic domains in the host, was supplied by the
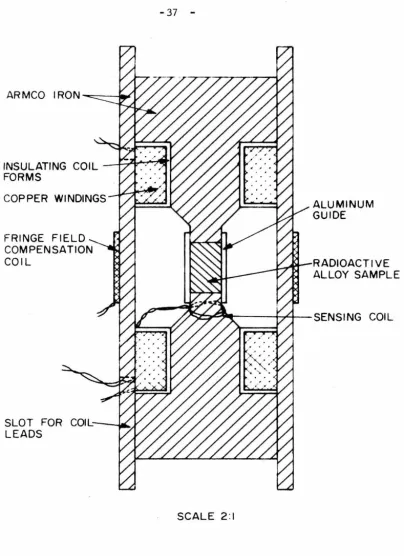
'mini-mngnet ' shown i.n Fig. 11. This magnet consists of a smaJ 1, fully
enclosed, cylindricaLly symmet ric, electromagnet, having a ' toroidal H' geometry. The coined source is used to complete the continuous
flux return path. This magnet design minimizes external fringing
fields in the region of the radiation detectors. To further reduce the stray fields, a compensation coil which carries an adjustable fraction of the magnet current is wound on the magnet body. In this
way, the stray field due to the magnet can be reduced to less than
-3
10 G in the region of the detectors. A current of 2 amperes
through the magnet coils completely aligns the Fe source. This can
be seen in the field saturation curve shown in Fig. 12, taken with a
ballistic galvanometer.
All other measurements were performed with a water cooled
electromagnet , capable of producing a field greater than 30 kG in a
INSULATING COIL -~~~l'I FORMS
COPPER WINDINGS
FRINGE FIELD COMPENSATION COIL
SLOT FOR COll---.1.1111.. LEADS
SCALE 2:1
Figure 11
ALUMINUM GUIDE
RADIOACTIVE ALLOY SAMPLE
Cross-section of the "toroidal H" magnet used in the measurements on
[image:45.567.77.482.46.602.2]-
(/)15
-
c
::::>
~
13
'lo-
•
0
•
'lo--
•
...Q
11
•
'lo-<(
•
-
>-I-
9
(/)
z
w
0
7
x
::::>
_J
5
LL
u
I-3
w
z
<..!)<(
~
I
0
.2
.6
1.0
1.4
1.8
2.2
2.6
3
.
0
MAGNET
CURRENT (Amperes)
Figure 12
Field saturation curve for a typicaf ferromagnetic source. Operating
current is 3.0 amps . Curve was obtained through the use of a
[image:46.556.48.487.104.614.2]Figure 13
COOLING WATER INLETS ANO OUTLETS
ARMCO IRON MAGNET CASE (4" DIAMETER)
Cutaway view of the high-field electromagnet used in the 198Hg, 203Tl
d 223 .
[image:47.567.100.457.53.618.2]The iron magnet body, which serves as a flux return path, was designed to minimize external fringing fields. A current of approximately 20 amperes was drawn from a programmable de power supply (Sorenson model DCR 60-25). When the magnetic field had to be reversed, the problem of arc suppression, which arises when the current through an inductive load is abruptly changed, had to be dealt with. This was done in several steps: First the small control current of the power supply was shut off bringing down the magnet current. Then the magnet current was reversed through the use of a relay. In the last step, the control current was brought up to its former level restoring the magnet current to its original, but reversed, level. This was done automatically as described in the
following section.
III.5 Automatic Operation
The experimental apparatus is controled by two timing oscillators (Canberra model 1490 C). One enables data accumu-lation, while the other disables i t . These timers are part of a timer/scaler system which also includes six printing scalers
(Canberra model 1476) and a teletype scanner (Canberra model 1488) which transmits the information stored in the scalers, to a teletype
typewriter.
To start the operation, the 'enable' timer is turned on.
MCA which correspond to appropriate angular positions of the
motorized carriage. This is done through the use of a routing
circuit shown in Fig. 14. The operation of this circuit is described
in the caption to the figure. For a field reversal measurement data
are routed through a different circuit described in Fig.
15.
When the data accumulation period is over, several operations
take place sequentially: The 'enable' timer turns off. The
Schmitt trigger returns to its stable state, blocking further data
analynis. The 'disable' timer is turned on. The scanner activates
the typewriter which types the information stored in the timer/
scaler system during the data accumulation period. For angular
correlation measurements it also triggers a monostable multivibrator
(shown in Fig. 16) which actuates a relay, closing the power circuit
to the solenoid inside the motorized carriage. The solenoid
actuates and the motorized carriage rotates to the next angle (see
Sec. III.3). For a field reversal measurement, the relay shorts the
control circuit of the magnet's power supply. A bistable
multi-vibrator (flip-flop) shown in Fig.
15
is then triggered, actuatingtwo relays. One reverses the magnet current while the other routes
the data to a different section of the MCA. The monostable
multi-vibrator then returns to its stable state causing the magnet current
to return to its former (but reversed) value. At this time, data
accumulation is still blocked.
When the 'disable' interval is over, the 'block' timer turns
off. It also turns on the 'enable' timer and data analysis starts
n
c
out0--f
Rc
-1
s,
~
D
+IOv
Rb+IOv
-IOv
R Rc
.,
S2 S3
~
~
D+IOv
D+IOv
1
C i ni
n_fl
S4
~
+IOv
---,
Os
I
MAGNET
PONERI
I
--1I
L
_J
MAGNET
CURRENT
L
Magnetic Field_J
I
Reversal RelayI
+IOv
+IOv
Dt_f
-IOv
T-IOv
-IOv
LJ
INPUT
L_
Fixed-Bias Bi-Stable MultivibratorI
~ (Flip-Flop) ----,.f.IOv
t
-,
I
I
I
I
-•-r•J
TO
EXTERNAL
ROUTING
(MCA)
l
..
Field Reversal_J
I
Routing RelayI
C/1
C/2
Input +IOv +IOv +IOv R +IOv
+
-Cic
Rb -IOv -IOvL__
Emitter-Coupled Monostable Multivibrator__J
r-(One-Shot)
---i
+IOv
I~
I
I
I
I
L
This operation keeps going until stopped manually.
III.6 Experimental Procedure
Before starting any measurement, the system goes through several tests and calibrations. These include linearity checks of the TAC and the MCA, calibration of the time scale displayed by the MCA, and determination of the system's resolving time for the appro-priate energies. Linearity checks are usually performed with
random coincidences and the TAC time spectrum displayed in the MCA, should be flat. The time scale and resolving time calibrations are performed using annihilation radiation, together with intro-duction of known delays into the coincidence circuits. Operation of this circuit is also checked with an oscilloscope .
The radioactive source is then placed in the center of the correlation table facing the two detectors. An energy spectrum from one spectrometer is stored in the MCA and the two single channel
analyzers coupled to this detector are adjusted to accept the two gamma rays in the investigated cascade and reject all others. This procedure is repeated for the other detector . Care must be exe r-cised to insure that y
1 from detector A and y2 from detector B are coupled to one coincidence circuit, while y
2 from detector A and y1 from detector Bare coupled to the other. The 'fast'sect ions are adjusted next. First, the threshold levels of the fast discrimina-tors are adjusted to discriminate against electronic "noise", and
achieve the best time resolution available. This is found to be, in
is then set to the desired value. In the Last step the 'slow'
coincidence units are adjusted for the appropriate resolving
time and for maximum overlap of the three input pulses. The apparatus
is now ready for operation (it may be necessary to repeat the
calibration checks for possible changes due to the above-mentioned
adjustments).
When performing angular correlation measurements, centering of
the source has become absolutely crucial. Since, in many cases, the
investigated cascade has a small anisotropy, source decentering
effects can completely distort the angular correlation pattern.
Therefore, the system is first allowed to run through several
cycles and the source is centered to better than 1 percent by
observing the 'singles' count rates in the single channel analyzers,
coupled to motorized detectors system,at different angles. The
infor-mation printed out by the typewriter at regular intervals is then
used to correct for the remaining decentering of the source. Other
effects due to source thickness are described in Appendix B.
The angular correlation measurement now takes place. Data
accumulation period at each angle is usually set to less than 10
minutes (usually 3 minutes). This is, in most cases, an appropriate
period since then: (i) the radioactive decay of the source has
negligible effect; (ii) high frequency interference due to
fluctu-ations in power lines, voltage levels, temperature, etc., are
averaged out; (iii) low frequency interference due to similar
fluctuations have negligible effects. The data printed out by the
results which would indicate malfunctions in the operation of thC' system. These data include the coincidence rate and the 'si.ngll~l:l'
rates in each of the coincidence circuits. The operation of the
correlation table is also monitored by gating off different scalers at different angles for angular correlation measured, or at different directions of the magnetic field in a field reversal measurement.
Data are read out and analyzed daily. The different sets of data are compared for internal consistency, and all data sets in which
malfunctions are detected are discarded. When measuring several
different sources of the same radioactivity (such as a liquid source
and the different ferromagnetic sources), the measurements are
per-formed in i.dentical experimental set-ups, to allow determination of
possible effects due to the different compositions of the various
sources.
When using the integral-reverse-field method, the angular
correlation of the investigated cascade is first measured. The
angle
e
at which this distribution reaches its maximum logarithmic slope is determined. Then the field reversal measurement isper-formed with the movable detector fixed at that angle. This measure
-ment is repeated at the mirror angle 2rr-G and the change in the sign of the field-reversal ratio R(B) is observed. For an integral
rotation measurement, the angular correlation is measured once
with-out an applied magnetic field, and then with an applied field. The mean precession angle is then derived directly. The use of our
dual-integral-rotation technique enables the determination of the mean
an applied magnetic field, and observing the two oppositely
PART 2: MAGNETIC MOMENT MEASUREMENTS IN THE OSMIUM REGION
The nuclei of osmium and platinum are members of a transition region in which the shape of the nuclear sur-face turns from deformed to spherical. Nuclei in this region are therefore particularly suited for a critical test of nuclear models. Also, in this region it has been predicted that the nuclear surface switches abruptly from prolute to oblate shape before becoming spherica I. Neither the rotational model nor the vibrational model, are capable of quantitative description of nuclear properties in this region, being "deformed" or "spherical" oriented models. A model which treats the nucleon-pairing and the quadrupole
surface forces on the same footing has recently been put
1)
forward by Kumar and Baranger . This model was found to be in good agreement with many experimental results.
IV. THE MAGNETIC MOMENTS OF THE FIRST 2+ AND 4+ STATES IN 190os.
IV.l Introduction
The magnetic moment of the first 2+ state, at 186.7 keV, in 190
os has been measured before by Goldring and Gilad et
al.~'J)'
who+
observed the precession of the Coulomb excited 2 state in an ex-ternal magnetic field. Their result µ 0.56 ± 0.06 nm was recently re-evaluated toµ (190os)
=
1.10 ± 0.17 nm due to lifetime2+
correction(4) . This last result is in disagreement with all other collective magnetic moments in this region, as well as with recent calculation based on collective models.
The magnetic moment of the first 4+ state, at 547.9 keV, has never been measured. However, if both the 2
+
and 4+
state are of purely collective character, the ratio of their magnetic moments should equal the ratio of their spins, i.e., µ=
2µ •Measure-4+ 2+
ments on these states would then test the applicability of existing collective models to low-lying states in this region.
IV.2 Source Preparation
In order to obtain a sufficiently large mean precession angle during the short lifetime of the investigated nuclear state, the strong hyperfine magnetic field experienced by source nuclei em-bedded in a host Fe lattice was utilized.
190
Ir activity was obtained by bombarding highly enriched 190os isotope with 15 MeV protons at the Oak Ridge cyclotron producing a
. 190 190
the active Ir-Os alloy was deposited in a pot made of 1300 mg of pure (99.99 percent) Fe. The pot was sealed with a tapered Fe pin
and then melted for 15 minutes in an induction furnace using a
levitating Ag boat. The sample was cut into small pieces and the activity of each piece was measured. It was found that the activities of the small samples were proportional to their weights, thus e
n-suring uniform distribution of activity in the Fe host, and resulting
in a 0.5 at. percent dilute solution. The samples were then
re-melted for an additional 15 minutes, coined into a cylindrica] shape
and placed between the pole-tips of a small, fully enclosed,
toroidal electromagnet (cf. Sec. II.5). A field saturation curve
was run for each source with the help of a ballistic galvanometer, and the magnet subsequently operated at twice the saturation current.
The sources were also annealed, but no measurable differences in the
internal magnetic field were observed.
IV.3 The 2
+
State+
The measurement of the magnetic moment of the 2 state was
performed with two Ge(Li) detectors. From the level diagram of 190os
shown in Fig. 1, it is seen that three strong cascades; the
+ + + + + +
4 (361 keV)2 (187 keV)O , the 2 (371 keV)2 (187 keV)O , and the
3+(569 keV)2+(187 keV)O+ cascades can be used in the measurement. The energy spectrum of 190os taken with a Ge(Li) spectrometer is
shown in Fig. 2. Clearly, the 3+(569 keV)2+(187 keV)O+ cascade is
the most favorable one, having a minimum of interference from other
1871.8 1681.6 1583.6 1386.5 1163.1 1050A 955.1 756.0 557.8 547.9
186.7
0
,..,,2100
190!
11
r
11311 d (4+)
I
I
I 485.3 190.5Ml .<I 288.2 Ml+E2
Ml. 17 <2
'
I
294.6 I
E2.21 196.9 1323.9
518.4 E2.39 El.2 !5
E 1.120 I
•
7264
I
1133.6EI. II 223.8 E 1.12 432.8 E 1.12 EI. 18
I
407.1 829.0
E2.91 EI. 13
I
I
199.3
407.2 630.8 1035.7
5025
<2
605.3E2.3.5
l
~~~~I
• E2.15El.1!5 El.84 E2.138
•
I
198.0 768.!5 839.2
E2.9 E2.80 El.41
•
t I•
II
371.I 569.3
E2.81 E2.96 1199.9
361.2 El+M2.18
E2.43 5!57. 8
l
E2.IOO ~I
186.7
E2.204
•
•
[image:60.560.72.488.75.652.2]1900 76
s
114Figure 1
. 190 (6)
Level diagram of Os (proposed by Yamazaki et al. ).
91
g---=========:::
LBf~~~--~~~~~--====================::
SlNnO:>
Figure 2a
190
Ge(Li) energy spectrum of Ir decay. (a) Energies from 170 keV
to 620 keV.
>-(!)
er
w
z
[image:61.567.97.478.75.701.2]9£01
9ZL
-======::::::
1£9--=========
·
=-=z~
SlNnOJ
>-<.9
0:::
w
z
w
Figure 2b
190
[image:62.557.65.476.93.650.2]Since the mean precession angle of the magnetic moment of this state,in the internal magnetic field of the Fe host, was expected to be large (illT ~ 1), the integral-rotation method (cf. Sec. II.5) in wl1ich the precession of the angular correlation pattern is ob
-served directly, was used.
In observing the two opposite precessions si.multaneously, as described in Sec. III.3, with the magnetic field in one direction
only, we were able to derive the angular correlation coefficients together with the mean precession angle. This dual-integral rotation method has the additional advantage of eliminating systematic errors such as detector misalignme