Article
1
Mapping Informal Settlements in the Middle East
2
Environment using an Object-Based
Machine-3
Learning Approach
4
Ahmad Fallatah1*, Simon Jones1 and David Mitchell1
5
1 School of Science, RMIT University, Melbourne 3000, Australia; [email protected] (AF);
6
[email protected] (SJ); [email protected] (DM)
7
* Correspondence: [email protected] ; Tel.: +61-421-052-644
8
9
Abstract: The identification of informal settlements in urban areas is an important step in
10
developing and implementing pro-poor urban policies. Understanding when, where and who
11
lives inside informal settlements is critical to efforts to improve their resilience. This study aims to
12
analyse the capability of machine-learning (ML) methods to map informal areas in Jeddah, Saudi
13
Arabia, using very-high-resolution (VHR) imagery and terrain data. Fourteen indicators of
14
settlement characteristics were derived and mapped using an object-based ML approach and VHR
15
imagery. These indicators were categorised according to three different spatial levels: environ,
16
settlement and object. The most useful indicators for prediction were found to be density and
17
texture measures, (with random forest (RF) relative importance measures of over 25% and 23%
18
respectively). The success of this approach was evaluated using a small, fully independent
19
validation dataset. Informal areas were mapped with an overall accuracy of 91%. Object-based ML
20
as a hybrid approach performed better (8%) than object-based image analysis alone due to its
21
ability to encompass all available geospatial levels.
22
Keywords: informal settlement indicators; very high resolution (VHR); Urbanisation; Sustainable
23
Development Goals; object-based image analysis (OBIA); machine learning (ML); random forest
24
(RF).
25
26
1. Introduction
27
Informal settlements and slums have become the predominant form of new housing in the
28
global south. Informal settlements are the product of an urgent need for shelter, a high level of
29
urbanisation and urban growth coupled with a shortage of affordable and suitable land and
30
housing for low-income groups [1,2]. Such settlers are likely to be vulnerable to natural hazards
31
such as fire and flood. The rapid urbanisation process experienced by many countries in the global
32
south over the last few decades has resulted in fundamental challenges in the environment and
33
social structure [3,4]. Planning for informal settlements needs to consider the 2030 Agenda for
34
Sustainable Development, as countries will be required to report progress against the sustainable
35
development goals (SDGs) [2]. This 2030 agenda aims to improve living conditions for the residents
36
of informal settlement by 1) reducing by at least half the proportion of men, women and children
37
living in poverty in all its dimensions, and 2) providing access to adequate, safe and affordable
38
housing together with basic services, an aim that includes the upgrading of slums. While there is
39
growing evidence of a gradual shift in poverty fromrural to urban areas, it is clear that improved
40
information is needed on urbanisation, including on the spread of informal settlements [5].
41
According to UN-HABITAT, the proportion of the urban population living in slums in the
42
global south has declined, although the actual number of slum dwellers has grown considerably
43
and will continue to rise [6]. UN-HABITAT defines a slum household as one lacking any of the
44
following five factors: secure tenure, access to safe water, access to sanitation, a sufficient living area
45
and durability of housing [4]. Durable housing refers to the permanency of the structure – walls,
46
roof and floor; a structure should also be compliant with building codes, well maintained and
47
structurally sound and not located in a hazardous area [5]. Of these factors, only the durability of
48
the housing can potentially be measured using remote sensing techniques [7]. Urban areas typically
49
consist of a mix of land cover features such as water bodies, built-up areas (buildings) and
50
vegetation (gardens, parks and agricultural fields), and this presents a challenge for remote
51
identification and mapping [8]. The heterogeneity of an urban environment is hard to represent
52
with a pixel-based classification approach using only spectral values. Object-based approaches
53
however have the potential to capture this heterogeneity using contextual information for object
54
attribution [9,10].
55
1.1. Informal Settlement Indicators
56
Efforts to find effective variables with which to classify satellite images and produce accurate
57
land use land cover (LULC) maps have been an important component of remote sensing studies
58
over the past two decades. A set of well-defined attributes for a systematic approach to the
59
identification and classification of informal settlements was reviewed in [11]. Owen and Wong in
60
[11] proposed 14 indicators using data from Guatemala (see Table 1) although mapping these
61
indicators is a challenge especially in countries where key geographical data are missing [12]. Some
62
indicators have been successfully mapped [roofing extent, vegetation, road network and lacunarity
63
of housing structures/vacant land] however, others [texture measure and dwelling size] could not
64
be retrieved [13]. Some of these indicators have been used to map informal settlements and slums
65
[8,10,13] using a slum ontological framework proposed in [14]. In previous work, we adopted this
66
approach, using object-based image analysis (OBIA) to classify informal settlement indicators in a
67
Middle Eastern city [13]. We found that the OBIA approach can map informal settlements
68
indicators at the object level and some indicators at the settlements level. In this paper, we combine
69
both the OBIA and machine learning (ML) approaches in a synergistic way to map informal
70
indicators at the object, settlement and environmental levels (see Table 1).
71
Translating informal settlement indicators into maps of informal settlements is challenging,
72
requiring the integration of local knowledge with an adaptation of these characteristics to define the
73
informal settlements. Past efforts towards automated mapping of informal settlements have
74
focused on multi-spectral satellite remote sensing [11,15]. Here, we adopt the informal settlement
75
ontology of [14], which is useful in terms of understanding the relationship between the image and
76
actual characteristics of the informal settlement. The ontology identifies three spatial levels that
77
refer to the morphology of the built environment: the environ level, the settlement level and the
78
object level. This multi-scale approach considers the variable nature of informal settlements across
79
different contexts by defining a set of indicators at different scales for informal settlements [14] (see
80
Table 1). At the object level, building and road characteristics are the major components of the
81
ontological framework; however, at the settlement level, texture measures can be used to represent
82
the contrast between formal and informal settlements. At the environ level, factors that extend
83
beyond the site itself are important, for example, hazards due to the presence of flood plains and
84
marshy conditions [14].
85
Table 1. Summary of indicators to detect informal settlements (adapted from [11]).
86
Indicator Description and expected informal settlement values
Level
Roofing extent of the built-up area
The total area occupied by the building. High density expected.
Object
Dwelling size Mean dwelling size between <50 m2 and 380 m2
classified as informal settlements.
Object
Vegetation extent Amount of vegetation present. Expected lack of
vegetation.
1.2. Object-Based vs Pixel-Based approaches
87
The classification of remotely sensed imagery can be divided into two general image analysis
88
approaches: pixel-based classification and object-based classification [16,17]. In pixel-based
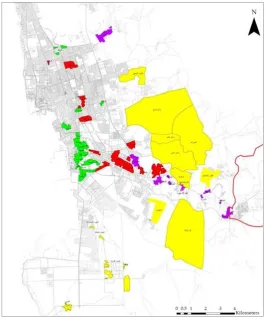
89
classification, the spectral pattern for each pixel in the multi-spectral data is used as the basis for
90
categorisation [18]. When extracting informal settlement indicator information from remote sensing
91
data, analysts tend to consider spatial resolution as more critical than spectral resolution [19]. The
92
use of sophisticated commercial software for mapping informal settlements using
very-high-93
resolution (VHR) imagery and ancillary data requires a high level of skill and is considered costly
94
for developing countries. However, the use of conventional methods, such as field surveys, for
95
informal settlement detection can also be time consuming and costly [20]. This paper explores the
96
possibility of implementing a low-cost standardised method for informal settlement mapping.
97
Remote sensing provides a fast, cost-effective and efficient method of mapping spatial distribution
98
and its disturbance dynamics [9]. Since pixel-based approaches are limited to pixel values using
99
VHR imagery [21], object-oriented classification is proposed as an approach to overcome some of
100
these limitations.
101
Lacunarity of housing structures
Measures heterogeneity or ‘gappiness’ of empty spaces (lacunae) between built-up structures.
Low value expected.
Settlement
Road segment type and materials
Less road elongation, fewer regular road segments.
Settlement
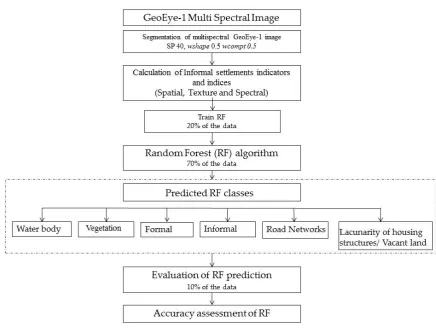
Texture measures of built-up area
Higher entropy, higher contrast, lower homogeneity in built-up areas.
Settlement
Road accessibility Road widths are narrower in informal areas and
less suitable for vehicular traffic. Roads not easily accessible, a higher proportion of dead-ends (dangles) and fewer intersecting nodes.
Settlement
Consistency of housing orientation
In the computer vision literature, the angles and lengths of line segments exhibit greater angular variability and are shorter.
Settlement
Dwelling shape The height of dwellings measured by image
shadows, or radar/ LIDAR; simplicity of shape (4-sidedness), more 4-sidedness (simple shapes) in informal areas.
Settlement
Dwelling consistency of orientation; dwelling road setback
Precarious house placement, road setbacks lacking.
Settlement
Building density (dwelling separation)
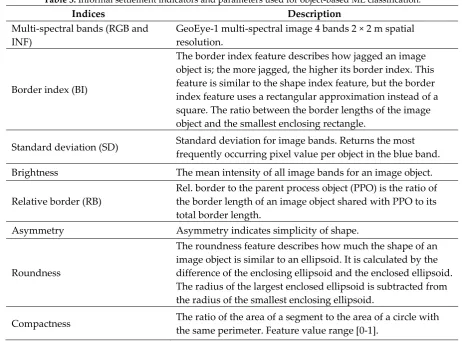
Lower nearest neighbour distance using centroid of dwelling polygons.
Settlement
Proximity to hazards Hazards include flood zones, hydrologic
setbacks, landslide/earthquake, garbage mountains, point source pollution, airports, energy transmission lines and major transportation.
Environ
Geomorphology of terrain Settlements built in gullies, ravines, steep
slopes, unstable soils.
Environ
Proximity to city centre and social services
Network analysis of distance to city services, market area or city centre and healthcare facilities. Greater distances expected overall.
In recent years, methods for mapping informal settlements using remote sensing imagery have
102
varied depending on the data source, project aim and resources. For example, OBIA appears to be
103
the most common method for mapping informal settlements [8,10,12,22]. Although rather labour
104
intensive, visual interpretation is still used for informal settlement and slum identification and
105
produces reliable results in the hands of skilled interpreters. OBIA requires a local ontology
106
framework, such as that in [14], to guide the OBIA parameterisation by defining the different
107
features for classification, as discussed in [8,10,13]. The OBIA approach is knowledge based,
108
typically producing a hierarchical classification and has been the dominant approach over the last
109
decade [12,16]. OBIA approaches have been found to work well for the extraction of objects (e.g.,
110
roofs and roads) at the settlement level in cases where the urban morphology is combined with a
111
sufficient resolution image to allow for identification [22,23].
112
1.3. ML for VHR and Complex Urban Areas
113
ML approaches are information-driven techniques that enable repetitive learning from large
114
and rich sets of training data [24]. ML has become a common method in remote sensing image
115
processing, with algorithms having high reported accuracies and high computational efficiency
116
when working with large datasets [22,24-26]. For a comprehensive review of ML approaches, see
117
[27-31]. Recent studies have explored the potential of object-based ML in simple systems, such as
118
agricultural monocultures [32]. Previous work has showed that feature selection, segmentation and
119
classifier parameter tuning can have a significant effect on the performance of any ML algorithm
120
[33-35]. Urban structure patterns have not been widely analysed using ML at different scales [36].
121
Wieland and Pittore in [35], explored the potential of ML algorithms in the context of object-based
122
image analysis and tested the algorithm’s performance under varying conditions in order to
123
optimise usage for urban pattern recognition tasks. In addition, the authors concluded that ML
124
algorithms allowed for a high degree of automation and possessed great flexibility regarding
125
transferability of the method to diverse image types. Several studies have used ML for urban land
126
cover/land use mapping, using Landsat data at the pixel level [37,38].
127
1.4. ML Object-Based Analysis
128
ML approaches can combine textural, spectral and structural features [22] with the most
129
popular algorithms including object-oriented decision trees (DTs), support vector machines (SVMs)
130
and random forests (RFs) or random trees (RTs) [18]. DTs have been used in environmental risk
131
analysis [39], and offered a higher precision compared with other statistical methods [40]. SVMs are
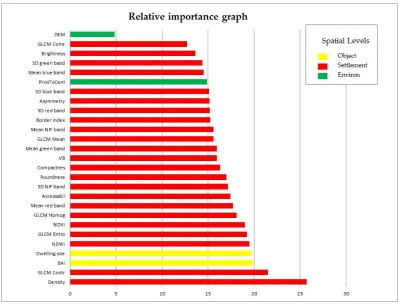
132
particularly appealing in the remote sensing field as they often produce higher classification
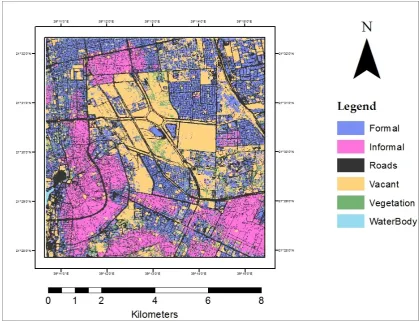
133
accuracy than traditional methods for urban structure pattern recognition within built-up areas and
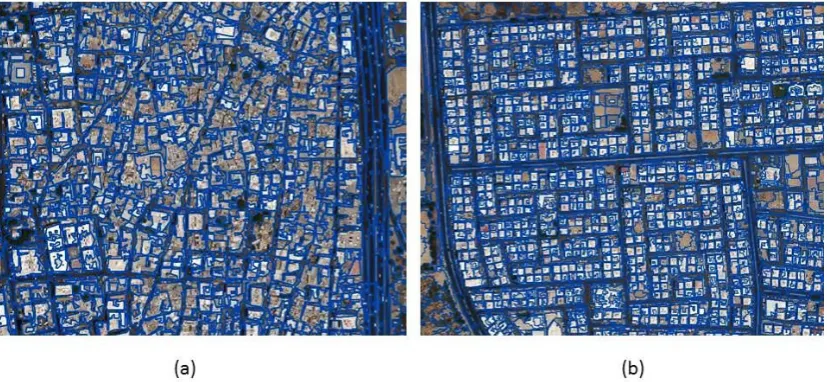
134
for automatic slum identification from VHR imagery [20,41-44]. However, the precision of the
135
results is strongly influenced by the choice of kernel type and associated parameters [20,32,42]. RFs
136
are one of the most popular ML methods for time-series monitoring of forests at the landsat level
137
but have not been used widely in informal settlement mapping using VHR. Examining both
pixel-138
based and object-based ML classification approaches for DTs, RFs and SVMs, no statistical
139
difference between object-based and pixel-based classifications when the same ML algorithms were
140
noted [16,18,20,36].
141
142
While ML has been used widely in remote sensing studies their use in urban area mapping has
143
to date been limited. We evaluated several ML approaches for informal settlement mapping. The
144
spatiotemporal detection and analysis of urban areas using VHR imagery [24,45] and mapping
145
constructed from [31] showed that RFs performed better than SVMs in the urban identification
146
context. RF approach yields a robust ML classifier that is relatively unknown in urban management
147
using remote sensing. The key advantages of RFs include their non-parametric nature, high
148
classification accuracy and capability to determine variable importance of each input variable.
149
Therefore, RFs are a good candidate an algorithm for estimating missing values and possess the
150
analysis and unsupervised learning [46]. ML (RF) performance has been tested with different
152
remote sensing dataset types, such as data from unmanned aerial vehicles (UAVs) [24,47],
multi-153
spectral data [48-50], aerial images [51] and high spatial resolution imagery [52]. The availability of
154
ancillary data, such as digital elevation models, is useful to support the prediction process.
155
Combining spectral, spatial and textural data provided better classification accuracy [26]. Whether
156
RFs are used to understand or predict, they are powerful and fast compared with other ML
157
algorithms.
158
1.5. Hybrid Approach (OBIA-ML)
159
Using a ML approach allows for the incorporation of geospatial and other ancillary data in
160
addition to the base VHR imagery. While OBIA is effective for object level analysis, it is time
161
consuming and bespoke and clearly not viable for mapping an entire city. Therefore, we need
162
another approach. We propose to combine the robust ability of ML to incorporate many types of
163
geospatial data and the proven utility of OBIA at the object level. ML approaches alone have been
164
applied successfully to the mapping of informal settlements in Latin America [24]. This example
165
used indicators related to the morphology of the urban area. Similarly, [53] was able to classify
166
built-up areas and other land cover classes without distinguishing between formal and informal
167
areas. Kuffer et al. [22] in their review of remote sensing for informal settlement mapping state that
168
OBIA and ML are likely to become the dominant paradigm. This paper takes up this challenge,
169
presenting an OBIA-ML fusion technique for mapping informal settlement indicators. In this paper,
170
we propose an object-based ML paradigm adapted to VHR image information content.
171
2. Case Study and Data
172
Jeddah is the most populated city in the west of Saudi Arabia. Urbanization has led to a
173
growing number of informal settlements, which affect the urban and social fabric of the city. The
174
population of Jeddah was estimated in 2009 to be around 3.4 million people (14% of the population
175
of Saudi Arabia) and this number is expected to grow at an annual rate of 2.2% (2010 census), to
176
reach 5.6 million people by 2029 (Jeddah Municipality, 2009a). Over recent decades, the city of
177
Jeddah has witnessed dramatic changes to its urban area [54], and the Jeddah Strategic Plan (2009)
178
indicated that there is a severe shortage of adequate housing for low- and middle-income residents.
179
The continued growth of informal settlements means that today, nearly 1 million residents live in
180
such areas [55]. One third of Jeddah’s population living in informal settlements lack essential
181
services and are subject to flood risk and other threats [56]. However, funding for large-scale
182
affordable housing and the expansion of housing finance options for the urban poor have remained
183
limited [57].The major factors leading to population growth in the selected area are natural growth
184
(i.e., the birth rate), illegal immigration from other countries and internal migration from rural
185
areas. Figure 1 shows the geographic location of Jeddah and the extent of the case study area
186
analysed in this research. Figure 2 shows the distribution of informal settlements in Jeddah, from
187
the oldest informal settlement around the city centre, shown in green, through red and purple, to
188
the most recently occupied (yellow) settlement. Formal and informal settlements are mainly
189
constructed from the same building materials (brick and concrete) in the Middle East, which makes
190
any differences difficult to detect.
191
A GeoEye-1 image was used in this research for informal settlement mapping. This was
192
acquired on 8 January 2010 and has a resolution of 0.5 m panchromatic and 2 m multi-spectral.
193
From among the more than 50 scattered informal settlements in Jeddah (see Figure 2), a case study
194
area was selected based on density, history, geographic distribution and susceptibility to flooding,
195
representing the variation in the characteristics of the local informal settlements. The case study
196
area contains a mixture of vegetation and residential and commercial buildings, with the informal
197
settlement section located mainly to the east. It is approximately 70 km in area.
199
Figure 1. (a) Geographic location of Jeddah, Saudi Arabia and neighbouring countries. (b) Jeddah’s location on
200
the Red Sea. The yellow rectangle shows the extent of the case study area analysed in this research
201
(source: Google Earth).
202
204
Figure 2. The distribution of informal settlements in Jeddah, from the oldest informal settlement
205
around the city centre (shown in green), through red and purple, to the most recently occupied
206
(yellow) (source: Jeddah Municipality).
207
3. Method
208
This research presents an object-based ML approach for mapping informal settlement
209
indicators. Specifically, it adopts the ontological classes proposed in [14] and evaluates the utility of
210
object-based ML in the Middle Eastern environment. The paper explores how the ML technique can
211
be used synergistically with the OBIA paradigm to map informal settlement indicators, using
212
Jeddah as a case study. In this section, the segmentation process is presented, and the informal
213
settlement indicators used to distinguish between formal and informal areas in the case study area
214
are detailed. In this research, object-based mapping approaches were implemented in eCognition
215
Developer 9.0 and RF within the R programming environment.
216
3.1. Classification
217
The classification process was performed as shown in Figure 3 in a sequence from top to
218
bottom and was repeated until all objects were classified. These steps formed a ruleset that are
219
applied later to the case study. The process of mapping informal settlements indicators via OBIA
220
starts by grouping the pixels in the image into coherent groups to form segments. Then, informal
221
settlements indicators were created and associated with each segment. After that, ML (RF) was
222
used to carry out analysis and subsequent classification. Finally, the accuracy assessment was
223
225
Figure 3. Flow chart of object-based ML (RF) ruleset structure for evaluating informal settlements indicators
226
in Jeddah.
227
228
Table 2 shows the parameters used to derive each of the informal settlement indicators at the
229
object, settlement and environ levels. Some indicators required only a single parameter, such as
230
vegetation extent, while others required a set of composite parameters, such as road networks.
231
Please note, the dwelling consistency indicator at the environ level was not assessed in this
232
research.
233
Table 2. Informal settlement indicators and parameters used for object-based ML classification in the Middle
234
East environment.
235
Informal settlements/
variable Parameters
Description Equation/tool
Roofing extent of built-up area
Built up area index (BAI)
BAI is used to measure Built-up
area. BAI = ( B1-B4)/(B1+B4)
Dwelling size Area
The numbers of pixels forming an image object. Mean dwelling size between <50 m2 and 380 m2 classified as informal settlements.
Object feature in eCognition
vegetation
Normalised Difference Vegetation Index(NDVI)
NDVI is used to measure vegetation.
NDVI = (B4 − B3)/(B4 +
B3)
Lacunarity of housing structures
Visible brightness (VB)
The mean intensity of all image bands for an
image object.
Road segment type and materials
Normalised difference water index (NDWI)
NDWI An index developed to measure tarred road
from other classes.
NDWI = (B2 − B4)/(B2 +
B4)
Texture measures
Grey level co-occurrence matrix (GLCM)
GLCM entropy
Object feature in eCognition GLCM homogeneity
GLCM contrast
GLCM correlation GLCM mean.
Road accessibility Accessibility
Road network and Junction network were used. Road width too narrow for vehicular traffic in informal areas. Roads not easily accessible, a higher proportion of dead-ends (dangles) and fewer intersecting nodes.
Spatial analysis in ArcGIS
Consistency of housing orientation
Asymmetry
This indicates simplicity of shape. In the computer vision literature, the angles and lengths of line segments exhibit greater angular variability and shorter lengths in informal settlements.
Object feature in eCognition
Dwelling shape shape
The relative length of an image object, compared to a regular polygon.
Object feature in eCognition
Building density (dwelling separation)
density
Lower nearest neighbour distance using centroid of dwelling polygons. Density is calculated based on the image object that contains the current candidate pixel. This allows for smoothing of the border of the image object without taking neighbour image objects into account.
Object feature in eCognition
Proximity to hazards
Digital elevation model (DEM)
Hazards include flood zones, hydrologic setbacks, garbage mountains, point source pollution,
airports, energy transmission lines, major transportation corridors; debris flows, rock and block falls, mass movements.
Spatial analysis in ArcGIS
Geomorphology of terrain
Digital elevation model (DEM)
Settlements built on relatively flat surface.
Object feature in eCognition
Proximity to city centre and social services
ProxToCent
Network analysis of distance to city services, market area or city centre and healthcare facilities. Greater distances expected.
Spatial analysis in ArcGIS
Table 3 shows GeoEye-1 multi-spectral imagery and the indices supporting object-based ML
237
classification at all of the proposed levels. The performance and significance of informal settlement
238
indicators are presented in section 3 and discussed in section 4.
239
Table 3. Informal settlement indicators and parameters used for object-based ML classification.
240
Indices Description
Multi-spectral bands (RGB and INF)
GeoEye-1 multi-spectral image 4 bands 2 × 2 m spatial resolution.
Border index (BI)
The border index feature describes how jagged an image object is; the more jagged, the higher its border index. This feature is similar to the shape index feature, but the border index feature uses a rectangular approximation instead of a square. The ratio between the border lengths of the image object and the smallest enclosing rectangle.
Standard deviation (SD) Standard deviation for image bands. Returns the most
frequently occurring pixel value per object in the blue band.
Brightness The mean intensity of all image bands for an image object.
Relative border (RB)
Rel. border to the parent process object (PPO) is the ratio of the border length of an image object shared with PPO to its total border length.
Asymmetry Asymmetry indicates simplicity of shape.
Roundness
The roundness feature describes how much the shape of an image object is similar to an ellipsoid. It is calculated by the difference of the enclosing ellipsoid and the enclosed ellipsoid. The radius of the largest enclosed ellipsoid is subtracted from the radius of the smallest enclosing ellipsoid.
Compactness The ratio of the area of a segment to the area of a circle with
the same perimeter. Feature value range [0-1].
3.2. Segmentation
241
Optimisation of segmentation parameters is crucial for analysis transferability from one image
242
to another [58]. The first stage in mapping informal settlement indicators using a ML object-based
243
approach is to generate segments by automatically grouping an image into coherent groups of
244
pixels in order to form segments based on degree of homogeneity [16,53,59,60]. The process of
245
segmentation was implemented using eCognition 9. Indicators of informal settlements were then
246
mapped and assessed, and subsequently, indicators were grouped to provide formal vs informal
247
settlement mapping. To this end, three parameters were optimised to segment objects: scale (SP),
248
shape (𝑊 ) and compactness (𝑊 ). Image object primitives were generated with respect to
249
informal settlement indicators [17] for the selected case study. Values of SP = 40, 𝑊 = 0.5 and
250
𝑊 = 0.5 were selected through interactive control (see section 4.1). The three parameters values
251
were chosen based on qualitative analysis (visual inspection), after [8,10,13], of the resulting
252
segmentation and the purpose of classification, representingbasic land cover features (for example,
253
buildings and the road network). For full details of this method see [13].
254
3.3. Informal Settlement Indicators
255
A range of informal settlement indicators were created to facilitate the classification process.
256
Image texture was introduced in [61] as an important source to derive spatial information. Texture
257
features characterise the spatial distribution of intensity values in the image [20]. The grey-level
co-258
occurrence matrix (GLCM) provides additional information for land cover mapping and has been
259
widely used in diverse applications, including urban built-up area extraction [8,10,13,53,62]. The
260
following texture measures were created: GLCM , GLCM , GLCM , GLCM
and GLCM (see Table 2). Additionally, a road accessibility measure map was created using the
262
street network and junction density provided by the Jeddah municipality. Raster layers,
263
representing the level of accessibility, were generated by ArcGIS using a point density function.
264
Geomorphology of terrain (DEM) was divided into three categories based on DEM natural break
265
values in the case study area. In addition, proximity to the city centre was divided into ten
266
categories based on neighbourhoods with an area of 1 km . Based on [13], the NDWI index and
267
brightness were used to create road segment types and materials. Road segment types and
268
materials are very typical man-made objects and are significant in urban areas [63]. The built-up
269
area index (BAI) was used to detect the extent to which an area is built up [64].
270
3.4. Training Data
271
After the appropriate segmentation parameters were acquired, all informal settlement
272
variables were assigned to each object, such as roofing extent and types, texture measures and the
273
standard deviation of multi-spectral images and shapes in eCognition. Informal settlement
274
indicators and other index variables were combined in order to perform further analysis. Training
275
data were selected using a stratified random distribution to represent each class: such as a road
276
network and built-up area. On the colour composite image, a total of 4,500 samples were selected,
277
representing the variation in image components. The samples were divided into three subsets: 70 %
278
as predictor samples used for the land cover classification, 20% as training data and 10% as
279
validation samples used for accuracy assessment of the classification.
280
3.5. RF Implementation
281
The methodological framework consisted of two main steps. In the first step, an object-based
282
algorithm was used to derive the settlement indicators as shown in Figure3. Then, in the next step
283
RF was applied to evaluate the utility of the informal settlement indicators to distinguish the formal
284
from the informal settlements in Jeddah.
285
3.6 Accuracy Assessment
286
In RFs, there is no need for cross-validation or a separate test to obtain an unbiased estimate of
287
the test set error. This is estimated internally, during the run, as follows: each tree is constructed
288
using a different bootstrap sample from the original data. Each tree uses only a portion of the input
289
samples (typically two thirds) for the training, while the remaining, roughly one third (referred to
290
as out-of-bag (OOB)), of the samples are used to validate the accuracy of the prediction [65].
291
These estimates are made OOB, as explained in [65]. The multiple decision trees of the RF are
292
trained on a bootstrap sample of the original training data. At each node of every decision tree, one
293
of a randomly selected subset of input parameters is chosen as the best split and used for node
294
splitting [66]. Variable selection is significant for interpretation and prediction, especially for
multi-295
dimensional datasets. However, we identified a separate reference dataset (10%) for independent
296
accuracy assessment as a double check for cross-validation (see Figure 3). In this paper, a relative
297
importance graph was used to rank the importance of the variables.
298
4. Results
299
This section presents the results of mapping each informal settlement indicator as described in
300
Table 1. First, we present the results of the segmentation algorithm (see Figure 4), before
301
considering the mapping accuracy of each indicator and concluding with the findings in terms of
302
the distinction between informal and formal settlements. Second, the results of the object-based ML
303
approach are presented at three spatial levels: object, settlement and environ. Figure 5 provides the
304
27 variables with respect to the relative importance to classification as calculated by the RF. Figure 6
305
shows the result of the object-based ML approach, with an overall accuracy of 91%. Informal
306
settlement indicators are presented here with respect to the three spatial levels as shown in Table 2.
4.1 Segmentation
308
A set of object primitives were generated with respect to informal settlement indicators for a
309
selected case study. Values of SP = 40, 𝑊 = 0.5 and 𝑊 = 0.5 were selected through iterative
310
and interactive control (see Figure 4). In general, the segmentation worked well, except for some
311
informal areas where the definition of individual buildings failed (centre of Figure 4a): the spectral
312
homogeneity of the tightly grouped buildings at this point proving problematic.
313
314
Figure 4.
Multi-resolution segmentation of the GeoEye-1 image (SP = 40, 𝑾𝒔𝒉𝒂𝒑𝒆 = 0.5, 𝑾𝒄𝒐𝒎𝒑𝒕 = 0.5). In315
informal settlements (a), building clusters and the general pattern of buildings are outlined. In
316
formal areas (b), the individual buildings, road network and trees are successfully outlined.
317
4.2 Informal Settlement Mapping
318
An informal settlement map was constructed by assigning to each segment the highest ranked
319
agent from the RF model. Generally, the indicators showed high importance in classifying informal
320
settlements using VHR imagery, with the exception of the DEM (see Figure 5). The results are
321
presented in three sections according to the three ontological informal settlement spatial levels.
322
At the object level, both the roofing extent in the built-up areas and the dwelling size indicators
323
featured among the ten most important indicators. The roofing extent was detected using the BAI,
324
and it rated third in importance, with a relative importance of 19.8%. Dwelling size is ranked fourth
325
in relative importance, with a relative importance of 19.7%.
326
At the settlement level, density and the texture measure GLCM were the most significant
327
information sources for distinguishing informal settlements from other classes, with building
328
density (dwelling separation) the most important variable. Of the five texture measures, the
329
GLCM was the most successful parameter, rated second in the importance graph, with a
330
relative importance of 19.4%. In contrast, GLCM was the least important variable at the
331
settlement level, with a relative importance of 14.3%. Road accessibility occupied tenth place in the
332
full list and seventh place at the settlement level. All parameters at the settlement level contribute to
333
informal settlement mapping, as shown by the red bars in Figure 5. The vegetation indicator was
334
336
337
Figure 5. The relative importance for 27 object-based RF classification variables in three different
338
spatial levels. Yellow bars represent object level, red the settlement level and green the environ
339
level.
340
At the environ level, the geomorphology of terrain (DEM) parameter had the least impact on
341
the classification using RFs and proximity to city centre had the highest impact. The red band
342
represents the highest importance at 17.7%, followed by the SD of NIR bands and roundness with
343
approximately 17%.
344
Table 4 shows the accuracy assessment estimates for predicted classes using RFs. The overall
345
accuracy of the informal settlement indicators with object-based ML was 91%. In general, the results
346
were very encouraging with all classes returning user and producer accuracies >85%.
347
Table 4. Accuracy assessment estimates for predicted classes.
348
Reference/
predicted Formal Informa
l
Road network
Vacant
land Vegetation Water
body Total
Producer accuracy
Formal 641 10 2 6 0 0 659 97%
Informal 93 651 8 1 0 0 753 86%
Road network 5 6 287 3 1 0 302 95%
Vacant land 8 0 7 167 6 0 188 89%
Vegetation 1 4 2 0 111 0 118 94%
Water body 0 0 0 0 0 1 1 100%
Total 748 671 306 177 118 1 2021
user accuracy 86% 97% 94% 94% 94% 100%
350
Figure 6. Result of object-based ML approach classification.
351
5. Discussion
352
Methods, such as census surveys, have traditionally been used to collect data in urban areas;
353
however, informal settlements are often however outside of census scope. Using remotely sensed
354
data and ancillary information to characterise informal settlements is therefore useful [67]. Past
355
efforts towards automated mapping of informal settlements have focused on the OBIA approach
356
using multi-spectral satellite remote sensing [8,10,13,17,60]. However, the OBIA approach is
357
challenging as it requires the integration of local knowledge and site-specific characteristics [57] to
358
define each informal settlement. This section discusses the performance of the informal settlement
359
indicators using an object-based ML approach and VHR imagery.
360
5.1 Classification
361
In this section, we assess the performance of the object-based ML algorithm at each ontological
362
level. Our results for informal settlement mapping were of a high standard, comparable with the
363
OBIA approach implemented by [8,10,13]. The relative variable importance graph (Figure 5) shows
364
the importance of each indicator using an object-based ML (RF) to perform the analysis.
365
At the object level, the roofing extent of the built-up area and the dwelling size were the most
366
important indicators and both ranked in the top four overall. These indicators are cited as the
367
primary indicators to distinguish informal from formal settlements [8]. The roofing extent in a
built-368
up area is represented by the BAI index (see Table 2) and occupied third place in the variable
369
importance graph. Dwelling size is another leading indicator used for informal settlement
370
identification [8,11]. Object-based ML is used to map dwelling size to quantify shape-based (shape,
371
size and spacing) characteristics of informal settlements. Although dwelling size in informal
372
settlements varies due to dwelling separation [11]. Such a variation played a major role in this
373
classification. However, the proposed method mapped dwelling size with a high relative
374
At the settlement level, informal settlement indicators have a relative importance of between
376
12% and 20%. They have a marked impact on classification accuracy on the large scale [22]. For
377
example, the density and texture measures are the most important variables among the indicators
378
and indices used. As can be expected from an image with many formal and informal settlements,
379
dwelling density was the most important variable in the classification. In this research, five texture
380
descriptors were calculated using GLCM; together, these form a vector that describes the texture of
381
each segment. The texture measure 𝐺𝐿𝐶𝑀 had the second highest importance of all indicators
382
and was the most important at the settlement level, as shown in Figure 5. However, the texture
383
measure 𝐺𝐿𝐶𝑀 indicator has the least impact on the classification at the settlement level, with a
384
relative importance of 12.7%. To map informal settlements layout and other land cover classes, the
385
texture measure 𝐺𝐿𝐶𝑀 has been used [68], based on Haralick’s method [61]. The results from
386
texture measures vary because of textural homogeneity [69]; however, the inclusion of texture
387
information seems to be suitable for the classification of bare soil areas [70]. Previous studies have
388
proved the suitability of the texture parameter in cases involving a clear distinction between roofing
389
extent and other classes, especially vacant land [8], as roof building texture is homogeneous. Such
390
spatial information is essential for risk management and is clearly a major source of information
391
using visual interpretation and image processing [71].
392
The performance of the indicator ‘vegetation’ was the most successful, with a 94% accuracy
393
using the NDVI index. This relatively simple measure is successful since vegetation is spectrally
394
distinct from other indicators. Giving such high mapping accuracy across the case study, vegetation
395
is likely to be applicable to any Middle Eastern city. Vegetation typically is not present in informal
396
settlements, appearing on the edge of formal areas or where main highways start. However, the
397
parameter can be seen in the formal areas and outside built-up areas as groups of trees. Significant
398
pockets of vegetation are present in the old informal settlement borders and embedded in informal
399
settlements adjacent to the city centre.
400
Mapping of the lacunarity of housing structures/vacant land was mainly based on the visible
401
brightness parameter. Lacunarity of housing structures/vacant land was different for the older
402
informal settlements compared to the newer areas. In the older areas close to the city centre, vacant
403
land is often found within existing settlements, whereas in newer informal settlements, which are
404
far away from the city centre, such areas are typically adjacent to them rather than embedded
405
within them. Road segments and accessibility are obvious measures for mapping informal
406
settlements. They are the main characteristics of informal settlements in the Middle Eastern city of
407
Jeddah, allowing them to guide the analysis. However, irregular road patterns in the informal
408
settlements have a low reflectance. Therefore, we incorporated the NDWI index to overcome this, as
409
in [72], as it helps to identify objects with a low reflectance.
410
At the environ level, indicators were less important and ranked lower than both the settlement
411
and object level indicators with a relative importance between 12% and 20%. Today informal
412
settlements usually occur outside the city centre [8,11], but this has not always been the case. This
413
explains the lack of descriptive capability in the proximity indicator. Additionally, the
414
geomorphology of terrain (DEM) had the least effect on the classification, with a relative
415
importance of less than 5%. This is since the terrain is almost flat, which means that the flood
416
hazard is equally distributed into formal and informal settlements. Identifying informal settlements
417
using terrain geomorphology can be very helpful, especially when informal settlements are within
418
river banks or on steep slopes at risk of landslide [10]. In general, only small improvements were
419
associated with the environ level indicators which did not increase the accuracy of the Quazah
420
district case study (5 Km ). However, when the spatial scale of analysis was increased to a much
421
larger area (70 Km ) an improvement in accuracy was noted. However, the environ level indicators
422
have increased the classification accuracy at a landscape or city level [22].
423
5.2 Segmentation
424
The success of the image segmentation stage is important and has a large impact downstream
425
OBIA and object-based ML approaches. However, the segmentation process in object-based ML
427
approach was carried out at the object level with one set of values in performing the analysis; there
428
is no need for different segmentation levels such as in [8,10,13,71] since RF is able to ingest all data
429
at one segmentation level. Using the OBIA approach required expert knowledge in order to transfer
430
informal settlement indicators into local knowledge, and each indicator needs significant localised
431
‘tuning’ to map informal areas. In contrast, object-based ML did not require tuning or applying
432
different segmentation levels, although the study area contains diversity in the characteristics of
433
informal settlements.
434
5.3 Comparative Approach: Object-Based ML vs. OBIA
435
In this section, we assess the performance enhancement gained via our proposed method by
436
comparing the approach presented in this paper to a previous OBIA only approach on the same
437
study area [13]. This is achieved by comparing the results of a previous OBIA based classification of
438
formal and informal settlements for the Quazah district of Jeddah using the same base imagery [13]
439
as shown in Figure 7, with the results from this study, as shown in Table 5 to assess the usefulness
440
of using a hybrid approach.
441
For the Quazah district case study with 5 Km , there was no improvement in the overall
442
accuracy when the object-based ML approach was implemented. However, a marked improvement
443
was noted in the formal settlements identification from 77% to 85% accuracy and road networks
444
from 73% to 95%. Interestingly, these increases in class accuracy are accompanied by decreases in
445
vegetation accuracy from 100% to 60% and vacant land accuracy from 86% to 80%. The OBIA
446
mapping accuracy [13] was then compared with the larger (70 Km ) city-wide classification
447
performed in this paper (see Table 5). At this city-wide scale, the object-based ML approach
448
performed much better, with an overall accuracy of 91% (vs 83% [13]). There was a
449
marked improvement in detecting formal areas using object-based ML, (20%). This improvement
450
contributes to the overall accuracy of the technique. Road segment types and materials in an urban
451
area vary; the road network parameter had the highest improvement at 22% accuracy followed by
452
formal areas with 9% accuracy.
453
In contrast, there was a slight drop in the accuracy of mapping the vegetation (6%). This could
454
be due to the variation of VHR imagery and implementation of the informal settlement indicators
455
on various spatial levels (object, environment and settlement). However, mapping informal
456
settlements was improved by 1% in the larger case study and 2% in the small case study. This could
457
be for a number of reasons; the complexity of the urban pattern inside informal settlements is a
458
challenge, the spectral similarity between many classes (e.g., roofing extent in the built-up areas and
459
texture measures of the built-up areas) results in classification confusion.
460
The proposed approach suggests that object-based ML is capable of handling big datasets and
461
was a time-efficient means of enhancing informal settlement mapping accuracy over large areas.
462
The object-based ML approach reported a higher accuracy, as presented in [22], dealing with an
463
ontological framework [14] at different scale levels.
464
Figure 7. Panel (a) shows the results of mapping informal settlement using the OBIA approach,
466
while panel (b) presents the final map for the informal settlements using object-based ML.
467
Table 5. Summary of the accuracy assessment comparison obtained by OBIA approach presented in
468
[13] and OBIA-ML for mapping informal settlements.
469
compared results
OBIA approach case study 𝟓 𝐊𝐦𝟐 [13]
OBIA-ML approach case study 𝟓 𝐊𝐦𝟐
Difference/ improvement
OBIA-ML approach case study 𝟕𝟎 𝐊𝐦𝟐
Difference/ improvement
Formal 77% 85% 8% 97% 20%
Informal 85% 87% 2% 86% 1%
Road
network 73% 80% 7% 95% 22%
Vacant land 86% 80% -6% 95% 9%
Vegetation 100% 60% -40% 94% -6%
water body _ _ _ 100% not comparable
over all
accuracy 83% 83% No differences 91% 8%
5. Conclusion
470
Mapping informal settlements is crucial for urban risk management. The aim of this study was
471
to analyse the capability of an object-based ML hybrid method to map informal settlements in the
472
Middle East using VHR imagery. This was based on an ontological framework with three different
473
spatial levels. The proposed method of informal settlement mapping, as demonstrated for Jeddah in
474
Saudi Arabia, yields a high level of accuracy. The use of an object-based ML approach for informal
475
settlement mapping proved effective in this challenging Middle Eastern environment, where most
476
of the buildings in formal and informal settlements are constructed from similar building materials.
477
Multi-resolution image segmentation was performed to represent the image components and
478
subsequently, an object-based ML (RF) algorithm was able to classify formal and informal
479
settlements with an overall accuracy of 91%.
480
The proposed methodological framework was designed to be applicable for the mapping of
481
informal settlement indicators in similar urban contexts in the Middle East. The object-based ML
482
approach using VHR remote sensing imagery does not require parameter optimisation, as the case
483
with OBIA. The hybrid approach attempts to combine the advantages of both the OBIA and ML
484
approaches, to handle the complex built-up environment and variability of VHR imagery.
485
Parameters at the object and settlement levels have a large impact on classification accuracy
486
while those at the environ level were less important. Incremental improvements in mapping
487
accuracy should therefore be targeting datasets at the object and settlement levels. However, at the
488
case study level in Quazah district, no significant improvement was noted i.e., the two OBIA /
489
object-based ML performed similarly. But, at the city-scale level (70 Km ) a significant improvement
490
in accuracy were noted by (8%). While previous studies have attempted to map informal
491
settlements using OBIA, the RF algorithm proved to be a useful additional method to map informal
492
settlements particularly at the large area scale.
493
Acknowledgements: Fallatah thanks the Digital Globe Foundation for providing GeoEye-1 images for this
494
research and King Abdul Aziz University for PhD scholarship programme. Also, the support of the
495
Municipality of Jeddah is acknowledged.
496
Author Contributions: A.F., S.J. and D.M. conceived and designed the experiments; A.F. performed the
497
Conflicts of Interest: The authors declare no conflict of interest. The funding sponsors had no role in the
499
design of the study; in the collection, analyses or interpretation of data; in the writing of the manuscript or in
500
the decision to publish the results.
501
References
502
1. Kuffer, M.; Pfeffer, K.; Sliuzas, R.; Baud, I. Extraction of slum areas from vhr imagery using
503
glcm variance. IEEE Journal of Selected Topics in Applied Earth Observations and Remote Sensing
504
2016, 9, 1830-1840.
505
2. Mitchell, D.; Enemark, S.; van der Molen, P. Climate resilient urban development: Why
506
responsible land governance is important. Land Use Policy 2015, 48, 190-198.
507
3. Susan Niebergall, A.L., Wolfram Mauser. Integrative assessment of informal settlements
508
using vhr remote sensing data—the delhi case study. IEEE Journal of Selected Topics in
509
Applied Earth Observations and Remote Sensing 2008
510
4. UN-Habitat. The challenge of slums: Global report on human settlements 1844070379; 2004; pp
511
337-338.
512
5. UN-Habitat. Slums of the world: The face of urban poverty in the new millennium; Nairobi,
513
Kenya, 2003.
514
6. UN-Habitat. Slum almanac, tracking improvement in the lives of slum dwellers; Nairobi, 2016.
515
7. Mahabir, R.; Crooks, A.; Croitoru, A.; Agouris, P. The study of slums as social and physical
516
constructs: Challenges and emerging research opportunities. Regional Studies, Regional
517
Science 2016, 3, 399-419.
518
8. Kohli, D.; Warwadekar, P.; Kerle, N.; Sliuzas, R.; Stein, A. Transferability of object-oriented
519
image analysis methods for slum identification. Remote Sensing 2013, 5, 4209.
520
9. Ebert, A.; Kerle, N.; Stein, A. Urban social vulnerability assessment with physical proxies
521
and spatial metrics derived from air- and spaceborne imagery and gis data. Natural Hazards
522
2009, 48, 275-294.
523
10. Kohli, D.; Sliuzas, R.; Stein, A. Urban slum detection using texture and spatial metrics
524
derived from satellite imagery. Journal of Spatial Science 2016, 1-22.
525
11. Owen, K.K.; Wong, D.W. An approach to differentiate informal settlements using spectral,
526
texture, geomorphology and road accessibility metrics. Applied Geography 2013, 38, 107-118.
527
12. Blaschke, T. Object based image analysis for remote sensing. ISPRS Journal of
528
Photogrammetry and Remote Sensing 2010, 65, 2-16.
529
13. Fallatah, A.; Jones, S.; Mitchell, D.; Kohli, D. Mapping informal settlement indicators using
530
object-oriented analysis in the middle east. International Journal of Digital Earth 2018, 1-23.
531
14. Kohli, D.; Sliuzas, R.; Kerle, N.; Stein, A. An ontology of slums for image-based
532
classification. Computers, Environment and Urban Systems 2012, 36, 154-163.
533
15. Owen, K. In Settlement indicators of wellbeing and economic status–lacunarity and vegetation,
534
2011; American Society of Photogrammetry and Remote Sensing Pecora 18 Conference,
535
Herndon, VA.
536
16. Duro, D.C.; Franklin, S.E.; Dubé, M.G. A comparison of pixel-based and object-based image
537
analysis with selected machine learning algorithms for the classification of agricultural
538
landscapes using spot-5 hrg imagery. Remote Sensing of Environment 2012, 118, 259-272.
539
17. Blaschke, T.; Hay, G.J.; Kelly, M.; Lang, S.; Hofmann, P.; Addink, E.; Queiroz Feitosa, R.;
540
van der Meer, F.; van der Werff, H.; van Coillie, F., et al. Geographic object-based image
analysis – towards a new paradigm. ISPRS Journal of Photogrammetry and Remote Sensing
542
2014, 87, 180-191.
543
18. Tehrany, M.S.; Pradhan, B.; Jebuv, M.N. A comparative assessment between object and
544
pixel-based classification approaches for land use/land cover mapping using spot 5
545
imagery. Geocarto International 2014, 29, 351-369.
546
19. Myint, S.W.; Gober, P.; Brazel, A.; Grossman-Clarke, S.; Weng, Q. Per-pixel vs. Object-based
547
classification of urban land cover extraction using high spatial resolution imagery. Remote
548
Sensing of Environment 2011, 115, 1145-1161.
549
20. Duque, J.C.; Patino, J.E.; Betancourt, A. Exploring the potential of machine learning for
550
automatic slum identification from vhr imagery. Remote Sensing 2017, 9.
551
21. Baatz, M.; Schäpe, A. In Object-oriented and multi-scale image analysis in semantic networks, 2nd
552
international symposium: operationalization of remote sensing, 1999; pp 7-13.
553
22. Kuffer, M.; Pfeffer, K.; Sliuzas, R. Slums from space—15 years of slum mapping using
554
remote sensing. Remote Sensing 2016, 8, 455.
555
23. Ghimire, B.; Rogan, J.; Miller, J. Contextual land-cover classification: Incorporating spatial
556
dependence in land-cover classification models using random forests and the getis statistic.
557
Remote Sensing Letters 2010, 1, 45-54.
558
24. Huang, X.; Liu, H.; Zhang, L. Spatiotemporal detection and analysis of urban villages in
559
mega city regions of china using high-resolution remotely sensed imagery. IEEE
560
Transactions on Geoscience and Remote Sensing 2015, 53, 3639-3657.
561
25. Hong, H.; Xiaoling, G.; Hua, Y. In Variable selection using mean decrease accuracy and mean
562
decrease gini based on random forest, 2016 7th IEEE International Conference on Software
563
Engineering and Service Science (ICSESS), 26-28 Aug. 2016, 2016; pp 219-224.
564
26. Ruiz Hernandez, I.E.; Shi, W. A random forests classification method for urban land-use
565
mapping integrating spatial metrics and texture analysis. International Journal of Remote
566
Sensing 2018, 39, 1175-1198.
567
27. Pereira, F.; Mitchell, T.; Botvinick, M. Machine learning classifiers and fmri: A tutorial
568
overview. NeuroImage 2009, 45, S199-S209.
569
28. Neal, R.M. Pattern recognition and machine learning. Technometrics 2007, 49, 366-366.
570
29. Kotsiantis, S.B. Supervised machine learning: A review of classification techniques.
571
Informatica 2007, 31, 249.
572
30. Rodriguez-Galiano, V.F.; Chica-Rivas, M. Evaluation of different machine learning methods
573
for land cover mapping of a mediterranean area using multi-seasonal landsat images and
574
digital terrain models. International Journal of Digital Earth 2014, 7, 492-509.
575
31. Holloway, J.; Mengersen, K. Statistical machine learning methods and remote sensing for
576
sustainable development goals: A review. Remote Sensing 2018, 10, 1365.
577
32. Peña, J.; Gutiérrez, P.; Hervás-Martínez, C.; Six, J.; Plant, R.; López-Granados, F.
Object-578
based image classification of summer crops with machine learning methods. Remote Sensing
579
2014, 6, 5019.
580
33. Löw, F.; Michel, U.; Dech, S.; Conrad, C. Impact of feature selection on the accuracy and
581
spatial uncertainty of per-field crop classification using support vector machines. ISPRS
582
34. Qian, Y.; Zhou, W.; Yan, J.; Li, W.; Han, L. Comparing machine learning classifiers for
584
object-based land cover classification using very high resolution imagery. Remote Sensing
585
2015, 7, 153.
586
35. Wieland, M.; Pittore, M. Performance evaluation of machine learning algorithms for urban
587
pattern recognition from multi-spectral satellite images. Remote Sensing 2014, 6, 2912.
588
36. Wieland, M.; Torres, Y.; Pittore, M.; Benito, B. Object-based urban structure type pattern
589
recognition from landsat tm with a support vector machine. International Journal of Remote
590
Sensing 2016, 37, 4059-4083.
591
37. Schneider, A. Monitoring land cover change in urban and peri-urban areas using dense
592
time stacks of landsat satellite data and a data mining approach. Remote Sensing of
593
Environment 2012, 124, 689-704.
594
38. Griffiths, P.; Hostert, P.; Gruebner, O.; der Linden, S.v. Mapping megacity growth with
595
multi-sensor data. Remote Sensing of Environment 2010, 114, 426-439.
596
39. Saito, H.; Nakayama, D.; Matsuyama, H. Comparison of landslide susceptibility based on a
597
decision-tree model and actual landslide occurrence: The akaishi mountains, japan.
598
Geomorphology 2009, 109, 108-121.
599
40. Pradhan, B. A comparative study on the predictive ability of the decision tree, support
600
vector machine and neuro-fuzzy models in landslide susceptibility mapping using gis.
601
Computers & Geosciences 2013, 51, 350-365.
602
41. Vapnik, V. The nature of statistical learning theory. Springer: New York, 2000.
603
42. Mantero, P.; Moser, G.; Serpico, S.B. In Partially supervised classification of remote sensing
604
images using svm-based probability density estimation, IEEE Workshop on Advances in
605
Techniques for Analysis of Remotely Sensed Data, 2003, 27-28 Oct. 2003, 2003; pp 327-336.
606
43. Mountrakis, G.; Im, J.; Ogole, C. Support vector machines in remote sensing: A review.
607
ISPRS Journal of Photogrammetry and Remote Sensing 2011, 66, 247-259.
608
44. Nemmour, H.; Chibani, Y. Multiple support vector machines for land cover change
609
detection: An application for mapping urban extensions. ISPRS Journal of Photogrammetry
610
and Remote Sensing 2006, 61, 125-133.
611
45. Chen, R.; Li, X.; Li, J. Object-based features for house detection from rgb high-resolution
612
images. Remote Sensing 2018, 10, 451.
613
46. Rodriguez-Galiano, V.F.; Ghimire, B.; Rogan, J.; Chica-Olmo, M.; Rigol-Sanchez, J.P. An
614
assessment of the effectiveness of a random forest classifier for land-cover classification.
615
ISPRS Journal of Photogrammetry and Remote Sensing 2012, 67, 93-104.
616
47. Gevaert, C.; Sliuzas, R.; Persello, C.; Vosselman, G. Opportunities for uav mapping to
617
support unplanned settlement upgrading. Proceedings of GeoTech Rwanda 2015.
618
48. Salas, E.; Boykin, K.; Valdez, R. Multispectral and texture feature application in
image-619
object analysis of summer vegetation in eastern tajikistan pamirs. Remote Sensing 2016, 8, 78.
620
49. Keshtkar, H.; Voigt, W.; Alizadeh, E. Land-cover classification and analysis of change using
621
machine-learning classifiers and multi-temporal remote sensing imagery. Arabian Journal of
622
Geosciences 2017, 10, 154.
623
50. Mellor, A.; Boukir, S.; Haywood, A.; Jones, S. Exploring issues of training data imbalance
![Table 1. Summary of indicators to detect informal settlements (adapted from [11]).](https://thumb-us.123doks.com/thumbv2/123dok_us/8018415.1333429/2.595.68.526.666.778/table-summary-indicators-detect-informal-settlements-adapted.webp)

![Table 5. Summary of the accuracy assessment comparison obtained by OBIA approach presented in [13] and OBIA-ML for mapping informal settlements](https://thumb-us.123doks.com/thumbv2/123dok_us/8018415.1333429/17.595.69.525.143.333/summary-accuracy-assessment-comparison-obtained-approach-presented-settlements.webp)
