
Type of the Paper (Review)
The Potential of Speleothems from Western Europe
as Recorders of Regional Climate: a Critical
Assessment of the SISAL Database
Franziska A. Lechleitner
1*, Sahar Amirnezhad-Mozhdehi
2, Andrea Columbu
3, Laia Comas-Bru
2,
Inga Labuhn
4, Carlos Pérez-Mejías
5, and Kira Rehfeld
61 Department of Earth Sciences, University of Oxford, South Parks Road, Oxford OX1 3AN, UK; [email protected]
2 UCD School of Earth Sciences, O’Brien Science Centre West, University College Dublin, Belfield, Dublin 4, Ireland; [email protected] (S.A.M.), [email protected] (L.C.-B.)
3 Department of Biological, Geological and Environmental Sciences, University of Bologna, Via Zamboni 67, 40126 Bologna, Italy; [email protected]
4 Institute of Geography, University of Bremen, Germany; [email protected] (ORCID 0000-0003-3755-5264)
5 Department of Geoenvironmental Processes and Global Change, Pyrenean Institute of Ecology (IPE – CSIC), Avda. Montañana 1005, 50059 Zaragoza, Spain ; [email protected]
6 Institute of Environmental Physics, Ruprecht-Karls-Universität Heidelberg, Im Neuenheimer Feld 229, 69210 Heidelberg, Germany; [email protected]
* Correspondence: [email protected]
Abstract:
Western Europe is the region with the highest density of published speleothem δ
18O
(δ
18O
spel) records worldwide. Here we review these records in light of the recent publication of the
Speleothem Isotopes Synthesis and Analysis (SISAL) database [1]. We investigate how
representative the spatial and temporal distribution of the available records is for climate in Western
Europe, and review potential sites and strategies for future studies. We show that spatial trends in
precipitation δ
18O are mirrored in the speleothems, providing means to better constrain the factors
influencing δ
18O
spelat a specific location. Coherent regional δ
18O
speltrends are found over
stadial-interstadial transitions of the last glacial, especially in high altitude Alpine records. Over the
Holocene, regional trends are less clearly expressed, due to lower signal-to-
noise ratios in δ
18O
spel,
but can potentially be extracted with the use of statistical methods. Overall, this first assessment
highlights the potential of the European region for speleothem palaeoclimate reconstruction, while
underpinning the importance of knowledge of local factors for a correct interpretation of δ
18O
spel.
Keywords:
SISAL database, speleothem, cave, oxygen isotopes, Western Europe
,
palaeoclimate
1. Introduction
Speleothems (secondary cave carbonates) are a widely used archive for the reconstruction of
past terrestrial climate, and particularly for the investigation of high resolution climate variability,
owing to their often exceptional chronological control [2,3]. The first version of the SISAL database
(SISAL_v1) contains 376 speleothem records from across the globe [1]. About a quarter of these
records (92) are from Western Europe, making it the region with the highest density of published
speleothem datasets worldwide [1]. This paper reviews these records within the wider
(palaeo-)climatic context of Western Europe, with the objective to identify and promote the potential of cave
sites in the region for future palaeoclimate studies.
While early studies on Western European speleothems principally focused on their availability
for temperature reconstruction u
sing δ
18O of the carbonate [4,5]
, it was quickly recognised that δ
18O
spelis driven by a complex interplay of regional and site-specific factors, such as moisture source and
circulation dynamics, amount of precipitation, dripwater residence time in the overlying karst, cave
temperature and ventilation dynamics, and potential kinetic effects during carbonate deposition [6,7].
Because of the filtering effect of the soil-karst system,
the δ
18O
spelsignal is usually strongly attenuated
compared to precipitation δ
18O, and affected to varying degrees by local noise [8]. This is particularly
pronounced at mid-latitude sites and o
ver the Holocene, when ranges in δ
18O
spelare typically small
(average standard deviation of Western European δ
18O
spelin SISAL_v1 is 0.36‰) and reflect only
moderate climate shifts. Over glacial-interglacial timescales, changes in the seasonality of
precipitation and stationarity of climate patterns need to be considered as additional external drivers
for variability in δ
18O
spel[9,10]. These, along with the fact that the climatic significance of a given
speleothem-based record depends on the local climate, geology, hydrology, and vegetation,
underpins the importance of interpreting speleothem records in their specific context. Western
Europe possesses the highest density of Global Network of Isotopes in Precipitation (GNIP; [11])
stations worldwide, which provide information on climatic drivers of precipitation δ
18O in the region.
Moreover, many cave sites are well studied, with continuous, high-resolution multiannual cave
monitoring time series, and a good understanding of local climatic conditions. Monitoring data from
caves and their surface environment provide a basis for understanding speleothem growth
conditions in a specific setting (e.g., [12
–
16]). These present-day observations are enormously useful
to delineate and characterize processes influencing speleothem geochemistry, and of critical
importance for the calibration of recent speleothem records against meteorological data.
Given the almost unique ability of speleothems to provide high-resolution palaeoclimate records
with tight chronological control, they are powerful archives for examining changes in climate
variability and modes, and thus refine the picture obtained by other palaeoclimate archives. Focusing
on Western Europe, where a large amount of palaeoclimate records from both speleothems and other
archives is available, provides an opportunity to disentangle changes in mean climate state and
variability.
Here we provide an overview of climate in Western Europe, before describing the available data
in SISAL_v1 [1]. This study is focused at highlighting the potential of this new database for
reconstructing regional trends in δ
18O
spel, as well as identifying common issues encountered with
speleothem records from this region.
2. Study Region and Climate
We define Western Europe roughly as the region between 11 and 16°E, and 36 and 71°N, based
on political borders, and subdivide it into Southern Europe (< 45°N; Iberian Peninsula, Southern
France, Italy except the alpine region), Northern Europe (> 45°N; Germany, Northern France,
Belgium, Netherlands, Scandinavia), and the Alpine region (Austria, Switzerland, Italian Alps;
Figure 1). Soluble lithologies, notably carbonates and evaporites, are present throughout the region,
with the exception of most of Scandinavia, Northern Germany and the Netherlands, and parts of the
Iberian Peninsula (Figure 1).
The present-day climate is characterised by strong spatial heterogeneity, and climate conditions
become increasingly continental moving eastward from the Atlantic Ocean, as a result of
predominant westerly moisture transport [17
–
19]. A latitudinal gradient is also present between the
temperate-humid climate of Northern Europe and the seasonally arid climate of the Mediterranean
region. These spatial gradients are reflected in the regional patterns of precipitation δ
18O, and are
predominantly related to
the continental effect, with lower δ
18O due to progressive rainout and
Rayleigh distillation with increasing distance from the Atlantic coast [8,20]. Deviations from this
trend are found in Southern Europe, where the influence of water vapour from the Mediterranean
Sea can lead to hi
gher δ
18O values [21], and the Alpine region, where the altitude effect lowers
precipitation δ
18O [20,22].
and modulate precipitation δ
18O [26
–
31]. On top of shifts in NAO polarity, changes in the location
and geograph
ical extension of the NAO’s centres of action can occur, in particular related to the
influence of other modes of climate variability in the North Atlantic region (e.g., the East Atlantic and
Scandinavian patterns [32
–
34]). In the Mediterranean region, precipitation is largely controlled by the
Western Mediterranean Oscillation (WeMO), understood as an East-West dipole of sea-level
pressures between the Azores High and the Ligurian Low [35].
Regional and temporal variability in climate conditions are challenging with regards to the
interpretation of palaeoclimate records, which are limited spatially and by temporal resolution and
chronological accuracy. Thus, the potential of a large database of speleothem records lies in the
possibility of extracting regional climate patterns from local responses at individual cave sites.
3. Western European Records in SISAL_v1
3.1. Spatio-temporal coverage and regional potential
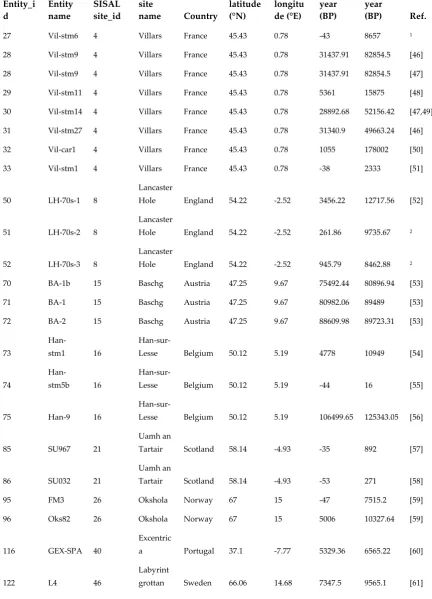
In total, 146 published speleothem isotope records have been identified in Western Europe.
Almost a hundred of these records (80 stalagmites, 7 flowstones, and 5 composites) from 41 caves are
currently included in SISAL_v1 [1], with 11 records from the British Isles, 24 from Southern Europe,
22 from Northern Europe, and 35 from the Alpine region (Figure 1, Table 1).
Regional distribution of records with respect to the occurrence of soluble lithologies (carbonate
and evaporite rocks) is patchy, in particular in central France and Germany, Eastern central Spain,
and central-Southern Italy, where few records are published. While these lithologies do not
necessarily contain caves and speleothems, these regions are potential targets for future
speleothem-based palaeoclimate investigations. However, many sites in the region are protected, either due to
the rich speleothem decorations or the presence of archaeological remains, requiring minimal
sampling impact and close collaboration with other researchers and/or local caving communities.
Temporal coverage of the Western European records in SISAL_v1 reaches back to ~400 ka, with
stalagmite CC-1 from Antro del Corchia in Italy providing the longest record (~265 kyrs, i.e.,
kilo-years, including growth stops; [37], Figure 2). Note that, in this study, ka BP is defined as thousand
years before present, with the present referring to 1950 CE. The majority of the records however only
cover the Holocene, with 8 speleothems deposited during the last millennium (Figure 2B). Temporal
coverage of speleothem records beyond the Holocene steadily decreases with increasing age, with
17% of all records starting to grow during the Last Glacial period (~12
–
80 ka), 15% during Marine
Isotope Stage 5 (MIS 5; ~80
–
135 ka), and 10% before MIS 5. The average length of the records is ~16
kyrs, including growth interruptions (min: ~50 years; max: ~265 kyrs; median: ~6.7 kyrs). Many
records (33%), especially the longest ones, contain at least one hiatus (Figure 2). The longest
uninterrupted record, stalagmite CC-5 from Antro del Corchia, Italy, covers ~80 kyrs [38]. The
average chronological resolution over all records is 17 years, gradually decreasing with record
length/antiquity (Figure 2). Some records have seasonal (e.g., Gib04a from St. Michaels Cave,
Gibraltar; [64]) or annual resolution (e.g., ER76 from Ernesto Cave, Italy; [40]), but others only provide
multi-decadal and centennial information (e.g., CC-1 from Antro del Corchia, Italy; [63]). The vast
majority of records deposited since the end of the Last Glacial Maximum (LGM; last 21 kyrs) have
annual to multi-decadal resolution over most of their length (Figure 2B). A tendency to more
speleothem growth during interstadials and interglacials is apparent, especially at high latitudes
(Figure 2A), highlighting the dominance of temperature control on hydroclimate and vegetation/soil
dynamics in this region.
Figure 2. Temporal coverage of the Western Europe records present in SISAL_v1. A – records covering pre-Holocene time intervals. If a record extends into the Holocene, that part is shown in B. B – records covering the last 22 ka. MIS and glacial terminations (T) timings according to Lisiecki & Raymo (2005; [45]). Hiatuses in individual records are shown by blank spaces.
Entity_i d
Entity name
SISAL site_id
site
name Country
latitude (°N)
longitu de (°E)
Min. year (BP)
Max. year
(BP) Ref.
27 Vil-stm6 4 Villars France 45.43 0.78 -43 8657 1
28 Vil-stm9 4 Villars France 45.43 0.78 31437.91 82854.5 [46]
28 Vil-stm9 4 Villars France 45.43 0.78 31437.91 82854.5 [47]
29 Vil-stm11 4 Villars France 45.43 0.78 5361 15875 [48]
30 Vil-stm14 4 Villars France 45.43 0.78 28892.68 52156.42 [47,49]
31 Vil-stm27 4 Villars France 45.43 0.78 31340.9 49663.24 [46]
32 Vil-car1 4 Villars France 45.43 0.78 1055 178002 [50]
33 Vil-stm1 4 Villars France 45.43 0.78 -38 2333 [51]
50 LH-70s-1 8
Lancaster
Hole England 54.22 -2.52 3456.22 12717.56 [52]
51 LH-70s-2 8
Lancaster
Hole England 54.22 -2.52 261.86 9735.67 2
52 LH-70s-3 8
Lancaster
Hole England 54.22 -2.52 945.79 8462.88 2
70 BA-1b 15 Baschg Austria 47.25 9.67 75492.44 80896.94 [53]
71 BA-1 15 Baschg Austria 47.25 9.67 80982.06 89489 [53]
72 BA-2 15 Baschg Austria 47.25 9.67 88609.98 89723.31 [53]
73
Han-stm1 16
Han-sur-Lesse Belgium 50.12 5.19 4778 10949 [54]
74
Han-stm5b 16
Han-sur-Lesse Belgium 50.12 5.19 -44 16 [55]
75 Han-9 16
Han-sur-Lesse Belgium 50.12 5.19 106499.65 125343.05 [56]
85 SU967 21
Uamh an
Tartair Scotland 58.14 -4.93 -35 892 [57]
86 SU032 21
Uamh an
Tartair Scotland 58.14 -4.93 -53 271 [58]
95 FM3 26 Okshola Norway 67 15 -47 7515.2 [59]
96 Oks82 26 Okshola Norway 67 15 5006 10327.64 [59]
116 GEX-SPA 40
Excentric
a Portugal 37.1 -7.77 5329.36 6565.22 [60]
122 L4 46
Labyrint
123 L03 47
Larshulle
t Norway 66 14 130 3920.52 [62]
129 YD01 53
Pippikin
Pot England 54.21 -2.51 4205.58 9478.94 [52,63]
133 7H 55
Sieben Hengste
Switzerla
nd 46.75 7.81 14620 29873 [64]
134 7H-2 55
Sieben Hengste
Switzerla
nd 46.75 7.81 17137.17 29940.32 [64]
135 7H-3 55
Sieben Hengste
Switzerla
nd 46.75 7.81 14639.45 23536.89 [64]
137 SG95 57
Soylegrot
ta Norway 66 14 -43 4141.22 [41]
138 SPA12 58
Spannag
el Austria 47.08 11.67 60 5043 [65]
139 SPA70 58
Spannag
el Austria 47.08 11.67 4549 9894 [65]
140 SPA128 58
Spannag
el Austria 47.08 11.67 2520 6140 [65]
141 SPA127 58
Spannag
el Austria 47.08 11.67 2737 8449 [65]
142
COMNIS PA II 58
Spannag
el Austria 47.08 11.67 -13 9930.6 [65]
150
WSC-97-10-5 66
White
Scar England 54.17 -2.44 7347.87 11190.74 [52,63]
154 SPA133 58
Spannag
el Austria 47.08 11.67 9636.5 10796.1 [65]
162 BDinf 73
Bourgeoi s
Delaunay France 45.67 0.51 121339 128151 [66]
166
Chau-stm6 77 Chauvet France 44.23 4.26 11415 34183 [48]
180 Candela 87 Pindal Spain 43.4 -4.53 11640.32 29339.98 [67,68]
182 Gib04a 89
New St
Michael's Gibraltar 36.13 -5.35 -53.6 2 [39,69]
192 Boss 96
Brown's Folly
mine England 51.38 -2.37 -47 32 [70,71]
193 BFM-9 96
Brown's Folly
mine England 51.38 -2.37 -47 21 [70,71]
194 F2 96
Brown's Folly
195 BMS1 97
Bue
Marino Italy 40.25 9.62 110207 112881 [72]
196 CC3 98 Crag Ireland 52.25 -9.43 -47 10132 [73,74]
199 K1 100 Katerloch Austria 47.08 15.55 7079.5 10324 [75]
200 K3 100 Katerloch Austria 47.08 15.55 7786.62 10027.08 [75]
201 PFU6 101
Klapferlo
ch Austria 46.95 10.55 -47 2943.04 [76]
202 K11 102
Korallgro
ttan Sweden 64.88 14 -55 3791.88 [77]
206 SCH-5 105
Schnecke
nloch Austria 47.43 9.87 115340 134085 [78]
207 SCH-7 105
Schnecke
nloch Austria 47.43 9.87 111588.73 118314.57 [53]
208 SE09-6 106 Seso Spain 42.46 0.04 11616 12995 [79]
211 Cla4 108
Clamous
e France 43.71 3.55 74460 187405 [80]
212 CL26 108
Clamous
e France 43.71 3.55 142.33 11178.79 [73]
216 MO-1 109 Molinos Spain 40.79 -0.45 4727 11334.76 [81]
217 MO-7 109 Molinos Spain 40.79 -0.45 3253 6812 [81,82]
230 HOL-7 115
Hölloch im
Mahdtal Austria 47.38 10.15 40105 48664 [83]
231 HOL-16 115
Hölloch im
Mahdtal Austria 47.38 10.15 36701 63546 [83]
232 HOL-17 115
Hölloch im
Mahdtal Austria 47.38 10.15 35832 64934 [83]
233 HOL-18 115
Hölloch im
Mahdtal Austria 47.38 10.15 52509 57283 [83]
234
HOL-16-17 115
Hölloch im
Mahdtal Austria 47.38 10.15 35705 37578 [83]
235
HOL-comp 115
Hölloch im
Mahdtal Austria 47.38 10.15 49063 64498 [83]
236 HOL-10 115
Hölloch im
Mahdtal Austria 47.38 10.15 110844 131765 [78]
240 Bu1 117 Bunker Germany 51.37 7.66 137 6644.9 [84]
241 Bu2 117 Bunker Germany 51.37 7.66 7497.6 10723.5 [84]
243 Bu6 117 Bunker Germany 51.37 7.66 8749 10258.2 [84]
244 BuStack 117 Bunker Germany 51.37 7.66 -57.4 10723.5 [84]
248 ASR 119
Cueva de
Asiul Spain 43.32 -3.59 488.61 12160.96 [85]
249 ASM 119
Cueva de
Asiul Spain 43.32 -3.59 -62 7776.64 [85]
250 HOR 120 Ejulve Spain 40.45 -0.35 2708.44 6071.82 [81]
251
ARTEMI
SA 120 Ejulve Spain 40.45 -0.35 218975.67 257426.49 [10]
252 TKS 121
Entrische
Kirche Austria 47.16 13.15 113389.5 126889.04 [86]
255 MB-2 123
Milchbac h
Switzerla
nd 46.62 8.08 3248.65 6830 [87]
256 MB-3 123
Milchbac h
Switzerla
nd 46.62 8.08 1986.95 9025.84 [87]
257 MB-5 123
Milchbac h
Switzerla
nd 46.62 8.08 3889.71 7245.91 [87]
258 MB-6 123
Milchbac h
Switzerla
nd 46.62 8.08 [87]
260 MF-3 125
Schafsloc h
Switzerla
nd 47.23 9.38 130050 137390 [88]
261 SPA121 58
Spannag
el Austria 47.08 11.67 187290 242070 [89]
277 CR1 129
Grotta di Carburan
geli Italy 38.17 13.16 947.73 8373.72 [90,91]
279 ER76 131
Grotta di
Ernesto Italy 45.97 11.65 2511.48 7969.05 [40]
280 SPA_126 132
Kleegrub
en Austria 47.08 11.67 47396 55966 [92]
281 SPA_49 132
Kleegrub
en Austria 47.08 11.67 47816 58266 [92]
282 RL4_2006 133
Buca della
Renella Italy 44.08 10.21 1215.56 6928.36 [93]
283 RL4_2016 133
Buca della
Renella Italy 44.08 10.21 1150.37 7262 [94]
310 ESP03 143
Cova da
Arcoia Spain 42.61 -7.09 340 9440 [95]
313
CC-1_2004 145
Antro del
Corchia Italy 43.98 10.22 125432.63 393407.69 [37]
314
CC-5_2005 145
Antro del
315 CC-28 145
Antro del
Corchia Italy 43.98 10.22 95191.16 117497.82 [96]
316
CC-1_2009 145
Antro del
Corchia Italy 43.98 10.22 127997 148970 [97]
317
CC-5_2009 145
Antro del
Corchia Italy 43.98 10.22 117965 156957 [97]
318 CC-7 145
Antro del
Corchia Italy 43.98 10.22 121333 126805 [97]
381 RL4_2018 133
Buca della
Renella Italy 44.08 10.21 1024.11 7277.24 3
Romeo
Cueva
Rosa Spain 43.43 -5.13 5294 8097 [98]
C11
Cueva del
Cobre Spain 42.98 -4.37 77 2614 [99]
GAR-01
La
Garma Spain 43.43 -3.66 10142 13757 [100]
GAR-02
La
Garma Spain 43.43 -3.66 0 1000 [101]
comp. Kaite Spain 42.94 -3.57 394 9569 [102]
LV5 Kaite Spain 42.94 -3.57 393 3885 [99]
SLX1
Cueva
Mayor Spain 42.37 -3.51 62 1513 [99]
Vil#10B Villars France 45.43 0.78 [103]
Vil#1A Villars France 45.43 0.78 [103]
VilGal#1
B Villars France 45.43 0.78 [103]
VilPlq-8 Villars France 45.43 0.78 [103]
Vil-stm24 Villars France 45.43 0.78 102800 113600 [104]
Fra-stm-6 La Faurie France 45.13 1.18 [103]
GC-01-05-02 Gitana Spain 37.44 -2.02 58000 274000 [105]
CCF-03-03-01
Cova de Cala
Falco Spain 39.5 3.3 48000 112000 [106]
Cla-stm5
Clamous
e France 43.71 3.55 432000 611000 [104]
Proserpi ne
Han-sur-Lesse
Belgium 50.12 5.19 -51 471 [107]
PN-stm-95-5
Pere
Noel Belgium 50.13 5.16 1800 12900 [108,109]
STAL-B7-1 B7 Germany 51.3667 7.6506 6196 12405 [110]
STAL-B7-5 B7 Germany 51.3667 7.6506 5850 8810 [110]
STAL-B7-7 B7 Germany 51.3667 7.6506 540 17230 [110]
STAL-AH-1 Atta Germany 50.8 7.44 1763 2723 [111]
AH-1 Atta Germany 50.8 7.44 860 8430 [112]
EXC-3 Beatus
Switzerla
nd 46.38 7.49 100940 110000 [53]
EXC-4 Beatus
Switzerla
nd 46.38 7.49 77450 107080 [53]
KC-1
Klaus-Cramer Austria 47.26 9.52 54560 71940 [53]
Hölloch im
Mahdtal Austria 47.38 10.15 1380 12690 [113]
COR-1
Antro del
Corchia Italy 43.98 10.22 [103]
CC-26
Antro del
Corchia Italy 43.98 10.22 750 11260 [114]
PFU-7
Klapferlo
ch Austria 46.95 10.55 [76]
PFU-8
Klapferlo
ch Austria 46.95 10.55 [76]
PFU-9
Klapferlo
ch Austria 46.95 10.55 [76]
HOT-1
Hötting
Breccia Austria 47.28 11.39 73900 98700 [115]
HOT-2
Hötting
Breccia Austria 47.28 11.39 70300 73800 [115]
SPA-4
Spannag
el Austria 47.08 11.67 265700 353900 [116,117]
SPA-59
Spannag
el Austria 47.08 11.67 52900 261400 [118]
SPA-12
Spannag
el Austria 47.08 11.67 15 2040 [119]
SPA-119
Spannag
el Austria 47.08 11.67 220500 226900 [116]
SPA-11
Spannag
el cave Austria 47.08 11.67 117000 202800 [120]
SPA-52
Spannag
ENT-10
Entrische
Kirche Austria 47.16 13.15 114000 127000 [86]
SV-1
Grotta
Savi Italy 45.61 13.88 1325 16799 [121]
SG92-4
Soylegrot
ta Norway 66 14 4500 8000 4
SG-92-2
Soylegrot
ta Norway 66 14 320000 630000 [42]
SG93
Soylegrot
ta Norway 66 14 253 10409 [5]
Ham-85.2
Hamarne
s Norway 66.42 14.02 4510 123000 [41]
K1
Korallgro
ttan Sweden 64.88 14.15 6070 8629 [61]
PL-6 Laphullet Norway 66.31 14.18 380000 502000 [43]
K-2 Katerloch Austria 47.08 15.55 [122]
K-4 Katerloch Austria 47.08 15.55 [122]
K-5 Katerloch Austria 47.08 15.55 [122]
K-6 Katerloch Austria 47.08 15.55 [122]
K-7 Katerloch Austria 47.08 15.55 [122]
K-8 Katerloch Austria 47.08 15.55 [122]
K-RZ6-072007 Katerloch Austria 47.08 15.55 [103]
K-Top3-Cl Katerloch Austria 47.08 15.55 [103]
Table 1. Summary of all records currently included in SISAL_v1 for Western Europe and records identified but not yet included.
1 D. Genty, unpublished work
2 Atkinson, T.C., Hoffmann, D., unpublished
3 R. Drysdale et al., unpublished
4 Berstad et al., 1998
3.2. Dating Methods and Chronologies
Any palaeoclimatic interpretation hinges on the accuracy of the dating method and age
modelling technique applied. Speleothems are known for their precise U-Th chronologies, but other
dating methods (e.g., layer counting, radiocarbon) are applied as well, often in combinations.
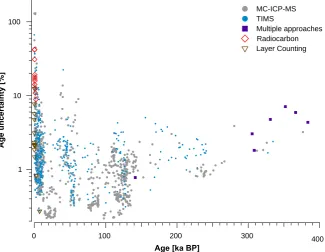
SISAL_v1 contains 1189 ages from Western European speleothems, 96% of which were obtained with
the U-Th method. U-Th ratios were measured by Multi Collector-Inductively Coupled Plasma-Mass
Spectrometry (MC-ICP-MS; 62% of the total) or Thermal Ionisation Mass Spectrometry (TIMS; 34%
of the total). For the calculation of corrected ages, the most recent publications use the U-Th decay
constants published in [123,124], while older datasets mostly refer to [125]. Other dating approaches
such as
14C analyses (e.g., [39,51]), layer counting (e.g., [40,126]) or approaches combining multiple
ages is 1.2%, ranging between 0 and 131%; uncertainties of 0% refer only to the top of actively growing
speleothems. The dating uncertainties vary according to the method used (Figure 3), with
MC-ICP-MS dates being the most accurate (median 0.9%; min 0.2%; max 131%), followed by TIMC-ICP-MS (1.5%; 0.3%;
67%), layer counting (2%; 0%; 13%), combination of multiple approaches (4%; 1%; 7%) and
14C (17%;
4%; 42%). It should be noted that U-Th uncertainty increases in younger samples (i.e., last millennia),
reflecting the difficulties in measuring the low radiogenic
230Th content for recent speleothems [127]
(Figure 3). For these young speleothems, other dating methods such as
14C and layer counting might
be more suitable and result in less overall uncertainty, as demonstrated by [39], who used a
combination of
14C measurements and counting of minima in seasonal stable carbon isotope ratio
(δ
13C) cycles to derive a precise chronology for a 53-year old stalagmite (Gib04a) from Gibraltar. For
laminae counting, uncertainties are usually attributed after a series of independent counts (e.g., [71]),
and offsets between band-counted and radiometric ages might occur if annual layers are missing
(undercounting) and/or if intra-annual lamination is present (overcounting; [128,129]).
Figure 3. Dating methods, ages and age uncertainties. Shown are results in SISAL_v1 for MC-ICP-MS and TIMS U-Th dating, 14C dating, laminae counting, and combinations of these methods (mostly U-Th or 14C combined with laminae counting). Note that, for simplicity, ages with 0% uncertainty (i.e., top of actively growing speleothems) were excluded.
A vast variety of methods and algorithms is available to convert single dates to an age-depth
model and, in most cases, calculate the propagation of age uncertainties through time. For Western
European speleothems in SISAL_v1, the modelling procedures used are: StalAge (25%; [130]), linear
interpolation (19%), Bayesian (not including OxCal, Bacon, BChron, and COPRA; 11%), polynomial
fit (10%), OxCal (3%; [131]
) and others or a combination of methods (30%). Here, “combination of
methods” usually stems from the use of different dating techniques, e.g.,
14C and laminae counting
in Gib04a from Gibraltar [39] or U-Th analysis and laminae counting in speleothems in Uamh an
Tartair [126] and Larshullet Cave [62]. In our dataset, 13% of all ages were excluded from the final
age-depth models in the original publications, mostly because they were not in the correct
stratigraphic order and were thus considered unreliable. In radiometric dating, out-of-sequence
anomalous ages can occur due to diagenetic phenomena affecting the carbonate fabric, and/or sources
of error during sample preparation and analysis (e.g., cross-contamination, environmental
contamination, spike calibration problems, [72,132
–
135]).
1 10 100
A
g
e
u
n
ce
rt
a
in
ty
[
%
]
400 300
200 100
0
MC-ICP-MS TIMS
Multiple approaches Radiocarbon Layer Counting
All age modelling protocols have their advantages and shortcomings [136], and emphasise
different aspects of chronology development. In many cases, the age model for a single speleothem
needs to take into account specific properties of the sample, e.g., petrographic and geochemical
anomalies, and is thus to a certain extent subjective to the decisions of the user. This is important to
ascertain the quality of the age-depth model for an individual speleothem, but might introduce
biases. An updated age modelling technique intercomparison study appears timely with the
publication of SISAL_v1 and would be helpful to determine common strengths and weaknesses in
the models.
3.3. Availability of Environmental and Monitoring Data
Local climate and cave monitoring data are useful for the characterisation of the karst system
and the processes acting on geochemical signatures recorded in speleothems. With sufficiently long
time series of outside and in-cave temperature, and isotopic composition of precipitation and drip
water, it is possible to estimate t
he extent to which δ
18O
spelrecords are representative of present-day
external environmental signals. This is important, as fluid transfer through the karst system results
in lagging, attenuation, or modification of the original precipitation signature. It must be noted,
however, that this modern information needs to be carefully evaluated in the context of past climate,
as the processes driving them might be temporally non-stationary and responding to climatic
changes themselves (e.g., vegetation and soil cover, precipitation seasonality, changes in the
temperature gradient between cave and exterior).
In Western Europe, temperature and precipitation data is widely available from meteorological
stations for at least a few decades. Moreover, Europe has some of the longest meteorological records
in the world, which go back to the 18
thcentury (e.g., [137
–
139]). Gridded reanalysis or observational
datasets provide continuous spatial coverage at high resolution since the late 19
thcentury [140] and
over 300 GNIP sites provide monthly or event-based measurements of isotopes in precipitation.
Roughly 36% of these GNIP sites have been active for at least 10 years, and 57% for at least 5 years,
providing an invaluable source of data to understand variability in precipitation and speleothem δ
18O
(e.g., [88,89]). In-cave monitoring data, in contrast, is usually acquired within the context of specific
speleothem studies, and is thus often limited by short-term, project-based funding or limited
accessibility to the cave. Of the 174 cave systems included in the SISAL_v1 database, 66 have been
monitored over at least one season (compared to 70 caves with no monitoring, and 38 where status
of monitoring is unknown) and 22 of these are in Western Europe (53% of all caves in SISAL_v1 of
the region).
3.4. Climate Controls on Speleothem Growth
In Western Europe, speleothem growth is promoted during interglacials and interstadials, when
climate is warmer and more humid (Figure 2A). Presence/absence of growth and growth rate can
both be powerful proxies for palaeoclimate conditions (e.g., [126,143,144]). The most straightforward
climatic influence on speleothem growth is the presence of ice or permafrost above the cave, which
prevent water percolation through the soil-karst system. This is observed at the Scandinavian cave
sites, where speleothem growth is limited to interglacial time periods [43,59]. Conversely, evidence
from high Alpine caves has shown that
“subglacial”
speleothem growth is possible if carbonate
dissolution is promoted by sulphide oxidation, for instance seen in stalagmites from Milchbach Cave,
Switzerland [87] and Spannagel Cave, Austria [116].
Changes in soil and vegetation activity are another mechanism influencing speleothem growth,
as soil
p
CO
2drives carbonate dissolution in the karst. Examples for such sites sensitive to changes in
soil
p
CO
2are Villars Cave in France, where cold phases during the last glacial are reflected by hiatuses
been scarcely targeted by researchers so far (Figure 1). Given the range of processes that can force
speleothem growth cessation, a climatic interpretation of growth presence/absence and growth rates
hinges on an assessment of potential site-specific controls.
3.5. Controls on
δ
18O
spelA multitude of factors can influence δ
18O
spel, from local effects such as cave temperature and
karst infiltration dynamics, to processes driving precipitation δ
18O (air temperature, precipitation
amount and seasonality, moisture source and circulation dynamics). This is especially pronounced
at the mid-latitude sites of Western Europe, where competing forcings and a generally weaker climate
control (especially during the Holocene) require detailed evaluation
of the drivers of δ
18O
spel.
The δ
18O
spelat sites included in SISAL_v1 is interpreted as dominantly reflecting air temperature
(17 sites), precipitation amount (6 sites), moisture source (1 site), or a mixed signal of temperature
and amount/moisture source (9 sites). T
he interpretation of δ
18O
spelremains unclear for 8 sites, as the
original publications had a different focus.
A dominant temperature signal is found principally at high-altitude sites in the Alps (Baschg
[53], Entrische Kirche [86], Grotta di Ernesto [40], Hölloch im Mahdtal [83], Katerloch [75],
Kleegruben [92], Schafsloch [88], Schneckenloch [53,78]
). At these sites, δ
18O
spelis understood to
closely reflect precipitation δ
18O, which is highly correlated to changes in air temperature during
moisture condensation, with higher (lower) δ
18O reflecting warmer (colder) conditions (e.g., [83]).
The authors of the original studies however emphasise that factors such as rainfall seasonality
[53,75,86,88] or moisture source changes [78,83,89] play an additional role in the modulation of
δ
18O
spel, preventing a quantitative reconstruction of surface air temperatures. Interestingly, an
opposite δ
18O-
temperature relationship (higher δ
18O
spelcorresponding to lower temperature) has been
reported for some alpine sites, most prominently Spannagel Cave, where δ
18O
spelhas been interpreted
in terms of variable dripwater sources (snowmelt water vs. rainfall), with more negative
δ
18O values
reflecting a larger contribution of melt waters and less negative
δ
18O explained by a stronger share of
meteoric waters due to glacier retreat during interglacials [120,145]. The high-latitude Scandinavian
caves (Søylegrotta [41], Okshola [59], Labyrintgrottan [61], Korallgrottan [77] and Larshullet [62])
show the same reversed δ
18O-temperature relationship, corroborated by temperature calibration
studies [5,41], and are also explained by seasonally selective infiltration during snowmelt [59,61].
Only three sites at lower altitudes report a dominant temperature effect on δ
18O
spel(Han-sur-Lesse
[56], Clamouse [73,80], and Crag [73]).
Sites with
a dominant influence of precipitation amount on δ
18O
spelare widely spread throughout
the region (Antro del Corchia [37,38,96,97], Buca della Renella [93,94], Bue Marino [72],
Burgeois-Delaunay [66], Cueva de Asiul [85], Klapferloch [76]). In all
these cases, higher (lower) δ
18O
spelis
interpreted to reflect lower (higher) rainfall amount, as a consequence of isotopic depletion of
precipitation during large storms [146]
. Correlating speleothem δ
18O
and carbon isotope ratios (δ
13C)
often helps discerning whether δ
18O
spelis driven by precipitation amount (e.g., [66,72]).
Several sites (Bunker [84], Cova da Arcoia [95], El Pindal [67], Grotta di Carburangeli [90],
Molinos [81], Uamh an Tartair [57,58], Villars [46
–
50]) show a mixed signal of temperature and
precipitation amount controls, which reduces their interpretability.
Moisture source is the third main driver for δ
18O
spelin Western Europe, as precipitation in these
areas can originate from either the Atlantic or the Mediterranean, with the latter exhibiting higher
δ
18O values [21,147,148]. Moreover, changes in atmospheric circulation patterns can lead to shifts in
moisture trajectories and seasonality of precipitation at a site (e.g., [149]). These effects have been
recognised as partially influencing many of the records in SISAL_v1, mostly as second-order trends
(e.g., Baschg [53], Ejulve [10,81], Grotta di Ernesto [40], Schafsloch [88], Schneckenloch [53,78], Seso
[79]). The composite record from Sieben Hengste (7H) Cave, Switzerland, is the only one where
δ
18O
spelwas interpreted as principally reflecting changes between northerly and southerly moisture
Due to these different factors potentially influencing δ
18O
spelin Western Europe, other proxies
are often needed to better constrain the palaeoclimatic interpretation of the records,
e.g., δ
13C or trace
element ratios, and their use should be promoted in the future. One possibility to quantitatively
reconstruct
the isotopic signature of the “
parent
”
precipitation δ
18O is through fluid inclusion stable
isotope analysis in speleothems [49,51]. Fluid inclusions provide a more direct record of precipitation
δ
18O than speleothem calcite and allow the reconstruction of palaeo-temperatures when used in
combination with calcite δ
18O, if this has precipitated at isotopic equilibrium [150]. However, the
resolution of fluid inclusion δ
18O measurements remains much lower than for δ
18O
spel.
4.
Regional Patterns in δ
18O
spelRecords Through Time
4.1. Spatial Trends and Comparison to Observations
Quantitative comparison between SISAL sites and the GNIP interpolated precipitation data
([151], available at www.waterisotopes.org) reveals moderate correlation (r
2= 0.33, 22 sites, under the
assumption of full independence between sites), with clear deviation from the 1:1 line, specially for
high latitude sites (Figure
4A). Converting the precipitation δ
18O value
s to “speleothem”
δ
18O values,
i.e., taking into account the water-calcite fractionation using the relationship described in Kim and
O’Neil (1997)
[152] and correcting for offset between VSMOW and VPDB, reduces the correlation
slightly (r
2= 0.27, 22 sites), but altogether brings the agreement between precipitation and δ
18O
spelslightly closer to the 1:1 line (Figure 4B). It is apparent from this comparison that high latitude SISAL
sites are strongly offset from their corresponding precipitation δ
18O values and removing these sites
from the comparison between SISAL and interpolated GNIP data improves the correlation
considerably (r
2= 0.42, 17 sites, Figure 4C).
The present-
day spatial trends in δ
18O (Figure 5) reflect the dominant climatic processes reflected
in precipitation δ
18O and provid
e the opportunity to establish “base lines”
of δ
18O
spel, to which
high-frequency changes can be compared, as well as to check whether single isotope records might be
anomalous within their regional climatic context [8]. On the whole, a very similar East-West trend in
δ
18O is apparent for precipitation and speleothems (Figure 5), which reflects increasing rainout away
from the Atlantic (continental effect, [20]). Smaller-
scale trends, such as the high δ
18O values found in
the circum-Mediterranean region, and the altitude effect apparent in the Alpine region, are mirrored
by the SISAL data. Despite this good spatial agreement over Western Europe, discrepancies are
apparent with respect to absolute δ
18O values, as seen in the 2‰ offset in the regression equations
Figure 4. SISAL δ18O vs. mean annual weighted precipitation δ18O for the time period 1958-2015 from waterisotopes.org [151]. Colour coding indicates the latitude of the sites. A – Correlation between mean annual weighted precipitation δ18O (in ‰ VSMOW) and δ18Ospel in SISAL (in ‰ VPDB; n=22), as shown in Figure 5. Precipitation δ18O was extracted at the locations corresponding to a SISAL site. B – Similar to A, but after converting precipitation δ18O to calcite values using the equation in [152] for δ18O water-calcite fractionation and converting from VSMOW to VPDB. C – Same as B, for latitudes between 30 and 55°N (n=17).
Local conditions are known to affect speleothem geochemistry and need to be taken into account
when developing transfer functions for climate reconstruction. The isotopically effective recharge [7],
related to the dominant infiltration season and the degree of mixing in the karst aquifer, can
substantially affect the correlation between δ
18O
speland precipitation δ
18O [142,153]. Small-scale
variability in mountain climate that is not captured by the interpolation approach used for the GNIP
data is likely the reason for the offset between SISAL sites and the GNIP data in the Alpine region
and northern Scandinavia (Figure 5; [28]).
-12 -10 -8 -6 -4 -2 0
-15 -10 -5 0 30 40 50 60 70 L a it u d e (d eg re es N )
-12 -10 -8 -6 -4 -2 0
-15 -10 -5 0
y = 0.54x - 2.25 R2 = 0.27; n=22
mean weigthed d18O
precip converted to d18Ostal
-12 -10 -8 -6 -4 -2 0
-15 -10 -5 0
y = 1.17x -1.50 R2 = 0.42; n=17
Lat < 55°N y = 0.33x - 2.46 R2 = 0.33; n=22
S IS A L m ea n δ 18O
mean weigthed d18O
precip converted to d18Ostal mean weigthed d18O
Figure 5. Comparison between mean annual weighted δ18O data from waterisotopes.org (background map; [123]) and SISAL records (filled circles; n=18). The latter have been averaged over the period 1958-2017 and are shown at their corresponding cave locations. The SISAL records were not filtered to have a minimum number of data points. Note that the averages of the speleothem records have been offset by -2‰, based on the correlations in Figure 4.
4.2. Last Glacial Period
The SISAL_v1 database contains 24 records that cover the last glacial time period
sensu latu
, i.e.,
the period between 10 and 120 ka (Figure 6). Many records from high altitude alpine cave sites show
a very clear response to millennial-scale forcing from the North Atlantic (e.g.; 7H, SPA 49, SPA 126,
HOL-7, HOL-10, HOL-16-17, HOL-comp, BA-1, BA-1b, BA-2; Figure 6B). This strong synchronicity
and similarity in the climatic response of the northern Alpine region and Greenland suggests a tight
coupling between the two regions, which is likely related to the strong temperature control in these
high altitude speleothems [83].
Speleothems from other cave sites in the region show a much less consistent pattern over the last
glacial period, probably as a result of the complex interplay of processes affecting δ
18O
spelat
mid-latitudes (Figure 6C). In some of these cases, the original authors used other geochemical proxies,
such as
δ
13C, for the palaeoclimate interpretation. Stalagmites from Villars and Chauvet caves in
France, for example, suggest a complex combination of temperature, precipitation amount and source
changes affecting and muting
their δ
18O
spel, whereas δ
13C appears to be more sensitive to
stadial-interst
adial forcing. The authors interpret these rapid shifts in δ
13C as reflecting changes in soil CO
2production, which is linked to temperature and humidity [46
–
48].
60 N
45 N
0
-15 -14 -13 -12 -11 -10 -9 -8 -7 -6 -5 -4
Figure 6. Examples of Western European records covering the last glacial period in SISAL_v1. To ease intercomparison of δ18Ospel, all records were normalised as z-scores. The onset of GIs is indicated by the grey triangles [154,155]. A – Greenland NGRIP ice core δ18O on the layer-counted GICC05modelext time scale for the last 60 kyrs, and extended further back on the ss09sea06bm time scale [155–157]. B – Records from the Alpine region (colour coded): 7H – Composite record from Sieben Hengste Cave, Switzerland [64], SPA – Stalagmites SPA 49 and SPA 126, Kleegruben Cave, Austria [92], HOL – Stalagmites HOL-7 and HOL-10, composite records HOL-16-17 and HOL-comp from Hölloch Cave, Austria [78,83], BA – Stalagmites BA-1, BA-1b, and BA-2 from Baschg Cave, Austria [53], SCH – Stalagmites SCH-5 and SCH-7 from Schneckenloch Cave, Austria [53,78], TKS – Flowstone TKS from Entrische Kirche Cave, Austria [86]. Note that TKS is shown on a different y-axis to ease visual comparison. C – Records from other parts of Western Europe (colour coded): SESO – Stalagmite SE09-6 from Seso Cave, Spain [79], PIN – Stalagmite Candela from El Pindal Cave, Spain [68,158], CHAU – Stalagmite Chau-stm6 from Chauvet Cave, France [48], VIL – Stalagmites Vil-stm9 and Vil-stm27 from Villars Cave, France [46,47], HAN – Stalagmite Han-9 from Han-sur-Lesse Cave, Belgium [56], BMS – Stalagmite BMS1 from Bue Marino Cave, Italy [72]. D – Chronological uncertainty of the records: speleothem U-Th ages are shown in colour coded dots. If available, the uncertainty of the age model is shown instead, as a more accurate measure of the time series uncertainty (lines). The black line indicates the maximum counting error of the layer-counted part of the ice core chronology [157].
4.3. Holocene Climate Variability
In our first assessment, we find no consistent regional trends in δ
18O
spelin SISAL_v1 records from
Western Europe spanning the entire Holocene period. This is partly due to age modelling
uncertainties and low temporal resolution in some records, which prevents the detection of climatic
shifts in δ
18O
spelduring periods with low signal-to-noise ratios. Although Holocene climate conditions
period around 8.2 ka, and nine of them were interpreted by the original authors as recording evidence
for a climatic perturbation at that time (Figure 7). Another four show changes in their growth and
petrography (i.e., hiatuses, erosional surfaces, changes in calcite fabrics) that can tentatively be related
to climate change around 8.2 ka. For most of the records, however, chronological uncertainty and/or
temporal resolution remain an issue, and the detailed structure and timing of the 8.2 ka event often
cannot be resolved (Figure 7). As a result of the paucity of available datasets it is also not possible at
this stage to assess any regional trends in the expression of the 8.2 ka event in stalagmites from
Western Europe. Recent advances in analytical and sampling methods provide an opportunity for
future studies to obtain more detailed insights into this event, both in previously sampled records
and at new sites.
Figure 7. Examples of Western European records in SISAL showing evidence for a climatic perturbation over the 8.2 ka event. To facilitate intercomparison of δ18Ospel, all records were normalised as z-scores. The duration of the 8.2 ka event is shown with the grey bar [154]. K1, K2 – Stalagmites from Katerloch Cave, Austria [75], CR1 – Stalagmite from Grotta di Carburangeli, Italy [90], BuStack – Composite record from Bunker Cave, Germany [84], WSC-97-10-5 – Stalagmite from White Scar Cave, England [63], YD01 – Stalagmite from Pippikin Pot Cave, England [63]. Ages with respective 2σ uncertainties are shown below each record. For WSC-97-10-5 and YD01, the uncertainties of the age model are also shown (shaded error bars underlying the time series). Note that the uncertainty of the Bunker Cave composite record is likely smaller than suggested by the single U-Th ages, due to overlap of single stalagmite records, but this information was not available in SISAL_v1 [84]. Stalagmites with petrographic or growth rate evidence for a climatic event are shown in grey bars at the top: a glacier advance is suggested by petrographic changes in stalagmites from
7500 7600 7700 7800 7900 8000 8100 8200 8300 8400 8500
Age (yr BP)
-4 -2 0 2 4 z-sc o re δ 1 8O -4 -2 0 2 -4 -2 0 2 4 YD01 WSC-97-10-5 BuStack CR1 K1 K3
8.2 kyr event (Rasmussen et al., 2014)
z-sc o re δ 1 8O z-sc o re δ 1 8O Erosional surface (Cova da Arcoia) Growth start (ASM)
Milchbach Cave, Switzerland [87], growth cessation/start around the event is recorded by stalagmites ASR and ASM from Cueva de Asiul, Spain [85], and an erosional surface is found in stalagmite ESP03 from Cova da Arcoia, Spain [95].
4.4. The Last Two Millennia
We evaluated the regional coherency of δ
18O
spelover the last two millennia using the data in
SISAL_v1 by stacking all records covering at least 1/3 of the interval (-50
–
2000 yr BP) at reasonable
resolution (≥ 10 data points), and for which an age model is available. Nine records fulfil these
requirements: stalagmite Vil-stm1 from Villars Cave, France [51]; stalagmite LH-70s-3 from Lancaster
Hole, England (Atkinson, T.C. and Hoffmann, D., unpublished dataset); stalagmite FM3 from
Okshola Cave, Norway [59]; stalagmite L03 from Larshullet Cave, Norway [62]; stalagmite SG05 from
Soylegrotta Cave, Norway [41]; stalagmite CC3 from Crag Cave, Ireland [73]; flowstone PFU6 from
Klapferloch Cave, Austria [76]; stalagmite CL26 from Clamouse Cave, France [73]; and stalagmite
Bu4 from Bunker Cave, Germany [84]. After a Gaussian smoothing on a 100-year timescale was
performed for all records, they were interpolated to 5-year timescales. For the stack, the unweighted
average of all records was used, and no weighting based on location, correlation strength, or
uncertainty was performed.
Figure 8: Stacked record of SISAL entities covering the last 2000 years, compared to Global Volcanic Forcing (GVF; [160]), solar forcing (total solar insolation anomalies, dTSI; [161]), and CO2 concentrations from Antarctica’s Law Dome record [162]. Important climate periods are indicated, and defined according to the following references: Little Ice Age (LIA; [163]), Medieval Climate Anomaly (MCA; [164]), Late Antique Little Ice Age (LALIA), and Roman Warm Period (RWP; [165]).
The stacked record for the last 2000 years shows a long-
term trend towards more positive δ
18O
spelbetween 2000-550 yr, followed by a reversal and possibly a more oscillating behaviour (Figure 8). The
reversal in the stack (trend toward lower δ
18O
spel) at 550 yr falls within the Little Ice Age (LIA; [163]).
However there is no clear indication of systematic changes in δ
18O
spelcorresponding to the Roman
different climate signals recorded by the individual speleothems. It is important to note that the stack
captures the mean δ
18O
spelsignal in Western Europe, and not a single climate process, e.g.,
temperature or precipitation amount. A screening of the records based on their response to climate
was not possible at present, since most records are not calibrated against instrumental data. If more
records that fulfil this requirement become available, a stack based on the recorded climate process
might become feasible. In addition, future improvements of this procedure should tackle a regional
assessment of the trends using a higher number of records and possibly including proxy data from
other archives, checking correlations between nearby records, incorporating age uncertainties, and
the integration of the sign
al’s interpretation by the original authors.
5. Improvements to SISAL for Western Europe
Only 60% of the known records from Western Europe are in the SISAL_v1 database and the
remaining records are widely distributed across Europe (Austria: 22, Belgium: 3, France: 7, Germany:
5, Italy: 3, Norway: 5, Spain: 9, Sweden: 1, Switzerland: 2). We have shown, for the current version of
the database, that the speleothem records from Western Europe have potential to document some
aspects of past climate change. However, it is clear that outstanding issues need to be addressed first,
which in Western Europe can be summarised as i) improvement of temporal coverage, ii)
improvement of spatial coverage, especially with records calibrated against modern climate
conditions, and iii) a more comprehensive use of statistical approaches to extract underlying modes
from spatially distributed records.
Overall, the paucity of records spanning beyond 22 ka presents an opportunity for future studies
to target speleothems covering previous time periods, especially given their often more reliable U-Th
chronologies at these time scales compared to ice cores and marine sediment records [10,166,167].
Climate variability over the last glacial and beyond remains poorly constrained, and speleothems
could provide detailed information from vast range of different environments (coastal, continental,
high altitude/latitude, etc.).
Records that contribute to improving our assessment of the spatial robustness of δ
18O
spelin
Western Europe need to be calibrated against modern conditions, taking advantage of the GNIP
network and climate model simulations. This is particularly important for the goals outlined by
SISAL, as δ
18O is by far the most reported speleothem geochemical proxy, and the only one that has
a direct parameter equivalent in climate model simulations with isotopic tracers. Instrumental and
modelling data have recently allowed to define regions within Western Europe that are particularly
suited for reconstructions of certain (hydro-)climatic conditions, especially with respect to
spatio-temporal non-stationarities of the NAO [25,27,28]. In particular, variable sensitivities to the NAO
have been implied for Central Europe, the Iberian Peninsula, the Baltic Sea, the British Isles, and the
circum-Mediterranean region [28]. Record coverage in these areas is still patchy (Figure 1), and
should be targeted by future efforts, ideally including long-term cave microclimate monitoring,
assessment of local hydroclimate variability (through the isotopic analysis of precipitation samples
from the cave site), and careful sampling practices.
Com
peting influences on δ
18O
speland low signal-to-noise ratios at mid-latitude sites still prevent
a quantitative interpretation of δ
18O. As recently demonstrated by Deininger et al. [29], who used
Monte Carlo based Principal Component Analysis on several δ
18O
spelrecords in the same region,
sophisticated statistics methods can extract a common mode of climate variability from these
datasets. Our approach of stacking different records is also useful to determine robust regional trends
in a quantitative manner, but needs to be refined by future studies. Such statistical approaches hold
great promise in the context of a large database like SISAL, and could be used to better constrain
spatial trends in precipitation δ
18O over time, and improve our understanding of local and regional
influences on δ
18O
spel.
This first assessment of the Western European data compiled in the SISAL_v1 database
highlights interesting spatial and temporal trends in stalagmite δ
18O, but these will need to be
validated and better constrained by future work on the database. Specifically, we encourage:
•
Inclusion of missing records. This is crucial for the assessment of temporal and spatial coverage
of speleothem records in Western Europe, and helps defining future target regions and time
periods for new studies. This could be a starting point for revisiting sites and speleothems that
have shown great sensitivity for climate reconstruction, but where resolution and/or
chronological precision could be improved. It could also be of interest for a better definition of
short-lived events such as the 8.2 ka event or the 4.2 ka event, and to improve chronological
controls of speleothems previously dated with TIMS.
•
Addition and use of other types of data. For example, fluid inclusion δ
18O measurements on
speleothems would provide important direct information on past precipitat
ion δ
18O. Similarly,
speleothem δ
13C data, already included in the database, should be evaluated, as many sites
highlight its importance as (qualitative) proxy for soil activity and hydroclimate [40,46,71].
•
Inclusion of more information about cave monitoring. The SISAL_v1 database only includes a
yes/no/unknown entry for cave monitoring, which is often not sufficient when evaluating the
extent of knowledge of modern cave conditions.
7. Conclusions
By assessing the speleothem data collected in the SISAL_v1 database for Western Europe, we
describe regional trends in δ
18O, and evaluate their potential for palaeoclimate studies. Western
Europe has the largest number of published speleothem palaeoclimate records worldwide, many of
which (> 60% of the identified records) are currently included in SISAL_v1. Moreover, climate
conditions are well understood, due to the availability of a dense network of GNIP stations, some of
the longest meteorological records worldwide, and global modelling and reanalysis datasets. This is
a great advantage for the interpretation of δ
18O
spelrecords, which at mid-latitude sites is often difficult
because of competing effects from precipitation and cave processes. We find that present-day spatial
trends in δ
18O
spelfrom Weste
rn European caves generally mirror the trends in precipitation δ
18O. Over
the late Quaternary, site-
specific noise in δ
18O
spelpresents the main issue for the extraction of a
regional climate signal, especially over the Holocene. Encouraging results can be obtained through
the use of statistical methods, which allow the extraction of regional climate modes.
The SISAL database provides an excellent tool for the intercomparison of δ
18O
spelrecords over
the Western European region. We believe this will provide an important resource of palaeoclimatic
input for modelling studies and improve our understanding of the speleothem archive at
mid-latitude regions.
Author Contributions: All authors contributed in the collection of data and liaison with authors of the original studies included here. F.A.L. coordinated the study, wrote the manuscript, and drafted figures 6, 7, 8. S.A.M. drafted figure 2. A.C. drafted section 3.2. and figure 3. L.C.-B. drafted figures 4 and 5. I.L. drafted section 3.3. C.P.-M. drafted sections 3.4 and 3.5. K.R. did the statistical analysis of records shown in figure 8. All authors contributed to the project, discussed manuscript ideas and edited earlier manuscript versions, and approved the final manuscript.
Funding: FAL acknowledges funding by the Swiss National Science Foundation (SNSF) grant P2EZP2_172213. SAM and LCB acknowledge funding from the Geological Survey Ireland (Short Call 2017; grant number 2017-SC-056). CP acknowledges funding by the Government of Aragón predoctoral research grant B158/13 and CGL2016-77479-R (SPYRIT) project. KR acknowledges financial support by the German Research Foundation (DFG) grant RE3994-1/1.
![Figure 1. Map showing distribution of carbonate and evaporite rocks in Western Europe, provided by the World Karst Aquifer Mapping project (WOKAM, [36])](https://thumb-us.123doks.com/thumbv2/123dok_us/7924409.1315779/3.595.95.433.330.705/figure-distribution-carbonate-evaporite-western-provided-aquifer-mapping.webp)

![Figure 4. SISAL δ18O vs. mean annual weighted precipitation δ18O for the time period 1958-2015 from waterisotopes.org [151]](https://thumb-us.123doks.com/thumbv2/123dok_us/7924409.1315779/17.595.100.395.80.407/figure-sisal-mean-annual-weighted-precipitation-period-waterisotopes.webp)
![Figure 5. Comparison between mean annual weighted δ18O data from waterisotopes.org (background map; [123]) and SISAL records (filled circles; n=18)](https://thumb-us.123doks.com/thumbv2/123dok_us/7924409.1315779/18.595.103.403.76.381/figure-comparison-weighted-waterisotopes-background-sisal-records-circles.webp)


![Figure 8: Stacked record of SISAL entities covering the last 2000 years, compared to Global Volcanic Forcing (GVF; [160]), solar forcing (total solar insolation anomalies, dTSI; [161]), and CO2 concentrations from Antarctica’s Law Dome record [162]](https://thumb-us.123doks.com/thumbv2/123dok_us/7924409.1315779/21.595.83.502.318.588/stacked-entities-covering-volcanic-insolation-anomalies-concentrations-antarctica.webp)
