Ages of Big Sagebrush Following
Brush Control
JAMES W. BARTOLOME and HAROLD F. HEADY
Highlight: Six stands of big sagebrush, which had been plowed or sprayed earlier to remove brush and enhance understory vegetation, were sampled in southeastern Oregon to determine age structure of the shrubs and to evaluate rates of reinvasion. Five of the six stands contained big sagebrush older than the treatment. In three project areas plants established the first year following treatment formed the largest age class, 12 to 24% of the stand, indicating that reinvasion begins immediately after treatment. Most reestablishment occurred in the first several years after treatment for all locations. Establishment occurred either from seeds present in the soil at the time of treatment or from seeds produced as the plants became established and seed bearing. Treated sagebrush/grass ranges should remain highly productive under proper grazing use despite reinvasion of big sagebrush.
This report describes the age structure of big sagebrush (Artemisiu tridentatu) in areas of brush control and seeding of crested wheatgrass (Agropyron cristutum and A. desertorum). Age structure of stands has application to the status of vegeta-
tion modification, with particular relevance to the projected lifespan of the treatment, effectiveness of the treatment, and plans for future management.
The location of this study, the Vale District of the Bureau of Land Management (BLM) in southeastern Oregon, was the subject of a large scale rangeland rehabilitation program ex- tensively evaluated elsewhere (Heady and Bartolome 1977). The BLM spent about 10 million dollars on the Vale District to reduce stands of big sagebrush, either to permit seeding of exotic forage species or to enhance the growth of native understory plants, mainly bluebunch wheatgrass (Agropyron spicutum). The primary goals were to halt soil erosion and to stabilize the local livestock industry through increased grazing capacity.
Eighty-eight percent of the Vale District is dominated by big sagebrush, and vegetation of the remainder has a strong shrub component. This vast area of sagebrush/grass is characterized by complex, intergrading mixtures of several dominant shrub and grass species depending upon prior treatment and varying microsite. Excellent condition range may contain up to 25%
sagebrush and 75% grass cover. The mix of bunchgrasses and sagebrush at the start of the Vale Program had been changed toward high brush density, often greater than 50% cover, and few palatable bunchgrasses as a result of a century of exploitive grazing. In some locations a perennial grass understory was almost absent, with annuals or bare soil between the shrubs.
The authors are lecturer and associate specialist and professor, respectively, Depart- ment of Forestry and Resource Management, University of California, Berkeley 94720. The assistance of the Bureau of Land Management, Oregon State and Vale District Offices. and the U.S. Forest Service, Pacific Northwest Forest and Range Experiment Station, is gratefully acknowledged.
Ron M’akimoto, Lin Yeilding, and Jesse Theuri contributed to the study. Manuscript received September 3, 1977.
JOURNAL OF RANGE MANAGEMENT 31(6), November 1978
Literature
Understanding of the effects of range improvement primarily depends upon quantification of the ecological processes in- volved in productivity. Much published work has reported on aspects of vegetation change, ecosystem processes, and man- agement of sagebrush-grass range. Papers cited emphasize big sagebrush changes following control.
Sagebrush eventually reinvades where it has been controlled in most instances. The rate of invasion is related to initial success of shrub control (Weldon et al. 1958), initial condition of the range (Hedrick et al. 1966), and success of seeding (Robertson et al. 1966; Frischknecht and Bleak 1957). Yet reestablishment is often highly localized (Hironaka and Tisdale
1963) and concentrated in certain, perhaps wet, years (Frisch- knecht and Harris 1968). Heavy grazing speeds the rate of reinvasion (Johnson 1969); yet big sagebrush reinvades in some years even without grazing (Frischknecht and Harris 1968). Different subspecies of Artemesiu tridentutu may behave differently. The unpalatable subspecies A. tridentutu tridentutu may be the most aggressive (McDonough and Harniss 1975). Differences between subspecies Artemesiu tridentutu vuseyunu and A: tridentutu tridentutu may have led to several conflicting results in rate of reinvasion. Additional confusion on reinvasion rates stems from the apparent lack of correlation between size and age in immature Artemesiu tridentutu tridentutu (Beetle 1960; Daubenmire 1975). Some authors used size classes as estimates for age of plants. The long delay before reinvasion reported by Harniss and Murray (1973) could also lead to inaccurate conclusions concerning reinvasion of brush.
Economists have generally regarded chemical control of sagebrush as having a finite life span, usually less than 20 years (e.g., Kearl and Branham 1967). They project a finite life span based on the comparison of adjacent treated and untreated areas, where the difference disappears in between 10 to 20 years. This comparison would be clouded by additional improvement of both treated and untreated ranges. Kearl ( 1965) found that more than 50% of respondents to a survey of individuals using herbicides to control big sagebrush between 1952 and 1964 did not plan ever to respray. Seedings following mechanical control are also generally regarded as finite in life span, usually 20 years (e.g., Caton and Beringer 1960), perhaps with even less justification than for brush control alone. One would hope that proper management of rehabilitated big sagebrush-grass would not result in deteriorated stands after 20 years.
The economics of large scale brush control and seeding operations have yet to be adequately developed. On the Vale District the initial efforts by Stevens and Godfrey (1976) and Nielson, et al. (1966) have not adequately addressed problems associated with the quantification of interactive effects of a wide spectrum of range-improvement practices. Benefits are not
confined to treated areas alone. Adjacent untreated range improved at least as spectacularly as the treated range on the Vale District (Heady and Bartolome 1977), a result which must be included as a benefit. Economic evaluation therefore needs to consider the district or ranch as a whole.
Methods
Methods of vegetation sampling used in this study provide infor- mation on the life expectance of range improvement treatments instigated by the Vale Program.
In June 1976, 50 sagebrush plants were collected in each of six project areas to determine age through ring counts, density on the ground, and size of plants. All big sagebrush plants within a randomly located 1 m wide belt were measured for crown diameter and height and cut at ground level for ring counts to estimate age. The sampling ended when 50 plants had been collected. Density then was deter- mined from the length of the transect. Ferguson (1964) discusses ring-dating in detail for big sagebrush. Although rotten centers and mcomplete rings reduced the accuracy of age determination, the number of annual rings in any stem younger than approximately 20 years gave a reasonably clear estimate of the age of the plant. Estimates of actual age were not possible with 29 brush plants, or about 10% of the samples, due to missing centers.
Six project areas within the Vale District constituted the study areas. Five were plowed prior to seeding (Table l), while one was sprayed with 2,4-D to kill brush. All areas are currently grazed by cattle. The oldest treatment is 24 years old, the most recent 9 years. No obvious differences relating only to age of treatment were noted.
Results and Discussion
An apparent total initial control of brush resulted in the Ten-Mile seeding project because it was the only project area which did not contain sagebrush plants older than the treatment (Fig. 1). The most abundant age class represented those plants which established in the first year following treatment. How- ever, sagebrush plants continued to establish during later years following treatment. No plants younger than 4 years old were found. An interesting aspect of the age structure of the big sagebrush population in this project area is an apparent second period of establishment five years following the initial period of establishment. This second peak could be due to seedlings established as the first group of plants became old enough to produce seed or an exceedingly favorable year for establish- ment. The structure of the stand suggests an effective control, completely eliminating the brush, but a rapid and continued reinvasion in the years following treatment.
The four other plowed and seeded areas (Antelope, Brickey Springs, Big Ridge, and Rock Creek) displayed similar patterns of population structure (Fig. 1). A few plants apparently survived the initial plowing. Reestablishment of the brush then proceeded rapidly in the years following treatment. The first year following treatment was the largest age class in the Big Ridge and Antelope project areas. Establishments of sagebrush rapidly declined in successive years following treatment. Estab- lishment was more continuous with a later peak in the Rock Creek and Brickey Springs projects.
Brush control was very poor in the Basque spray and seed project. Many of the shrubs were more than 25 years old (Fig. 1). However, the pattern of reinvasion following treatment is similar to the more effective plow treatments. Density of sagebrush in the Basque spray was less than for the more :ffectively controlled area of Rock Creek, where few of the shrubs survived treatment (Table 1). Reinvasion of sagebrush is apparently not significantly related to the degree of brush kill for these areas.
A common assertion is that big sagebrush invades rapidly following land treatment and that most seedlings become established at that time. In part, the results of the age-class survey substantiate that claim. On three of the treated areas the most numerous age class occurred the year following treatment. However, all treated areas showed evidence of continued establishment for several years following treatment, except that the Antelope and Brickey Springs seedings had no plants younger than 6 years (Fig. 1).
Only the Ten-Mile seedings displayed complete control of bi L sagebrush by the initial treatment; in all other projects sampled, ample big sagebrush plants remained after treatment to allow reinvasion from seed produced. Invasion was by establishment of seedlings immediately after treatment from seed on the site and from seed produced later. No evidence was found that particular years were more favorable for sagebrush establishment than others. Individual areas showed groups or cohorts of seedlings but they were of different ages. From 1970 onward few big sagebrush plants became established.
Size and age of plant were poorly correlated. Although correlation coefficients for age (number of annual rings) and size (height times square of diameter) of plant were statistically significant for five of the six areas, coefficients were low and of little use for predicting age (Table 1). The Big Ridge seeding showed a correlation of 0.130 or no relation at all between size and age. Interestingly, the Big Ridge seeding consisted pri- marily of the subspecies Artemesia tridentata tridentata Nutt.
Table 1. Age in years and density of big sagebrush on six treated areas in 1976.
Projecl name Ten-Mile Seeding Brickey Springs
Seeding Rock Creek Seeding Big Ridge Seeding Antelope Seeding Basque Brush Control
Brush control method
plow plow plow plow plow spray
Primary big sagebrush subspecies’
Age (years) Density of’
Age of of big sagebrush big sage-
treatment ___ brush
(years) Mean Median Minimum Maximum (plants/m2)
wyomingensis 24 17.7 19 5 24 0.29
wyomingensis wyomingensis tridentata wyomingensis wyomingensis
15 12.6 13 6 21 0.20
15 12.2 12 5 26+ 0.53
10 9.3 10 1 18 0.20
10 11.2 10 7 23 0.27
9 15.4 11 3 38+ 0.45
Correlation between size
and age “ 9, r 2 0.348*-- 0.448** 0.427** 0.130 0.457** 0.486**
’ ~c,~o/,~i,~~e,rsis indicates primary big sagebrush subspecies present was Artemesia tridentata subsp. wyomingensis Beetle. tridentata indicates primary subspecies present was Arternesiu t~&~/~rtrr \ubsp. triderztuta Nutt.
! ,mcl denote significant correlation between size and age at the .05 and .Ol levels, respectively.
24 I
z 12.
k b Ten Mile Seeding p IO.
2 8.
6. 4.
2 ’ 0 I . . . JJ_ihJ
1976 74 72 70 68 66 64 62 60 58 56 54 52 year of establishment
Rock Creek Seeding
c plowed and seeded
4. 2 ’ 1976 74 72 70 68 66 64 62 60 58 56 54 52 0 -.-...!..J
1976 74 72 70 68 66 64 62 60 58 56 54 52 24
22 t 20 -
18. I6 -
Plowed and seeded
!..I.! . .._... 1976 74 72 70 68 66 64 62 60 58 56 54 52
year of establishment Big Ridge
Seeding
Antelope Seeding
/ plowed and seeded
year of establishment
year of estoblishment
6
I6 I6 -
c *
g 148 Brickey Springs Seeding 2 6 14, ’
‘1L . z . Basque Spray
z 12. : 12.
j IO. k
1
g 10. I
b 8. plowed and seeded = 8. sprayed and seeded
6. 6.
4. 4.
2 * 2 1
o-- - -. . !I --. -. * -
=
0 ---.-.. J. A!..!!
1976 74 72 70 68 66 64 62 60 58 56 1976 74 72 70 68 66 64 62 60 58 56 54 52
year of establishment year of establishment
Fig. 1. Apparent year of establishment of big sagebrush plants within six treated areas as determined through ring counts. Bars represent the number of plants established in each year out of 50 sampled.
while the others were primarily A. tridentata wyomingensis Beetle, as classified using the criteria of Winward and Tisdale (1977). The practice of making inferences about age class distribution of sagebrush stands based on size classes is highly inaccurate and in fact may lead to erroneous conclusions. Apparent seedlings less than 1 dm (5 in) tall may be more than
10 years old.
Benefits of treatment during the Vale Program should last
indefinitely under the present proper management. This premise is based on several facts and assumptions. Stands of grass appear to have deteriorated in the first few years following treatment, but most of the apparent reinvasion of big sagebrush is actually the recovery of unkilled plants and the growth of seedlings established in the first few years following treatment. Seedlings established later than the first year following treat- ment generally remained small, and many did not reach
maturity. Old brush control projects did not show more sage- brush reinvasion than recent projects, and on several sites continued reinvasion of big sagebrush appeared to be com- pletely halted after the early reestablishment following treatment and before the thickening of the grass stand. Areas with nearly complete big sagebrush kills showed invasion with densities not ultimately different from less effectively con- trolled areas.
An often misconstrued aspect of vegetation change in sagebrush/grass range is that since depleted sagebrush/grass ranges contain mostly sagebrush, perhaps with a large quantity of cheatgrass (Bromus tectorum), sagebrush reinvasion will bring deterioration of the perennial grass cover. We reject this negative correlation between sagebrush density and grass pro- ductivity on well-managed ranges. Sagebrush/grass ranges may contain a high proportion of big sagebrush before grass pro- duction will be significantly decreased. The key to proper management is maintenance of a balance between vigorous stands of perennial grasses and big sagebrush. Judiciously used brush control practices, seeding, and proper grazing can main- tain this balance.
Literature Cited
Beetle, A.A. 1960. A study of sagebrush. Wyoming Agr. Exp. Sta. Bull. 368. 83~.
Caton, D.D., and C. Beringer. 1960. Cost and benefits of reseeding rangelands in southern Idaho. Idaho Agr. Exp. Sta. Bull. 326. 31~.
Caton, D.D., and C. Beringer. 1975. Ecology of Artemesia tridentutu subsp. tridenturu in the State of Washington. Northwest Sci. 49:24-35.
Ferguson, C.W. 1964. Annual rings in big sagebrush, Arremesiu rridenrutu. Univ. Arizona Press Papers of Lab. of Tree-ring Res. No. 1. 95~.
Frischknecht, N.C., and A.T. Bleak. 1957. Encroachment of big sagebrush on seeded range in northeastern Nevada. J. Range Manage. 10:165-170.
Frischknecht, N.C., and L.E. Harris. 1968. Grazing intensities and systems on crested wheatgrass in central Utah: response of vegetation and cattle. U.S. Dep. Agr. Tech. Bull. 1388. 47~.
Harniss, R.O., and R.B. Murray. 1973. Thirty years of vegetal change following burning of sagebrush-grass range. J. Range Manage. 26:322-325.
Heady, H.F., and J.W. Bartolome. 1977. The vale rangeland rehabilitation program: the desert repaired in southeastern Oregon. U.S. Forest Serv. Resour. Bull. PNW-70. 138~.
Hedrick, D.W., D.H. Hyder, F.A. Sneva, and C.E. Poulton. 1966.
Ecological response of sagebrush-grass in central Oregon to mechanical and chemical removal of Artemesiu. Ecology 47:432-439.
Hironaka, M., and E.W. T&dale. 1963. Secondary succession in annual vegetation in southern Idaho. Ecology 44:810-812.
Johnson, W.M. 1969. Life expectancy of a sagebrush control in central Wyoming. J. Range Manage. 22:177-182.
Kearl, W.G. 1965. A survey of big sagebrush control in Wyoming, 1952-1964. Wyoming Agr. Exp. Sta. Mimeo. Circ. 217. 42~.
Kearl, W.G., and M. Brannan. 1967. Economics of mechanical control of sagebrush in Wyoming. Wyoming Agr. Exp. Sta. Sci. Monogr. 5. 35~.
McDonough, W.T., and R.O. Harniss. 1975. Know your sagebrush-and better your range. Utah Sci. Sept., 1975. 99-103.
Nielson, D.B., W.G. Brown, D.H. Gates, and T.R. Bunch. 1966. Econo- mics of federal range use and improvement for livestock production. Oregon Agr. Exp. Sta. Bull. 92. 40p.
Robertson, J.H., R.E. Eckert, and A.T. Bleak. 1966. Responses of grasses seeded in an Artemesia tridentutu habitat in Nevada. Ecology 47: 187-194.
Stevens, J.B., and E.B. Godfrey. 1976. Use rates, resource flows and efficiency of public investment in range improvements. Amer. J. Agr. Econ. Nov, 1972. 61 l-621.
Weldon, L.W., D.W. Bohmont, and H.P. Alley. 1958. Reestablishment of sagebrush following chemical control. Weeds 6:298-303.
Winward, A.H., and E.W. Tisdale. 1977. Taxonomy of the Artemesiu tridenrutu complex in Idaho. Univ. Idaho, College of Forestry, Wildl., and Range Sci. Bull. No. 19. 15~.
Patterns of Natural
Revegetation In
Arid Southeastern
Utah
RICHARD A. JAYNES AND K.T. HARPER
Highlight: Current and pending legislation will require that lands disturbed by mining activities be revegetated. Since few adapted species are now available for reclamation of such lands in the arid zone, this study was initiated to identify native species that are successful colonizers of disturbed sites. The native vegetation of bladed roadways in the Kane County, Utah, was sampled to identify natural colonizer species. Sixteen successful colonizers have been identified and studied to determine (1) their relative colonizing efficiency, and (2) their individual responses to elevational, soil textural, and other environmental gradients. The species fall into two natural groups: one group is well adapted to lower benchlands with sandy clay loam soils and the other is adapted to upper benchlands with sandy loam soils. Some of the species that appear to be most successful in initially revegetating disturbed areas include: (1) upper benchlands-Indian ricegrass, galleta grass, sand aster, pepperweed, broom snakeweed, small- leaf scarlet globemallow, and blue locoweed; (2) lower bench- lands-shadscale, desert molly, cut-leaf globemallow, and pink locoweed.
Large deposits of low sulfur coal and oil shale occur in the arid zones of the Colorado Plateau. National needs will almost certainly require the use of all energy resources that can be mined economically. Resultant energy development operations will disrupt the natural vegetation over extensive areas of arid land. Since current and pending legislation requires that plant cover be reestablished on such lands, there is an urgent need for workable revegetation techniques for arid environments. With- out some kind of stabilization treatment, mine spoils, roadsides, drill pads, and construction sites associated with energy developments will contribute significant amounts of particulate matter to the air and sediments and dissolved chemicals to surface waters in the region. The cheapest and most nearly permanent method of stabilization is likely to be revegetation
Nith well-adapted plants. Reclamation with appropriate plant species could serve not only to restore but also to improve range productivity for wild and domestic animal life.
Although much successful revegetation work has been ac- complished in portions of the West that receive over 30 cm of precipitation annually (Plummer et al. 1968), plant scientists have had little success in establishing permanent ground cover on disturbed sites where annual precipitation falls below 25 cm (Bleak et al. 1965). The current inability to establish quickly plant covers in arid zones is related to a lack of information on
Authors are research assistant and professor, Department of Botany and Range Science, Brigham Young University, Provo, Utah 84602.
Drs. J.R. Murdock, S.L. Welsh, and B.W. Woods rendered invaluable technical and logistics support without which this project would have been impossible. Hollv Nicholes. Steven Spender, and Margaret Trimtile assisted in all aspects of ihe study. Thebroject was supported by NSF Grant EPP75-04397.
JOURNAL OF RANGE MANAGEMENT 31(6), November 1978
adapted species and to the unpredictability of natural precipita- tion.
This study was designed to sift the native flora of the benchlands of the Kaiparowits Basin, a potentially important coal field, for native species capable of naturally recolonizing disturbed sites. We also provide some information concerning ecological situations where such species might best be used.
Description of Study Area
Vegetation and associated soils were sampled on upper and lower benchlands northeast of Glen Canyon City, Utah. Soils of the upper benchland sites (ca. 1,550 m) are predominantly sandy loams derived from the Straight Cliffs sandstone formation with some localized Mancos shale influence. Soils on lower benchland sites (ca. 1,330 m) range from clay soils from tropic shale to sandy clay loams derived from Straight Cliffs or Dakota sandstone.
The study area is characterized by elements of both cold and warm desert vegetation adapted to less than 25 cm of mean annual precipita- tion. Moisture is received as winter snow, spring rain, and localized summer thunderstorms. The monthly precipitation averages form a bimodal pattern as a result of winter storms from the west and the intrusion of summer air masses from the Gulf of Mexico. Years of below-average precipitation are more frequent than above-average years. Wet winters are not always followed by wet summers, nor are dry winters necessarily followed by dry summers. Native plant species have adapted to these extreme moisture fluctuations in various ways. Annuals are abundant in the study area and flourish in wet years, but exist as seeds during drought years.
The vegetaion of the Kaiparowits Basin provides winter forage for livestock, and both habitat and forage for black tailed jackrabbits, various smaller rodents, and a variety of birds. Though sparse, the plant cover also enhances soil stability.
Methods
A total of 2 1 study sites was selected along roadways in shadscale- grass, blackbrush, sagebrush, and grassland-shrub communities. Roads were selected that had been graded in such a way as to remove the top 2-3 dm of soil and place it in a windrow at road edge (Fig. 1). The time since disturbance was at least 3 years, and none of the roads had received artificial surfacing materials such as petroleum stabilizers or gravel. On older roads, it proved impossible to determine accurately the length of time since disturbance, but it was obvious that each site sampled supported pioneer vegetation in the roadway and along the windrow of mixed surface soil. Three stands were selected at each site at the following locations: (1) road center where subsoil had been exposed and plants could exist without being crushed by vehicular traffic, (2) adjacent roadside berm (consisting of a mixture of subsoil and topsoil), and (3) a strip of undisturbed vegetation 10 m away from and parallel to the road. The three stands at each site will hereafter be referred to as subsoil, mixed soil, and undisturbed. Each stand consisted of a transect 120 m in length and centered on the area of
Fig. 1. Roadways had all been made by a grader or bulldozer passing over the site to clear off brush and smooth off suqace irregularities. Plant debris and SUrfaCe soils were windrowed into a berm at roadedge. There had been no attempt to form gutters or elevate roadbeds. Plant life persisted in the center of all roads sampled.
interest (e.g., the berm). Twenty-five quadrats (0.25 x 1.0 m) were distributed along the transect at 5-meter intervals. Transects were selected for maximal topographic and edaphic homogeneity. The undisturbed stand adjacent to the roadway was viewed as being the principal seed source for colonizing species.
Vegetational data were collected in early June 1975. A checklist of all plant species occuring along each transect was made. At each quadrat, density of all perennial species rooted therein was noted and living, dead, and rock (I 1 cm*) cover was estimated by cover classes (Daubenmire 1968). The plant nomenclature follows Welsh and Moore (1973). A list of the most prolific colonizer species was made by selecting the species most frequently encountered on disturbed areas. The relative abundance of species was also used to help arrange the list of important colonizers.
At each study area, a composite soil sample was drawn from the surface 1.5 dm. It consisted of equal quantities of soil from each transect. Soils were analyzed for texture using the hydrometer method (Foth et al. 1971).
The average frequency of each selected species was calculated for all disturbed (i.e., subsoil or mixed soil) and all undisturbed transects. Transects within each soil class were then arranged in order of decreasing frequency of the species in question. Average elevation and
average % sand for transects of the top % of the frequency gradient of each species were then computed and graphed.
Colonizing success of each species relative to its seed source was determined by dividing the density of each species on a disturbed area by the density of the same species in the adjacent undisturbed area and multiplying the quotient by 100. Values exceeding 100 indicate that a
species is present on disturbed areas in greater abundance than in adjacent seed source areas. Thus, this index serves as an indicator of colonization efficiency.
Results and Discussion
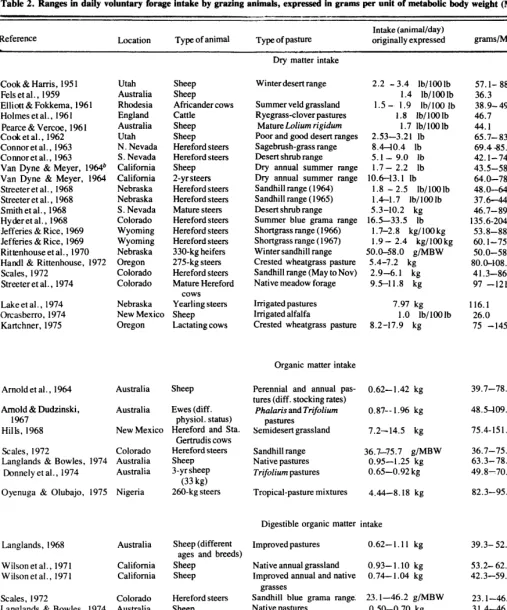
Information concerning general characteristics of the dif- ferent vegetative types is given in Table 1. A total of 54 perennial species was observed on the 2 1 study areas. Sixteen of the most abundant colonizer species were selected for further study. The list includes 6 shrubs, 7 perennial forbs, and 3 grasses. The scientific and common names of those species and the general areas of their occurrence in the region are reported in Table 2. The usual means by which each species propagates itself on the disturbed sites is also noted.
Comparative response of the 16 colonizer species along elevational and soil textural gradients is shown in Figure 2. The sandy loam soils of higher elevations are most readily colon- ized by Indian ricegrass, galleta grass, Fendler’s three-awn, broom snakeweed, big sagebrush, Mormon tea, sand aster, Hymenopappus, pepperweed, blue locoweed, and small-leaf scarlet globemallow. The clay loam soils of lower elevations are mainly colonized by shadscale, desert molly, budsage, pink locoweed, and cut-leaf scarlet globemallow. The rank-order of species along the elevational and soil textured gradients is highly correlated at the .Ol level (Snedecor and Cochran 1967), indicating that species that prefer low elevations also do best on finer textured soils in our study area.
The arithmetical means reported in Figure 1 may be some- what misleading, since variance around the mean is not considered. The coefficient of variation (C.V. = standard deviationlarithmelic mean X 100 was examined for each species. Coefficient of variation values for four species (blue locoweed, cut-leaf globemallow, galleta grass, and Indian ricegrass) are somewhat larger (C.V. = 5-l 1 for elevation and C.V. = 35-39 for soil sand), than for the other species (C.V. = l-4 for elevation and C. V. = 9-23 for soil sand. Such results
Table 1. General environmental and vegetational characteristics associated with five vegetation units recognized in this study. Vegetational data are from the undisturbed transects at each study site.
Vegetation type Shadscale-grass
Grassland-shrub
Spiny hopsage
Average elevation
(ml 1,310
1,520
1,586
Soil parent material Alluvium from Straight Cliffs sandstone and Tropic shale Straight Cliffs sandstone residuum with some localized Mancos shale Straight Cliffs sandstone
Soil textural Number of class study areas Sandy clay 6 loam
Sandy loam 5
Sandy loam 4
Benchland designation Lower
Upper
Upper
Average living Plant cover + SD
18 +5
26*2
34 + 6
Blackbrush 1,582
Sagebrush 1,650
Straight Cliffs sandstone Straight Cliffs sandstone
Sandy loam 4
Sandy loam 2
Upper
Upper
2026
27 + 2
SUBSOIL
NIXED
SOIL
Arle Artr *Pa
EPvi Lam0
sar
4
usa bf ’Orhy Ash3
3 II-
(R
* 65. -spco
Arrp 60.
- Koam Atco
ss- _ Asam
so* I f
0 20 40
AVERAGE % FREQUENCY
Fig. 2. Environmental conditions associated with maximal development for important colonizer species along roadedges in the Kaiparowits Basin. Only stands from the top third of the density gradient for each species were considered in constructing this figure. Length of the horizontal line for each species indicates the average frequency of that species in quadrats placed in subsoil and mixed soil stands at the sites considered. Species abbreviations are shown in Table 2.
suggest that these four species are less restricted than the others in respect to edaphic and elevational requirements. Snakeweed occurs over a broad range of elevations; but it grows preferen- tially on sandy loams. Shadscale tolerates a rather broad range of soil texture, but it a vigorous colonizer only at lower elevations.
It should be noted that colonizing species of lower benchlands include few species that are capable of sprouting from roots under natural conditions (Table 2). Upper benchland areas appear to be more favorable for vegetative propagation, since several species there (especially forbs) reproduce vegetatively following disturbance.
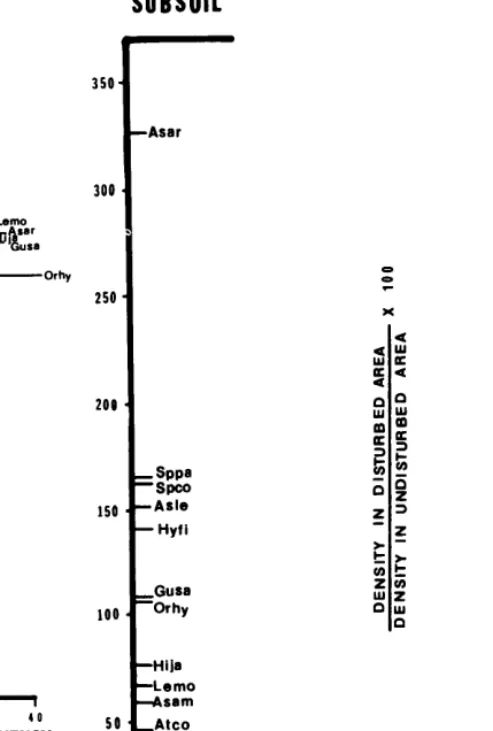
The performance of the various species on disturbed and undisturbed areas can be used to compute a useful measure of the relative ability of each to colonize newly opened sites from a parental population of standardized size. The species are ranked according to colonization success on subsoil and mixed soil sites in Fig. 3. Broom snakeweed, Indian ricegrass, both scarlet globemallows, and both locoweed species appear to be among the more efficient colonizers of disturbed areas (i.e., they were found in greater abundance on the disturbed sites than in the adjacent source area.) Sand aster and Hymenopupus also do well on both kinds of disturbed sites. Part of the success of the latter two species may be due to their ability to reproduce vegetatively from plant parts buried so deeply that they escape destruction in
JOURNAL OF RANGE MANAGEMENT 31(6), November 1978
350
300
250
209
150
100
54
0
-Asar
= $.g -Ask - Hyfi
Gusa =Orhy
-Hib -Lemo -Assm
Fig. 3. Relative success of the species as colonizers. Species unable to persist in disturbed sites would have a value of zero; a value of 100 indicates that the species is as abundant in the disturbed as in the undisturbed area. The horizontal scale has no meaning. Abbreviations are as in Table 2. The vertical axis is identical for subsoil and mixed soil.
the process of road construction. Again, it is apparent that the upper benchlands represent a more favorable environment for plant growth, since most of the highly efficient colonizers are found there.
Most of the species considered perform better on the mixed soil berm than the scraped roadbed (Fig. 2), but three species teach maximum density in the road itself (sand aster, small-leaf globemallow, and galleta grass). Performance of those species appears to be hampered by competition from associated species on less disturbed sites.
Stepwise multiple variable regression analyses of environ- mental factors controlling the performance of species selected as good colonizers have been performed. These analyses are based on data for 72 undisturbed sites from a study by Jaynes (1976) which was conducted in the same area utilized for this study. Environmental variables considered in the analyses include soil texture, salinity, pH, and stoniness, water infiltra- tion rates, and microtopography (elevation, aspect and % slope). Frequency of species occurrence was used as the dependent variable. Results are reported in Table 3. Multi- variate equations are helpful in predicting species response to selected variables, but they had limited value as predictors of relative colonizer success on denuded sites in this study. The rather low R*-values would have been improved by increasing
Table 2. Important colonizing species on disturbed sites in the Kaiparowits Basin.
Scientific name Common name Symbol
Community of best development
Benchland of best development
Commonest means of propagation on disturbed sites
Shrubs
Artemisia spinescens Artemisia tridentata
Artiplex confertifolia Ephedra viridis
Budsage Big sagebrush
Shadscale Mormon tea Gutierrezia sarothrae Broom snakeweed Kochia americana Desert molly
Forbs
Astragalus amphioxys Astragalus lentiginosus
Pink locoweed Blue locoweed Aster arenosus
Hymenopappusfilifolius Lepidium montanum Sphaeralcea coccinia
Sphaeralceaparvifolia
Sand aster Hymenopappus Pepperweed Cut-leaf scarlet globemallow Small-leaf scarlet globemallow Grasses
Aristida fendleriana Hilaria jamesii
Fendler’s three-awn Galleta grass Otyzopsis hymenoides Indian ricegrass
Arsp Artr Atco Epvi Shadscale Sagebrush Shadscale Grassland-shrub and spiny hopsage Shadscale Shadscale Lower Upper Lower Upper seed seed seed seed, root?
Upper Lower
seed, root? seed, some rhizome Gusa Koam Lower Upper Asam Asle Shadscale Grassland-shrub and blackbrush Sagebrush Grassland-shrub Blackbrush Shadscale seed seed Upper Upper Upper Lower
seed, rhizome seed, root?
seed seed Asar Hyfi Lemo spco
Upper seed. root?
Srva Grassland-shrub
Arfe Hija
Grassland-shrub Grassland-shrub and spiny hopsage Grassland-shrub
and spiny hopsage
Upper Both
seed seed, rhizome
Orhy Both seed
the range of variation encountered in species success in the study had apparently not become established by seed but had stands studied (e.g., including disturbed sites where species are survived disturbance by sprouting from the crown or from colonizing). Nevertheless, the equations do provide useful rhizomes (e.g., both globemallow species, pepperweed, galleta information concerning the ecology of species which may have grass, and Mormon tea). Since the ability of plants to persist on value in revegetation programs (Wikum and Wali 1974). harsh sites is an important characteristic of good colonizing
Some of the species found growing on disturbed sites in this species, we have made no distinction between plants occurring
Table 3. Multivariate regression equations for colonizer species. The dependent variable in all cases was % frequency of each Species.
Shrubs
Artemisia spinescens Atriplex confertifolia Ephedra viridis Gutierrezia sarothrae Kochia americana
Number of study sites of occurrence
21 45 57 63 15
Regression equation*
y = the percent frequency of each species in 0.25 m2 quadrats
y= 11.1-.07E+.O1Sa+.61%S1-.39SD-.41R+3.18SP
y = 53.6- .07E- .79C + 10.90Ex + lO.l7pH- .27IR + .0009SA y=-45.2-.38R+.O4E-4.50SP+.24S+.18IR-3.77Ex
y = -151.5 + .5OS + .08E- .24IR + .47SD + .63R + 3.78SP y=44.8+ 1.73C-13.72EX-.05E+.22IR
R2 Significance
.42 n.s.
.35 .025
.46 .005
.48 .005
.81 .005
Forbs
Aster arenosus Astragalus amphioqs Astragalus lentiginosus Lepidium montanum Sphaeralcea coccinea Sphaeralceaparvifolia
47 y = -50.1-6.1Ex + 8.lpH - . IOIR + .0850
63 y=63.1-6.18pH-.0008Sa+.06SD+ 1.60Ex-.008E
29 y= 105.5-.04E-5.4pH-.003Sa
48 y= 158.8+ 11.73Ex-23.63pH+.05E-.O1Sa-.36S-.1lSD 45 y= 15.8-.06SD+ .002SA- l.l2Ex- 1.20pH-.41SP 33 y = 122.9- .53C- .38R- 12.41pH- .04Sa
.22 .05
.16 n.s.
.61 .005
.48 .005
.38 .005
.27 n.s.
Grasses
Aristida fendleriana Hilaria jamesii Oryzopsis hymenoides
30 y = 0.2 + .28SD- .007Sa-. 121R .44 .005
70 y = 264.5 - 2.32C + 9.52SP - .89S - 1.66%Sl- .08E- .66R .40 .005 70 y = 86.8 + 6.47SP- .97%Sl- .23C + .16SD- 9.41pH .19 .025 Varr~bles are arranged in the sequence of their entry into the stepwise regression.
Key to symbols used:
c = % Clay SP = slope position (top = I, middle = 2, bottom = 3) S = % sand SD = soil depth (cm)
%SI = slope EX = exposure (2.00 = Northeast, 0.00 = Southwest) E = elevation(m) Sa = soil salinity (ppiiQ
R = r/r soil rock pH = soil pH ( 1: I soil/water paste) IR = infiltration rate (cm/min)
JOURNAL OF RANGE MANAGEMENT 31(6), November 1976
on a disturbed site as a consequence of seedling establishment or resprouting. From our field observations, however, the majority of the species considered to be effective colonizers apparently had invaded by seed.
Some of the candidate species noted have undesirable forage properties (e.g., snakeweed and locoweed). Where vegetative cover is the main goal, unpalatability may become a secondary consideration. Along roadsides where grazing animals present traffic hazards, unpalatable plants may actually be desirable. Species such as sand dropseed (Sporobolus cryptandrus) and squirreltail (Sitanion hystrix) have been recommended for inclusion in seeding mixtures for sandy, arid sites (Plummer et al. 1955). Although these species were often present in undis- turbed communities adjacent to our disturbed plots, they were not good colonizers for our roadways.
The existing flora of the Kaiparowits Basin is a valuable source of adapted species for land reclamation projects on the Colorado Plateau, but not necessarily the only group of plants that should be considered. Some introduced perennial and annual species may also play important roles in future rec-
Literature Cited
Bleak, A.T., N.C. Frischknecht, A.P. Plummer, and R.E. Eckert, Jr. 1965. Problems in artificial and natural revegetation of the arid shadscale vegetation zone of Utah and Nevada. J. Range Manage. 1859-65.
Daubenmire, R.F. 1959. A canopy-coverage method of vegetational analysis. Northw. Sci. 33:43-64.
Foth, H.D., H.S. Jacobs, and L.V. Withee. 1971. Laboratory manual for introductory soil science, 3rd ed. Wm. C. Brown, Co. 104 p.
Jaynes, R.A. 1976. Effects of selected edaphic and topographic factors on plant communities of southwestern benchlands. Paper Presented at Society for Range Management Annual Meeting, February 1976. Omaha, Nebraska.
Plummer, A.P., D.R. Christensen, and S. B. Monson. 1968. Restoring big game range in Utah. Utah Fish and Game Pub. No. 68-3.
Plummer, A.P., A.C. Hull, Jr., G. Stewart, and J .H. Robertson. 1955.
Seeding rangelands in Utah, Nevada, southern Idaho, and western Wyoming. U.S. Dep. Agr. Hand. 71.
Snedecor, G.W., and Cochran, W.G. 1967. Statistical methods, 6thed. Iowa State Univ. Press, Ames.
Welsh, S.L., and G. Moore, 1973. Utah plants: Tracheophyta, 3rd ed. Brigham Young University Press. Provo, Utah.
Wikum, D.A., and M.K. Wali. 1974. Analysis of a North Dakota gallery forest: vegetation in relation to topographic and soil gradients. Ecol. Monogr. 44:44 l-464.
lamation projects.
Introduction to
Renewable Resource
Inventory Methods
Short course/ March 5-9,1979
Berkeley, California
Development of integrated sampling and
measurement systems using aerial photographs
and satellite and ground data.
Application deadline:
February 2,1979.
For information:
Write to Letters and Sciences,
Dept. S-9, UC Extension, 2223 Fulton St.,
Berkeley, CA 94720. Or cal I (415) 642-l 061.
Presented by:
University of California, Berkeley,
and the EROS Data Center, USGS
Effects of Cattle Grazing on Shore
Vegetation
Of Fluctuating Water Level Reservoirs
G-R. HOFFMAN AND L.D. STANLEY
Highlight: Shore vegetation around Lakes Oahe and Sakaka- wea, mainstem Missouri River reservoirs, is a mosaic of shifting plant populations that responds to a combination of limiting factors including water level fluctuations and cattle grazing. Shore vegetation is important as it provides some wildlife habitat and spawning habitat for certain fish species, reduces erosion, adds to the aesthetic value of the shore environment, and provides forage for cattle grazing. The present study was done in 1976 to document the effects of cattle grazing on shore vegetation at seven sites that were inundated for a prolonged period in 1975. Some of the dominant shore species were Horedeum jubatum, Agropyron smithii, A. repens, Chenopodium album, Iva xanthifoliu, Kochia scopariu , Melilotus ssp., Polygonum achoreum, P. lapathifolium, Rumex crispus,, and Xanthium strumarium. Solanum rostratum and Grindeliu squarrosa along with several other species were favored by grazing. Floristically, ungrazed plots were more similar than grazed plots when pairs of sites were compared. Total plant coverages inside exclosures at three sites on Pierre Shale- derived soils ranged from 54% to 97% and biomass values ranged from 458 g.m- * to 720 g.m- *, while outside exclosures at the same sites total plant coverages ranged from 11% to 82% and biomass values were 19 g.m-* to 259 g.m.-*. At one site, on loess- derived substrate, total plant coverages inside and outside the exclosure were 116% and 77% respectively, and biomass values were 606 g.m- * inside and 210 g.m- * outside the exclosure. All three sites on Lake Sakakawea are on glacial till-derived sub- strates, and plant coverages ranged from 128% to 155% inside exclosures where biomass values were 478 g.m- * to 1,766 g.m- *. Outside the exclosures the total plant coverages were 24% to 144% and biomass values were 15 g.m- * to 474 g.m- *.
Shore vegetation develops between periods of high water; thus annual fluctuations in water levels, along with cattle grazing as limiting factors, keep shore vegetation in an early seral stage. Minimizing both water level fluctuations and cattle grazing for a given reservoir during a given year, preferably a 2-year period, would permit considerably more shore vegetational development. This regimen, if rotated among the six reservoirs, would over a period of years, benefit development of shore vegetation.
Cattle grazing is a major enterprise in the western North and South Dakotas. Along the Missouri River reservoirs in these states, cattle have ready access to both shore vegetation and water. While it has been recognized for many years that cattle grazing can decrease significantly the shore vegetation of ponds, lakes, and reservoirs (Gill and Bradshaw 197 1; Kelting and Penfound 1950; Magadza 1970; Tiemeier 195 I), the effect of cattle grazing on shore vegetation of the Missouri River reservoirs has not been studied previously.
Lakes Oahe and Sakakawea, mainstem Missouri River reser-
Authors are professor of biology and research associate, Department of Biology, University of South Dakota, Vermillion 57069.
Thi\ study was supported by funds from the U.S. Army Corps of Engineers, Operations Di\ i\ion. Omaha District.
Manuscript received January 24, 1978.
voirs (Fig. l), have fluctuating water levels that peak during the summers and reach low during the winters. Water fluctuation patterns vary from year to year in each reservoir and are quite dissimilar between the two reservoirs. For the years 1969- 1975, the average water level fluctuations were 3.58 m (11.7 ft) and 3.45 m (11.3 ft) in Lakes Oahe and Sakakawea, respectively. Based on lake basin morphometry data of 1968 (U.S. Army Corps of Engineers 197 1, 1972) these water level fluctuations translate to shore areas of 20,658 ha (5 1,025 acres) and 19,422 ha (47,972 acres) for Lakes Oahe and Sakakawea, respectively. In 1975, when water reached record high levels in both reservoirs, 27,738 ha (68,s 13 acres) around Lake Oahe and 26,380 ha (65,159 acres) around Lake Sakakawea were inun- dated. Following high water, vegetation becomes established on the shores and survives until high water and/or cattle grazing
48’-
47O-
45O-
I lO4O
-
SCALE
Ir;b ; 3 MILES
SO 2!J ’ ” ‘&KILOMETERS
I 103O
DAM
BISMARCK
4
NORTH _ -__-_.
SOUTH DAKOTA -___.______.-._
DAKOTA
I
102O
of Lakes Oahe and Sakakawea, mainstem Fig. 1. Seven study sites on shores
Missouri River reservoirs.
-.
-iE 1
IOP QAM
eliminate it. Reduced vegetative cover exposes the shore to tapes used for coverage estimates. All plant material collected was enhanced erosion and reduces preferred spawning habitat for a placed in paper sacks and air-dried in the field. In the laboratory the number of important fish species in the reservoirs. material was dried further at 70°C for 48 hr, then weighed to the
On the federally controlled land immediately surrounding nearest O. 1 g-
Lake Sakakawea, a 6-month grazing period, May 1 to October Voucher specimens of plants collected during this study were 31, is permitted. On improved pastures the stocking rate &posited in the University of South Dakota Herbarium.
allowed-is one animal unit/I 5 acres, and on native grassland the rate is one animal unit/30 acres. Additionally, for maximum sustained production of the vegetation, one half the year’s plant growth must remain after the grazing season. The stated regulations for grazing around Lake Oahe are somewhat dif- ferent. Here the grazing period is May 1 to November 1, and winter grazing is permitted in lieu of summer grazing. Though
stocking rates are not specifically stated, grazers are requested to comply with state regulations, strive to improve the grazing lands, and conform to all principles of good husbandry; over- grazing is not allowed (Operations Division, Corps of En- gineers , Omaha District, personal communication).
kesults and Discussion
The shore vegetation around both Lakes Oahe and Sakaka- wea is a mosaic of ephemeral plant communities that survive one or more years before being decimated by a combination of high water and/or cattle grazing. The shore communities consist primarily of seral species that become established either during the autumn or spring when water levels are low. At least part of the shore is inundated every year, eliminating some species annually, with more tolerant species persisting.
Minnconjou, Moreau, and Grand River sites on Lake Oahe occur on Pierre Shale-derived substrate which weathers into heavy clays or clay loams. The high clay content results in high water-holding capacity following inundation, or precipitation, but the same substrates become very hard and cracked when dry. Soil pH is above 7.0 at all three sites, and cation exchange capacities are between 29 and 3 1 meq/ 100 g with calcium and magnesium dominating the exchange complex. Owing to vari- able amounts of organic matter in the shore substrates, the amounts of phosphorus and nitrogen are variable, and not espcially high. The edaphic characteristics of the three sites are sufficiently similar that vegetational differences among the sites are not directly related to substrate characteristics. The similar- Stated guidelines are obviously worthwhile for grazers. Parts
of any grazed area will be more heavily utilized than others, and because of access to water, reservoir shores are areas of intense use. Because the shores are inundated regularly and the veget- ation there is subject to drowning, it is somewhat more difficult to judge the impact of grazing. The ephemeral nature of the shore vegetation also makes it quite distinct from the upland steppe for which the grazing guidelines were actually written. The present study was done to document changes in shore vegetation as a result of cattle grazing along these two reser- voirs .
Methods
The shore vegetation is a mosaic composed primarily of alien species that survive for various periods between high water. Vegeta- tional changes occuring in these seral communities depend on such factors as source of disseminules, tolerance to flooding and/or water-logged substrates, timing of water level fluctuations in relation to phenological activities of plant species, and in some instances disturbance from cattle. Our study was done in 1976 following the record high water levels of 1975 during which most if not all the shore vegetation was drowned. Thus, most of the shore species encountered in our study became established late in 1975 or 1976. Doing the study in 1976 provided some measure of uniformity among the sites inasmuch as all the shore was quite depleted of species during 1975. In 1973 and 1974 we constructed several cattle exclosures, seven of which were used in the present study. The exclosures are approximate- ly 40 x 80 m (44 x 87 yd) with the long dimension perpendicular to the shoreline. All exclosures were constructed using steel posts planted about 10 m (11 yd) apart with four strands of barbed wire strung around the perimeter and clamped to each post. Corner posts were reinforced with additional stakes and wire. All exclosures have been checked twice yearly for maintenance needs. The exclosures were planned so that at least half the area inside was shore area and other half upland steppe. During the summers, when water levels are high, at least part of the shore area of each exclosure is inundated. Cattle have ready access to all the area around each exclosure.
At each sampling site (Fig. 1) we estimated plant canopy coverages within 2 x 5 dm (7.9 x 10.7 in) plots (Daubenmire 1959). We sampled 30 plots at meter intervals along a tape parallel to the shoreline inside the exclosure. A duplicate set of plots was analyzed along a tape outside the exclosure and the same distance from the shoreline. Where canopy coverages were estimated, we also collected plant materials for biomass estimates. These were done by clipping-at ground level all living vegetation rooted within ten 0.1 m* (1.1 ft*) plots inside each exclosure. For shrubs, only current year twigs and leaves were co1 lected. These plots were spaced 2 m (6.6 ft) apart along the same
ity of each pair of stands was calculated using the familiar index of similarity:
rs. = -
x
100 a+bwhere I.S. is the index of similarity, a is the total number of species in one stand, b the total number of species in the second stand, and c the number of species shared by the two stands. The value is multiplied by 100 to express the index as a percentage. Using total floristic lists from the above three sites, the indexes of similarity are the following: Minnconjou and Moreau = 37%, Moreau and Grand River = 1 1 %, and Minnconjou and Grand River = 10%. From ungrazed plots only, the indexes are the following: Minnconjou and Moreau = 40%, Moreau and Grand River = 34%, and Minnconjou and Grand River = 32%. From grazed plots only, the indexes are the following: Minn- conjou and Moreau = 23%, Moreau and Grand River = 3 1 %, and Minnconjou and Grand River = 27%.
Though chance is important in determining the composition of seral shore communities, there is considerable similarity among the three sites on Pierre Shale-derived substrates. Grazing reduced the similarities to some extent, as shown by the calculated indexes above. The Grand River site is the most heavily grazed of the three sites. It has the greatest abundance of Solanum rostratum and Grindelia squarrosa; both were more abundant on grazed plots at Grand River (Table 1). Important species on ungrazed plots at Grand River include Bromus japonicus, Chenopodium album, Helianthus annuus, Melilotus spp., Polygonurn achoreum, and Hordeum jubatum. All but Hordeum were less abundant on grazed plots. Total coverage on grazed plots at Grand River was only slightly less than on ungrazed plots (Table 1). Total biomass, however, was reduced by nearly 50% on grazed plots at this site (Table 2).
JOURNALOF RANGE MANAGEMENT31(6), November 1978
Table 1. Average canopy coverages (%) of plants in grazed (G) and ungrazed (U) plots along shores of Lake Oahe and Sakakawea. Only those species are included that had an average coverage of at least 1% at one site.
Sites and percent canopy coverages
Species
Minnconjou Moreau Grand River Kenel Hazen Garrison New Town
GU GU GU GU GU GU GU
Grasses:
Agropyron repens (quackgrass) ’ Agropyron smithii (western wheatgrass) Agrostis hyemalis (ticklegrass)
Alopecurus arundinaceus (garrison creeping foxtail) Beckmannia syzigachne (American sloughgrass) Bromus japonicus (Japanese chess)
Enchinocloa crusgalli (barnyard grass) Hordeum jubatum (foxtail barley) Panicum capillare (witchgrass) Poapalustris (fowl bluegrass) Pouprutensis (Kentucky bluegrass) Sphenopholis obtusutu (prairie wedgegrass)
1 1 2 3 1 5
2 19
8 6
Shrubs and Forbs:
Achilles millefolium (yarrow) Amaranthus albus (tumbleweed) A. gruecizuns (prostrate pigweed) Artemisia biennis (biennial wormwood) A. frigidu (pasture sage-brush) Atriplex rosea (redscale) Chenopodium album (goosefoot) C. hybridum (maple leaved goosefoot) Cirsium undufatum (wavy leaved thistle) Conyza cunadensis (horseweed) Descurainia sophia (herb sophia) Grindelia squat-rosa (gumweed) Hedeoma hispidu (false pennyroyal) Hefianthus annuus (common sunflower) Ivaxunthifoliu (marshelder)
Kochia scoparia (fireweed) Lactuca serriofa (prickly lettuce) Lepidium densiflorum (peppergrass) Medicago lupulina (black medic) Meltlotus spp. (sweet clovers) 2 Pfantugo eriopodu (alkali plantain) Pluntugo major (common plantain) Polygonum achoreum (erect knotweed) P. convolvulus (black bindweed) P. lapathifolium (nodding willow weed) P. ramosissimum (bushy knotweed) Potentifla norvegica (rough cinquefoil) Ratibida columnifera (coneflower) Rumex crispus (sour dock) Rumex maritimus (golden dock) Salsola ibericu (Russian thistle)
Sisymbrium altissimum (tumbling mustard) Solanum rostraturn (buffalo bur) Sonchus arvensis (field sow-thistle) Thlaspi arvense (pennycress) Verbena bracteatu (prostrate vet-vain) Xanthium strumarium (cocklebur)
Total cover, percent Total number of species
4 1 8 3 1 6 1
6 10
1 11 9 54 16 6 1 2 43 18 7 2 1 2 1 9 47 3 9 11 97 14 1 37 2 1 2 4 3 22 82 14
I Plant nomenclature follows Van Bruggen (1976).
2 Included here are Melilotus albus (white sweet clover) and Melilorus ojjkinalis (yellow sweet clover).
8 26
2
6 48
5 9 27 18 1 18 6 27 1 3 13
6 1
1 6 87 15 1 2 3 77 11 1 12 3
116 72 13 25 1 12 1 1 1 3 I 1 2 1 33 5 5 1 1 1 17 5 9 2 25 4 5 3 47 1 28 3 1 3 1 155 20
7 26
1 1 2 1 97 1 2 6
24 137
11 13
64 1 26 1 11 1
27 10
23 1 1 30 4 3 9 4 2 20 11 141 17 128 13
Rumex crispus often dominates shore vegetation the first year following high water. It germinates and establishes on the bare shore in late summer as the water level recedes, remains in rosette form overwinter, then forms dense stands the following
growing season. Cattle do
graze the species. At the Moreau site Rumex crispus had 47% and 10% coverage on ungrazed and grazed plots, respectively. At Minnconjou it had 6% coverage on ungrazed plots and was absent from grazed plots (Table 1).At Moreau Hordeum jubatum, Atriplex rosea, Polygonum ramossisimum, Thlaspi arvense, and Xanthium strumarium were also important on ungrazed plots and were reduced or absent on grazed plots. Contrary to results obtained at Grand River and Minnconjou, both Melilotus ssp. and Polygonurn achoreum were more abundant on grazed plots at Moreau. Total coverage at Moreau was 97% and 43% on ungrazed and grazed plots, respectively. Biomass at Moreau was 720 g.m- 2 and 19 73 g. m- 2 on ungrazed and grazed plots respectively (Table 2).