DOI : https://doi.org/10.32628/CSEIT195540
Business Value and E-Commerce Adoption
Anthony Akai Acheampong Otoo, Li Zhiwen, Charles Oduro Acheampong Otoo, Maxwell Opuni Antwi School of Management, Jiangsu University, 301 Xuefu Road, Zhenjiang, Jiangsu, P.R. China
ABSTRACT
The clear differences between developing nations and developed nations have posed an enormous problem in trying to design a “one-size-fits-all” theory of Electronic Commerce (EC) adoption. Most prior studies have proposed that generalizing findings of developed countries to the context of developing countries are of worry (Rahayu & Day, 2015; J. Tan, Tyler, & Manica, 2007). Table 1 shows the ICT Development Index (benchmarking tools to monitor information society developments worldwide) of some countries that have hosted the earlier literature on EC International Telecommunications Unions (ITU, 2017). These statistics may well indicate that businesses in developed countries and developing countries vary with regard to information technology and EC context. The latest ITU report in 2017 on ICT Development Index, ranks Ghana as the 112th country regarding ICT development in 2016, which shows a slight decline in the ranking compared to 111th in 2015 (the IDI value increased from 3.75 in 2015 to 3.99 in 2016). This may suggest that Ghana does not have appropriate infrastructure for effective e-business compared to countries like Singapore, China and USA.
Keywords : one-size-fits-all, Electronic Commerce, ITU, IDI, ICT, SME, HSPA, WiMAX, AVE
I. INTRODUCTION
It has been argued that the development of information and communication technology (ICT) provides leapfrogging opportunities for developing countries and as a result, the pressure is mounting on Ghanaian SMEs to embrace technology adoption in order to enjoy their benefits. The Government of Ghana in 2003, introduced the Ghana ICT for Accelerated Development (ICT4AD) policy and followed by the liberalization of the ICT sector, purposely to facilitate ICT infrastructural developments and human resource capacity building. The ICT4AD policy has provided an enabling platform for safeguarding the development of the ICT industry and fostering e-commerce in Ghana. The sector has developed rapidly following the introduction of wireless and third-generation (3G) mobile,
adoption of e-business has its own challenges and several factors influence web-based offering and the adoption of e-commerce. To date only few of these research studies have revealed the role of e-commerce in empowering SMEs to grow their businesses internationally. In Ghana, SMEs are the keen promoters and specialists of B2B e-businesses. While B2B ecommerce platforms have not been developed in Ghana, the presence of foreign B2B platforms such as Alibaba, Global Sources, HC360, and Focus Tech Have become common place in Ghana.
Despite the growing involvement of B2B SMEs in ecommerce, the case of the adoption and use of e-commerce by B2B companies in Africa faces several challenges. According to Xanthopoulou, et al (2009) using innovative technologies for B2B SME businesses comes with to B2B SME business if the users are not well oriented about its use. In the view of Sánchez, et al (2010) three main issues underline such changes, these include efficiency and effectiveness associated with such technologies, the speed of the market and the quantity of output that can be processed using modern technology (Li, et al, 2014). Considering that quality, speed and quantity are all important attributes and factors in competitive advantage several organizations do their best to acquire the most of them in order to achieve the competence and capabilities that comes with it (Wong, et al, 2016). The current stock of literature has eight different models to explain technology and e-commerce adoption. The objective of this research is to examine the e-commerce adoption process in relation to the innovation adoption process among B2B businesses in Ghana. The study explores external and internal organizational factors that stimulate technology adoption bearing in mind the social and individual factors that affect innovation adoption (Tsikriktsis, 2004). Specifically, this research focuses on SMEs that employ E-commerce in transacting business, and those that are nurturing such ambition to identify the barriers and facilitators of E-commerce adoption platform as
pertained to SMEs in Ghana. The study will specifically, explore how technological factors, organizational factors, and environmental factors significantly influences SMEs value of e-business, its resultant effect on adoption of e-commerce for international business and the intermediating role of facilitating conditions
II. METHODS AND MATERIAL
A total of 200 SMEs were sampled randomly across selected sectors in Ghana. The companies were selected based on the accessible population. The industries were selected from the pharmaceutical, real estate and fast moving consumer goods sectors. Respondents were also sampled from the hospitality industry, the woodwork and automobile industries. A five point likert scale questionnaire was designed and the technology readiness constructs were adopted from previous studies and the main constructs for technology were cost of technology, complexity of technology and compatibility of technology. The composite value for each firm with regards to technology readiness was compiled and used to analyse the data. The moderator variables were the size of the firm, the industry of the firm and the facilitating conditions. The size of the firm was measured using the number of employees while industry was denoted by a proxy value. The facilitating conditions used were adopted from the UTAUT model of technology adoption proposed by Venkatesh et al (2003). Figure 1 shows the structure of the model of hypothesis 1 that was tested. It is followed by the analysis of the responses provided by the respondents.
Structural Equation Modelling
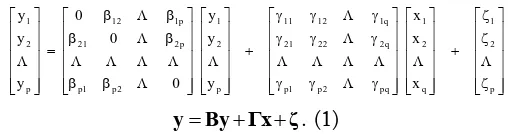
represent an arbitrarily chosen observation from the population, maybe the ith. In SEM (Structural Equation Model) terms y is said to contain the endogenous variables and x contains the exogenous variables. An endogenous variable is one that appears at least once as the dependent variable in an equation. On the other hand, variables that do not appear on the left hand side are exogenous, or "given." In other words, all variances of, and covariances between, exogenous variables are determined outside of the system. They are not at issue. The variances and covariances of the endogenous variables are being modeled as a function of the exogenous variables. This is mathematically expressed as follows:
variables on other y variables with 0’s on the diagonal which implies that a variable cannot cause itself. The p by q matrix contains the coefficients of the y’s on the x’s. The error vector, , is p by 1. These errors are different than factor analysis errors; they represent errors-in-equations, in the way that these equations are specified. Thus they are also called specification errors. To get to a point to estimate the model, some assumptions were added. For example, it was assumed that E(y) = 0 and E(x) = 0, which has absolutely no impact on the variances or covariances of these variables. We then assume that the x and vectors are independent. Further we employed a second order factor model. In effect, the factors themselves may form a higher order factor. In other words, if the correlations amongst the factors have the right
structure, these may be the result of a latent variable. A path diagram of this model appears below:
Figure 1: Path Model of Hypothesis
Figure 1 shows the model and path of relationship between the independent and the dependent variables in the relationship between technological factors, e-business value and e-commerce adoption for international business. This model generated four hypotheses which were tested as follows:
1. H1a: The cost of technology is likely to influence a firms adoption of e-commerce for B2B
2. H1b: The compatibility of technology is likely to influence a firms adoption of e-commerce for B2B
3. H1c: The complexity of technology is likely to influence a firms adoption of e-commerce for B2B
4. H1d: The influence of cost of technology on a firm’s adoption of e-commerce is mediated by the value it attaches to e-business
5. H1e: The influence of compatibility of technology with pre-existing system on a firm’s adoption of e-commerce is mediated by the value it attaches to e-business
-commerce is mediated by the value it attaches to e-business
7. H1g: The size of the firm moderate the relationship between business value and e-commerce adoption
8. H1h: The industry of operation moderate the relationship between business value and e-commerce adoption
9. H1i: Facilitating conditions moderate the relationship between business value and e-commerce adoption
III.RESULTS AND DISCUSSION
Sampling Adequacy Test
Before establishing the validity and reliability of the data for the research, the sampling adequacy was
tested using the KMO and Bartlett’s test. The KMO test for commonalities for each of the variables met the desirable threshold as they were sufficiently higher i.e. all of them were above 0.300 and most of them were above 0.00. This indicates that the chosen variables were adequately correlated for factor analysis. Further, the reproduced matrix had only 2% non-redundant residuals that were larger than 0.05 and this confirmed that the five factors for analysis namely technology readiness, e-business value, cost of technology, facilitating conditions and e-commerce adoption were appropriate for analysis. This paved way for the eventual factor analysis to reduce the dimensions of the variables if they did not meet the required Z score value.
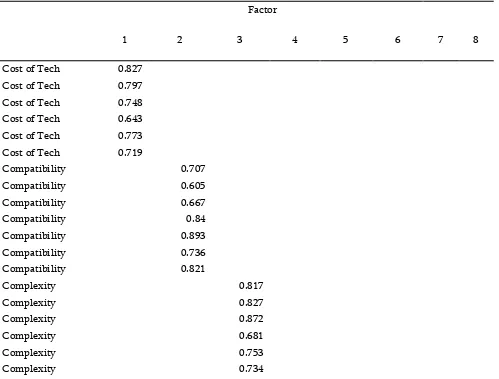
Table 1 : Pattern loadings and Cross Loadings
Factor
1 2 3 4 5 6 7 8
Cost of Tech 0.827
Cost of Tech 0.797
Cost of Tech 0.748
Cost of Tech 0.643
Cost of Tech 0.773
Cost of Tech 0.719
Compatibility 0.707
Compatibility 0.605
Compatibility 0.667
Compatibility 0.84
Compatibility 0.893
Compatibility 0.736
Compatibility 0.821
Complexity 0.817
Complexity 0.827
Complexity 0.872
Complexity 0.681
Complexity 0.753
Complexity 0.763
Facilitating Con. 0.709
Facilitating Con. 0.742
Facilitating Con. 0.636
Facilitating Con. 0.626
Facilitating Con. 0.732
Facilitating Con. 0.868
Facilitating Con. 0.641
Facilitating Con. 0.675
Facilitating Con. 0.673
Facilitating Con. 0.629
E-Bus Value 0.873
E-Bus Value 0.557
E-Bus Value 0.695
Industry 0.847
Size 0.659
Size 0.711
E-Commerce 0.643
E-Commerce 0.764
E-Commerce 0.667
Extraction Method: Maximum Likelihood.
Rotation Method: Promax with Kaiser Normalization.
a. Rotation converged in 7 iterations.
To establish the validity of each of the constructs used in determining technology readiness, an exploratory factor analysis (EFA) based on Maximum Likelihood with Promax rotation was employed to determine if each of the observed variables loaded together as expected. The analysis indicates an adequate correlation between them. As this is the first step in data reduction, all variables with loadings lower than 0.05 were expected to be deleted. However, none of the attributes recorded below the threshold value. The variables, therefore, met the reliability and validity criteria leading to seven independent factors presented in the pattern matrix. Subsequentl, the composite value of the first five items that depict technology readiness was determined and this further reduced the constructs to five which are then presented for further tests.
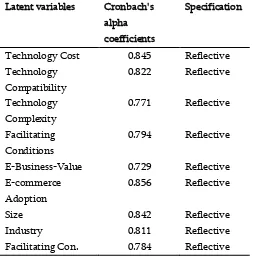
Table 2. Construct Reliability Measures
Latent variables Cronbach's alpha coefficients
Specification
Technology Cost 0.845 Reflective
Technology Compatibility
0.822 Reflective
Technology Complexity
0.771 Reflective
Facilitating Conditions
0.794 Reflective
E-Business-Value 0.729 Reflective
E-commerce Adoption
0.856 Reflective
Size 0.842 Reflective
Industry 0.811 Reflective
Table 2, shows the cronbalch alpha correlation coefficient test results indicating the degree of reliability of the items or dimensions for analysis. The result is a demonstration of strong convergent validity as the factors loadings exceed the threshold of 0.05 recommended by Anderson et al (2017). A further test of intra-dimension correlation to test multicollinearity proved insignificant. Thus a correlation matrix shows that there is no correlation value in excess of 0.500, an indication of good cross-loadings. To validate the
non-presence of multicollinearity among the independent variables, the variance inflation factor was also computed. This supports the integrity of the data for further causal analysis. This five-factor model had a total variance explained of 60%, with all extracted factors having eigenvalues above 1.0. Finally, acceptable statistical modification indices were explored to optimize the opportunity to improve the model before the final statistical analysis.
Goodness of Fit
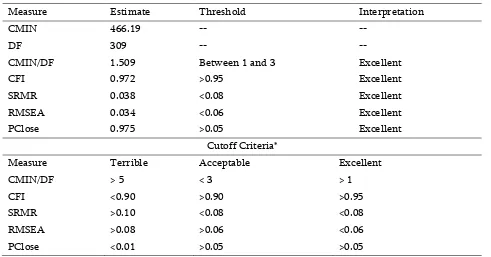
Table 3. Goodness of Fit Indices
Measure Estimate Threshold Interpretation
CMIN 466.19 -- --
DF 309 -- --
CMIN/DF 1.509 Between 1 and 3 Excellent
CFI 0.972 >0.95 Excellent
SRMR 0.038 <0.08 Excellent
RMSEA 0.034 <0.06 Excellent
PClose 0.975 >0.05 Excellent
Cutoff Criteria*
Measure Terrible Acceptable Excellent
CMIN/DF > 5 < 3 > 1
CFI <0.90 >0.90 >0.95
SRMR >0.10 <0.08 <0.08
RMSEA >0.08 >0.06 <0.06
PClose <0.01 >0.05 >0.05
Table 3 indicates the goodness of fit for the measurement model. To computer the general fit and the standard fit for each model and the comparative fit among the models, a wide range of the goodness of fit statistics indices and evaluation criterion were utlised to examine the precision of the model estimates. Firstly the Comparative Fit Index was used to evaluate the percentage of goodness of fit of model to the data differentiated with threshold model with unrelated factors as recommended by Bentler (1990). Results below 0.9 are considered a very bad fit while outcome in excess of 0.90 is deemded acceptable. Outcome in
“Standardized Root Mean Square Residual” (SRMR = 0.038), and the “root mean square error of
approximation” (RMSEA = 0.034), are acceptable. And strongly indicates model fitness
Table 4. Model Fit Measures
CR AVE MSV 1 2 3 4 5 6 7 8
Technology Cost 0.855 0.821 0.739 0.828 Technology Compatibility 0.865 0.830 0.747 0.673 0.672 Technology Complexity 0.872 0.837 0.753 0.678 0.610 0.723
Facilitating Conditions 0.81 0.778 0.700 0.630 0.567 0.556 0.782 E-Business-Value 0.873 0.838 0.754 0.679 0.611 0.599 0.599 0.732 E-commerce Adoption 0.754 0.724 0.651 0.586 0.528 0.517 0.517 0.507 0.832 Size 0.925 0.888 0.799 0.719 0.647 0.634 0.634 0.622 0.609 0.691 Industry 0.821 0.788 0.709 0.638 0.575 0.563 0.563 0.552 0.541 0.541 0.753 Facilitating Condition 0.743 0.713 0.642 0.578 0.520 0.510 0.510 0.499 0.489 0.489 0.475
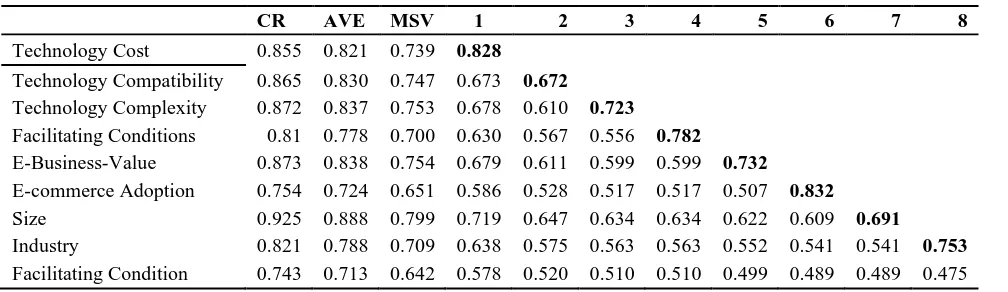
The composite reliability test of each of the constructs has been presented in table 4. The information shows that the variables exceed 0.70 and suggest a very high internal consistency among the constructs. Because the four latent variables show high internal consistency, low confirmatory reliability (CR) value could be accepted but in the case, these are also very high and outperforms the 0.70 thresholds as suggested by Pallant (2016). In addition, the convergent validity is within limit because all the factor loadings are in excess of 0.60 benchmarks. The average variance extracted (AVE) for all the factor is exceeds 0.50. As noted by Fornell et al. (1981), such the square root of the average variance extracted in each latent variable can be used to examine the discriminant validity, if this value is larger than other correlation values
among the latent variables. The results also confirm the fact that there is very high data integrity and further inferential analysis can be conducted from the data.
Table 5. Results of Path Analysis (TRI and eBusiness Value and eCommerce Adoption)
Paths
Hypothesis
Path Coefficient P Values
Status
TCost eCommerce
H1a
-0.381
0.011
Acceptable
TCompat e-Commerce
H1b
0.384
0.031
Acceptable
TComplex eCommerce
H1c
-0.256
0.021
Acceptable
TCost eValue e-Com
H1d
-0.499
0.000
Acceptable
TCompat eValue e-Com
H1c
0.519
0.001
Acceptable
TComplex eValue e-Com
H1d
-0.573
0.000
Acceptable
eValue Size e-Com
H1d
0.541
0.000
Acceptable
eValue Industry eCom H1c
0.619
0.001
Acceptable
The analysis of the relationship between cost of technology and e-Commerce is first presented in table 5. The result is to establish the validity of hypothesis H1a that the cost of technology is likely to negatively influence a firms adoption of e-commerce for B2B. The path analysis coefficient for this model is -0.381 and it is statistically significant at 95% confidence interval. This is evidenced by the fact that the p value is 0.011 which is greater than 0.05. In essence the hypothesis that the cost of technology is likely to influence a firms adoption of e-commerce for B2B. The second hypothesis in this category was to evaluate the relationship between compatibility of technology and e-Commerce which is also presented in the table. The path analysis coefficient for this model is 0.384 and affirms the statistical significance of the hypothesis that the compatibility of technology is likely to influence a firms adoption of e-commerce for B2B. Again the p value of 0.031 support the above claim. Regarding the results for the test of hypothesis 1c that the complexity of technology is likely to influence a firms adoption of e-commerce for B2B, the path coefficient returned a value of -0.256 and a p value of 0.021. The implication is that a complex technology is negatively associated with e-commerce adoption. The less complex the technology, the better the rate of technology adoption. Hypothesis 1d was to determine the mediating effect of e-business value on the interaction between cost of technology and adoption of commerce. The analysis shows that e-business value reduced the degree of negativity by 0.499 in the case of cost of technology whereas the positive influence of compartibility of technology and commerce improves by 0.519 in the presence of e-buisness value. The mediating influence of eBusiness value in the relationship between complexity of technology and eCommerce adoption is 0.573 and these are all statistically significant. Thus it can be posited that the influence of cost of technology on a firm’s adoption of e-commerce is mediated by the value it attaches to e-business. Similarly it is argued
that the influence of compatibility of technology with
pre-existing system on a firm’s adoption of e
-commerce is mediated by the value it attaches to e-business. The study further affirms the fact that the influence of complexity of technology on a firm’s adoption of e-commerce is mediated by the value it attaches to e-business. The results of the moderating effect the size of the firm on the transfer of e-business value to e-commerce adoption is also investigated in this part of the study. The analysis indicates that size of a firm has a role to play in the speed of e-business value conversion to e-commerce adoption. This is evident in the path coefficient value of 0.541 and a significant value of 0.000. The study further confirms the validity of the claim that the industry of operation moderates the relationship between e-business value and e-commerce adoption. This means that while business organizations may have a stronger sense of appreciation for e-business, the industry in which they operate plays a no mean role in stimulating greater conversion to their eventual e-commerce adoption. This view is supported by the path coefficient path of 0.619 and the significant value of 0.001. Finally, hypothesis H1i is also affirmed in this study because the path coefficient value of 0.192 is an indication that facilitating conditions moderate the relationship between e-business value and e-commerce adoption
IV.CONCLUSION
purposes. A higher cost of technology invariably reduces the interest and the value that is placed on technology. This also requires internet and other e-commerce technology providers to be mindful of the cost they place on e-commerce technologies. Finally, the intervening role of facilitating condition is also important in ensuring full acceptance and use of e-commerce technology irrespective of the value that is placed on it by firms. As indicated in the test of hypothesis 1d, a firm’s strong e-business value resulting from technology readiness positively and statistically affects the e-commerce adoption process. However, the path coefficient value of 0.593 suggests that facilitating conditions are necessary to actualize the speed or pace of acceptance and use of these technologies.
V. REFERENCES
[1]. Abbas, Hasan A, & Alshawaf, AH. (2003). Issues and motivations surrounding internet use in Kuwait. Arab Journal of Administrative Sciences, 1(10), 93-110.
[2]. Abrazhevich, Dennis. (2001). Classification and characteristics of electronic payment systems. Electronic Commerce and Web Technologies, 81-90.
[3]. Acheampong, Patrick, Zhiwen, Li, Antwi, Henry Asante, Otoo, Anthony Akai Acheampong, Mensah, William Gyasi, & Sarpong, Patrick Boateng. (2017). Hybridizing an Extended Technology Readiness Index with Technology Acceptance Model (TAM) to Predict E-Payment Adoption in Ghana. American Journal of Multidisciplinary Research, 5(2).
[4]. Acheampong, Patrick, Zhiwen, Li, Boateng, Frank, Boadu, Adelaide Brenya, & Antwi, Henry Asante. (2017). Determinants of Behavioral Intentions of 'Generation-Y'Adoption and use of Computer-Mediated Communication Tools in
Ghana. BRITISH JOURNAL OF
INTERDISCIPLINARY RESEARCH, 8(1). [5]. Bayo-Moriones, Alberto, & Lera-López,
Fernando. (2007). A firm-level analysis of determinants of ICT adoption in Spain. Technovation, 27(6-7), 352-366.
[6]. Beaudry, Anne, & Pinsonneault, Alain. (2005). Understanding user responses to information technology: A coping model of user adaptation. MIS quarterly, 493-524.
[7]. Bednarz, MICHELLE, & Ponder, N. (2010). Perceptions of retail convenience for in-store and online shoppers. Marketing Management Journal, 20(1), 49-65.
[8]. Beetham, Helen, & Sharpe, Rhona. (2013). Rethinking pedagogy for a digital age: Designing for 21st century learning: routledge.
[9]. Dontoh, Ekow, & Vuuren, and Andre Janse Van. (2018). Ghana Economic Growth Rate.
[10]. Dzokoto, Vivian Afi, & Appiah, Elizabeth. (2014). Making sense of mobile money in urban Ghana: Personal, business, social and financial inclusion prospects. Institute for Money, Technology and Financial Inclusion (IMTFI). University of California, Irvine.
[11]. Eastin, Matthew S. (2002). Diffusion of commerce: an analysis of the adoption of four e-commerce activities. Telematics and informatics, 19(3), 251-267.
[12]. Eastlick, Mary Ann, Lotz, Sherry L, & Warrington, Patricia. (2006). Understanding online B-to-C relationships: An integrated model of privacy concerns, trust, and commitment. Journal of Business Research, 59(8), 877-886.
[13]. Godoe, Preben, & Johansen, Trond. (2012). Understanding adoption of new technologies: Technology readiness and technology acceptance as an integrated concept. Journal of European Psychology Students, 3(1).
International Journal of Retail & Distribution Management, 43(3), 221-241.
[15]. Ha, Sejin, & Stoel, Leslie. (2009). Consumer e-shopping acceptance: Antecedents in a technology acceptance model. Journal of Business Research, 62(5), 565-571.
[16]. Hair Jr, Joseph F, Hult, G Tomas M, Ringle, Christian, & Sarstedt, Marko. (2016). A primer on partial least squares structural equation modeling (PLS-SEM): Sage Publications.
[17]. Hair, Joe F, Ringle, Christian M, & Sarstedt, Marko. (2011). PLS-SEM: Indeed a silver bullet. Journal of Marketing theory and Practice, 19(2), 139-152.
[18]. Hwang, Yujong. (2010). The moderating effects of gender on e-commerce systems adoption factors: An empirical investigation. Computers in Human Behavior, 26(6), 1753-1760.
[19]. Ifinedo, Princely. (2016). The moderating effects of demographic and individual characteristics on nurses' acceptance of information systems: A canadian study. International journal of medical informatics, 87, 27-35.
[20]. Im, Il, Kim, Yongbeom, & Han, Hyo-Joo. (2008). The effects of perceived risk and technology type on users' acceptance of technologies. Information & Management, 45(1), 1-9.
[21]. Ismail, Ahmed Rageh. (2012). Understanding the factors that affect the adoption of innovative high-technology brands: The case of apple iPhone in Malaysia. Journal of Global Marketing, 25(4), 226-239.
Cite this article as :
Anthony Akai Acheampong Otoo, Li Zhiwen, Charles Oduro Acheampong Otoo, Maxwell Opuni Antwi, "Business Value and E-Commerce Adoption", International Journal of Scientific Research in Computer Science, Engineering and Information Technology (IJSRCSEIT), ISSN : 2456-3307, Volume 5 Issue 5, pp. 262-271, September-October 2019. Available at doi :