ISSN 2286-4822 www.euacademic.org
Impact Factor: 3.1 (UIF) DRJI Value: 5.9 (B+)
Power Management in Wireless Sensor Networks
through Network Parameters
SYED ABDUL WALI
Directorate of Education Bureau of Curriculum & Extension Centre Quetta, Pakistan
Abstract:
Wireless Sensor Networks have large number of small nodes used to detect environmental data, send this collected data to the user used for a particular purpose. These networks have been installed on a special area to achieve fine result of the targeted area. These networks have many applications in daily life, in various fields, for example environmental monitoring, industrial applications and in medicines etc. Wireless Sensor Networks contain nodes. These nodes contain small batteries with limited power. The main problem with this network is its power management, so that it may work for a long time, while power management in wireless sensor network is not a simple task to be solved easily. Deep knowledge is needed to solve power management issue.
After the deployment of sensor nodes, it is not easy to replace each and every battery in the network. Therefore optimal power consumption for WSN is necessary. Power management techniques have been applied that reduce power consumption with increasing network life time. To extend the life time of wireless sensor networks as well as conserving its power, some network parameters have been considered, which play an important role in the reduction of power consumption. These parameters are as Network size, the sensor Radius, Transmission Radius and the Transmitter Period. These metrics deeply affect the power consumption.
1. Introduction
Wireless Sensor Networks
A wireless sensor network is made up of large number of low power sensor. Now a days wireless sensor network are used to find wide range of applications such as radiation level control, battlefield, structural health, noise pollution control, biological detection etc. wireless sensor network contains several number of sensors nodes which are deployed in a given area of interest. The concept of wireless sensor network based on a simple equation: Sensing + CPU+ Radio = Thousands of potential application.
The sensor nodes collect the surrounding data and send it to the neighboring nodes in single hop. The neighboring nodes send this collected data to the neighboring node in a single hop distance. In this way data is transmitted to the sink node and the report message is sent back to the base station [1,22].
Wireless Sensor nodes have one or more microcontrollers, CPUs, Memory. Each node has a RF transceiver and a battery. These nodes contain sensors & actuators. These nodes communicate each other wirelessly after deployment [2].
Unlike other wireless networks, it is hard to charge/replace an exhausted battery, which gives long life to the network.
Communication of sensor nodes is more energy consuming as compared to the computation. We should minimize the communication in order to achieve desired network operation[3].
2. The architecture of WSNs
The main components of WSNs are sensor nodes and the sink:
collect data and send back this data to the user via sink i.e. the base station.
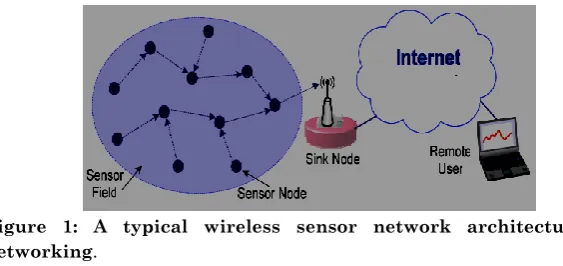
The Sink: which provides the information received from sensor field to the user through satellite or internet. The collected information is brought to sink through infrastructure less link from sensor field [5].Sink is used to inject queries into the sensor field and sensor nodes are used to sense the events which occur in the environment and qive response to those queries. The sink may connect to the outside world through internet. Sink collects the data from sensor field and transfer it to the user who requested the data. The sink may an individual user who needs the information[23].
Figure 1: A typical wireless sensor network architecture and
networking.
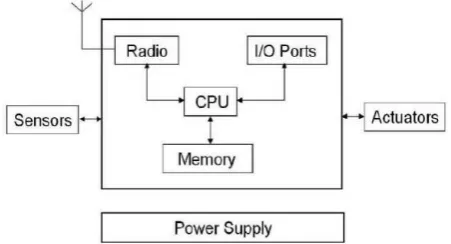
The basic block diagram of a sensor node is made up of four components: a sensing unit, a processing unit, a transceiver unit and a power unit. There are also application dependent components such as location finding system and a mobilizer.
fed in to processing unit.
Processing Unit: the processing unit provides intelligence to the sensor node.this unit consist of microcontroller which controls sensors, the execution of communication protocols and the algorithm on the collected data by sensor.
Figure 2: Architecture of wireless sensor node.
Transceiver Unit: the radio enable wireless communication with neighboring nodes and with the outside world. It consists a short range radio which works on single channel at low data rate. There are several factors that affect the power consumption of a radio that include the modulation scheme used , the data rate, the power to transmit and the operational duty cycle.
Battery: The battery provides the power to the complete sensor node. It plays a vital role in determining the life time of a sensor node. The battery should be monitored very carefully. sensor nodes are small , light and cheap and the battery size is limited[22].
3. Sources of power utilization in wireless sensor networks
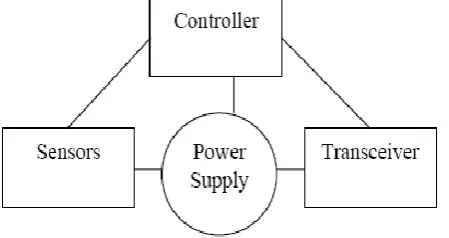
component is mandatory. Each node consist of four parts; A
sensor links the environment under monitoring to the network, computation part consists of microcontrollers (processors in some applications) and it is performing the task of sensor control and the communication responsibility ,
transceiver connects the nodes and the base station and power providing source which acts as battery. Many options are available for each component of the node to be used,good decision making is important for choosing the suitable component which has direct effects on the power utilization [7].
Figure 3: A view of wireless sensor node components.
To solve the power management problem in WSN, deciding power level and the range for each packet sending is useful. The transmit power also has effects on the traffic carrying potential of this networking. It will be very good if transmit power is set to very nominal. This option may extend the battery life (power wise).
Power control has direct influence on routing and power selection and transmitters are proportional to each other. Power control also affects the packet latency. Due to low power, packet will follow an enormous amount of hops that can cause an increased latency because of packet delay over every hop [8].
Communication:
Wireless Sensor networks has a limited bandwidth, the links which connect the nodes has bandwidth only in range of kbps that gives latency problems, low quality of service and packet loss frequently [4].
Power Consumption:
Power utilization is the focal challenge of sensor nodes. The small batteries have potential for one year in idle state while it stays for one week if it has to perform the task .The wireless sensor node, being a micro-eletronic device, can only be equipped with limited power source (<0.5 Ah, 1.2 V). in some applications the replenishment of power source might be impossible. Sensor lifetime therefore depends on the battery lifetime. In multichip ad hoc sensor network the sensor node acts both as data generator and data router. Power consumption can be divided into three portions: sensing, communication and data processing. Sensing power varies with the nature of applications[4,21].
Uncertainty in the sensor outputs:
The outputs of sensor networks may fluctuate in different environments due to environmental factors e.g. environmental noise [4].
5. Literature Review
5.0 Power managing techniques 5.1 Autonomic WSNs:
half second intervals for sudden changes, which in this case equated to intrusion event when no event detected it sends data only every eight seconds. When it detected event/sequence of events, it will transmit every half second. The intelligent agent-based scheme which is used to detect an intruder. In case of any intruder it transmits the data every half second. Non intelligent agent-based scheme sends the result after every eight seconds which can cause of further power wastage. Agent based scheme accuracy is 91% while the accuracy of Non intelligent agent-based scheme may become less than 78%.It would not be wrong to say that the agent-based scheme is successful in reducing of power [5].
5.2 Uniform Radio Power Management:
Uniform Radio Power Management (UPMA) provides support to different power management protocols existing at the top of many layers with the use of different applications and platforms. It is more efficient in managing the power to a great extent in the whole WSN. UPMA confine three essential layers [6].
Unified Architectural Abstractions facilitates the
amalgamation of different power management strategies. These abstractions help in separating power management strategies from basic network protocols, which enable them to coordinate over multiple layers and to work in a combined way in the presence of multiple applications.
High level Modeling Abstractions differentiate the main
properties of various applications, Hardware platforms and power management protocols. Their presence permits someone to perform systematic analysis and composition of various power management protocols together.
Configuration and Analysis Tools automate the
an overall power management strategy that matches the characteristics of a particular application and network setup, which ensures the compatibility between each power management protocol & the network protocol which satisfies the network qualities and composing multiple power management protocols to produce an overall power management solution.
5.3 Clusterpow power control protocol
It is a protocol designed mainly for the purpose of power control and clustering in the non-homogenous networks. The routes in CLUSTERPOW have hops of different transmitting power ranges. The network consists of three level respectively 1mW, 10mW and 100mW while the whole network clustering is 100mW. A 100mW of power is uses at each hop whenever a packet travels from origin S to the location D at cluster 10mW that concerns to that end. After that a 10mW is used at each hot till 1mW cluster to the target belong may be achieved. At last series of 1 mW hops helps packet to targeted goal [8].
Figure 4: diagram showing CLUSTERPOW in non-homogenous networks.
5.4 COMPOW
the nodes are distributed and dispersed homogeneously. Options of general transmitting power level contain a few characters. On the other hand, when nodes are non-homogeneously isolated then low and common level for network connectivity is promising for far-flung nodes those which are far away as of remaining ones. Each node except node F is commonly accessible at 1mW e.g: they make 1mW cluster but F is accessible with the usage of power of 100mW.The COMPOW algorithm intends to unite to low level power when the network is connected and fixed at 100mW.yet 1mW is satisfactory nearly to all the required communications [8].
(a) Homogeneously spatial dispersion of node (b) non-homogeneously dispersion of nodes
Figure 5: Clustered and Homogeneous networks.
Figure 6: Frequent power range is not liked regarding non-homogeneous networks.
Power management and routing has great relationships and directly affecting each other [8].
5.5 Power Management Techniques
Static Power Management
Dynamic Power Management
5.5.1 Static Power management
Useful technique at design moment. Actually it is the incident provoked setup. During the design moment it is determined that how much power is required by the CPU as well as how much amount of power is needed for system's elements [9].
5.5.2 Dynamic Power management
Technique applied during run time when system is specially operating a light load task or not processing .this technique can be put into practice in different ways, for example Dynamic Voltage Scaling technique which reduces the processor supply voltage at run time as a technique of power management. This technique can also be applied to turnoff the unused nodes in sensor networks. It's a technique for power saving [9].
5.6 The coordination-based power save protocol (CPSP)
The base station comprises significantly extra resources as compared to that of sensor nodes. It has direct attachment with the power grid. The dedicated network node has been suggested as a network coordinator so as to make definite that the base-station is proficient in accumulating message from network node to an extensive time. The base station is an accepted candidate to act as a coordinator. Cells that do not have to set up the active node are determined through a co-ordinator. In residual Grids each and every one nodes are set to be asleep till subsequent the topology updates.
tree in graph. These leaves of Tree are network grids which do not have to keep an active node [10].
6.0 Technical issues in Power Management in WSN
6.1 Deployment
In the physical surroundings the deployment of sensor nodes may take numerous forms. The deployment of nodes may be accidental, for example falling them from an airplane to view circumstances or fitted intentionally at locations which are necessary to be monitored. Deployment may be done once while the installations of a sensor network are harshly separate activities. Deployment may also be an unbroken method, with further nodes being deployed at any time throughout the use of the network for example to replace unsuccessful nodes or to get better coverage at certain appealing sites [15].
6.2 Security Issues & Goals 6.2.1 Data integrity:
Data integrity indicates that data has not been distorted by the intruder [11].
6.2.2 Data Authenticity
Data authentication stops unauthenticated parties from taking part in the network. The genuine nodes recognize the coming message from unauthenticated parties and reject them. In the two side communication the authentication process is performed by symmetric mechanism. Sender and receiver share shares a secret key for data exchanging. When a message from a correct MAC appears the receiver identifies that it has been sent by genuine sender [11].
6.2.3 Resource Management:
as well as computation, communication & sensing potential and the left over power of sensor nodes. Sensor node sends information to the cluster head if it finds that his power is going to down less than the required level. Inputs from applications include control flow, data flow, application structure, resource requirements and performance constraints. Familiarity with proper useful Metrics for resource specification is important.
Trade-offs needed to reveal among the power utilization, total power dissipation and the power balance across the system. Application sample and performance requirements give fundamental direction and constraint to such tradeoffs [14].
6.2.4 Mobility
Sensor nodes alter the site once they have been deployed. Mobility is the consequences of ecological influence for example wind or water. Mobility is the most wanted feature of the system for example, shifting nodes to some sites, here mobility active (automotive) or passive (having tied an object in motion state and not in sensor node control). Mobility is applicable for all nodes within the network domain or for unit nodes. Mobility has direct effects on the design of networking protocols [15].
6.2.5 Time Synchronization
Nearly all sensor network applications rely on time synchronization. Wireless Sensor Networks requires group synchronization while tracing the application [5].
6.2.5 Flow Control
transmit speed [12].
6.2.6 Lifetime
The life time of sensor network varies form few hours to numerous years depending upon its application. The required lifetime depends on the energy available as well as the potency of sensor nodes [15].
6.2.7 Inter-Cluster Coordination:
The exchange of information among cluster nodes is needed for coordination and sharing of information. Information gathered at a cluster node is needed by the base station or other cluster lying in the network domain. About every one clusted head has an information supply, obtainable routing protocols e.g: directed diffusion are most appropriate. The coordination among the cluster is useful if there is deadlock avoidance as well as if there is no resource contest [14].
6.2.8 Secure Localization
WSN prefers the sensors if they are functioning in its allotted area. A sensor network designed for faults finding requires precise location information of WSN for identifying the fault position. Unfortunately an invader may exploit the non secured location information by describing bogus signals and replay the signals [13].
6.2.9 Connectivity
the partition nodes the messages may be transported across partitions through mobile nodes. Commonly the connectivity has direct effect on the design of communication protocols as well as means of data gathering [15].
7. Analysis & comparison of techniques to Manage power in WSN
7.1 PEAS (Probing Environment & Adaptive Sleeping)
The PEAS is a protocol that may construct s sensor network which may stay for a long period and uphold vigorous jobs by means of big quantities of cost-effective, short-survived nodes. It broadens the working time length with the help of just a required number of sensors performing the task & setting the remaining nodes in the sleeping nodes. Resting nodes wake up from time to time, inquiring the neighboring environment and substitute fail nodes. Periods for sleeping are being managed dynamically just to keep the sensor's wake up rate constant, as a consequence adjusting to high node densities. PEAS design aim at a much adverse working situation are Node breakdown must be considered standard rather than exceptions. Nodes have limited memory & resources for affording multifaceted protocols. PEAS attains fine vigorous maneuver to randomize the sleeping periods of inactive periods of inactive Nodes for discover with the replacing of unsuccessful nodes dynamically. It removes per neighbour conditions and ending the complexity of tracking each neighbour in a crowded deployment [16].
7.2 BESM (Balancing Energy-aware sensor management protocol)
BESM comprises five functioning conditions: Initializing, Sleeping, Probing, Active as well as dead conditions [17].
Initializing state:
During this State each node performs infrastructure setup for example node localization, topology configuration as well as time synchronization.
Sleeping state:
In this condition the node waits for a random time and afterward departs to the Probing condition.
Probing state:
In this condition node sends PROBE message within its probing range and decide to depart to Active condition or Sleep condition.
Active state:
In this condition the node can perform sensing as well as communication.
Dead state:
Node goes into this condition if it stops working or uses all the available power.
Figure7: Finite State Machine Model for BESM.
7.3 Bimodal Power-Aware Routing (BIPAR)
BIPAR is a fresh routing protocol for Wireless Sensor Networks.
above the Min-Power Track from the origin to the destination. Min-Power adopts the ways which have less physically less hops as compared to longer hops. Min-power is tolerable in case of node breakdown.
Whereas the second approach is maxpower routing. It exploits extra power for routing packets. It prefers longer hops over shorter hops. It curtails the quantity of hops to get in touch with the target. To conserve power BIPAR node starts routing packets in min-power form. If communication flourishing, BIPAR accumulates great power else nodes switching to Max power condition in order to route the packets. The subsequent transmission uses additional power as compared to the first mode but it has high success chance.
This paradigm goes well with considerable node malfunction where many closely placed nodes may stop working all at once. Shifting to max-power routing is the resolution to send packets effectively. The key role of BIPAR is the feature of switching one mode to the other mode to adjust to the existing routing situations in surroundings [18].
7.4 Traffic Adaptive Medium Access Protocol
Traffic Adaptive Medium Access Protocol (TRAMA), it is Time Division Multiple Access working based protocol planned for collision free channel and power efficient Wireless Sensor Networks. The power utilization may be minimized through accident less transmission as well as by transforming the Nodes to low level inactive condition in case of no communication [19]. This protocol has three parts:
1) The Neighbor Protocol accumulates information of adjacent nodes.
2) The Schedule Exchange Protocol exchanges the two hops neighbor schedule & their information.
Advantages of TRAMA:
It has higher throughput
TRAMA has more latency as compared to other contention based MAC protocols.
Disadvantages:
TRAMA is suitable for applications which are not delay sensitive but need high throughput.
7.5 In-network processing
As soon as the sensors identify some events, these events are circulated towards users. In fact during data transmission the power utilization is very high while in data processing the power consumption remains less. The power loss of sending one bit of data is the same which is required for giving out a thousand processes in a sensor node. To lessen power consumption, an approach is to reduce the figure of transmissions. For this method, intermediary nodes may possibly combine a number of proceedings into a solitary event to decrease the number of transmissions along with the total data size in favor of system resource savings. Data aggregation is a good method. It is the collection of data from various locations by applying various functions as Max,Min, Averate & Supression. Some functions can be operated partially and other may be fully in every sensor node which permits sensor nodes to perform in-network data reduction. It mean that computation is less power consuming as compared to communication [20].
OUR PROPOSED APPROACH
1. Network Size:
It shows the quantity of node in the network reservoir. If it has high value then there will be several hundred nodes and this will increase the density of the network as well as the number of network connections.
2. Sensor Radius:
It shows the sensing range and the closeness of sensor in the network and also showing area where an event can be detected.
3. Transmission Radius: showing the maximum distance between two connected nodes in the network within which they can communicate. It this value is set to high range then nodes may be able to reach each other but if set to a low value then nodes must be close to each other to communicate.
4 Transmitter’s Interval:
The time slot for sending a packet. If set to a high value then it will take several seconds for each packet transmission. The data received will be quite stale and many seconds will be elapsed since the triggering event.
Simulation Setting
from failure. We use the different number of nodes of different readings for each scenario.
Implementation and Simulations
1 Effects of Network Size on power consumption:
The lifetime of the network decreases as there is increase in the initial quantity of nodes (Maximum number of hops). This is expected that larger transmission load causes faster battery power consumption.
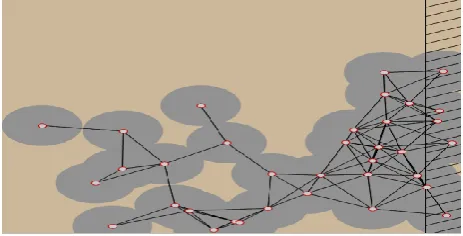
Figure 8: showing network having less number of sensor nodes.
Figure 9: Showing network having large number of sensor nodes.
among these nodes.
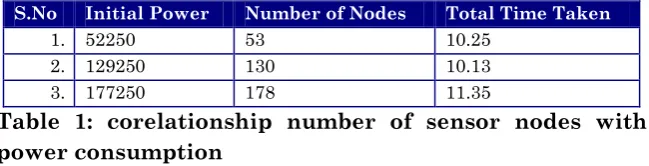
S.No Initial Power Number of Nodes Total Time Taken
1. 52250 53 10.25
2. 129250 130 10.13
3. 177250 178 11.35
Table 1: corelationship number of sensor nodes with power consumption
As shown by the table above the average consumption power of 53 nodes is less than as compared to 130 and 178 nodes as well as the operational simulation time of 53 nodes is high as compared to 153 and 178 nodes.
Figure 10: Relation between number of sensor and Time.
packets need to be retransmitted.
Large wsns become expensive and generally slow, due to large size it becomes very hard to restrict attackers from entering and disrupting the network, as well as the large size of network creates many complications. Security issue becomes important when the network size starts growing and once deployed this big network, its maintenance needs and supervision needs more and technical people. Large network do not meet local information needs and interest. So the big network becomes vulnerable to attacker.
The small size of network covers small area which results quick message sending and receiving process. These messages can have pictures, sounds or data included with them.
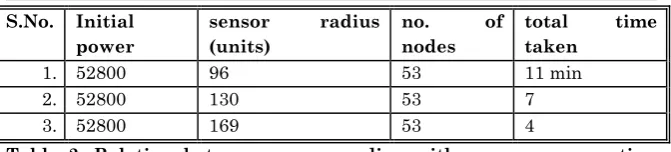
2. Role of Sensor Radius on Power Consumption
The area in the sensor can detect an intruder in the field of wireless sensor networks. If there is high sensor radius set, there will be more power exertion and more chance of power consumption as sending signals to the entering object, so if radius high power consumption will also be high causing more power depletion and the life of the wireless sensor network will be shorter. So sensor radius should be designed considering the power.
S.No. Initial power
sensor radius
(units)
no. of
nodes
total time
taken
1. 52800 96 53 11 min
2. 52800 130 53 7
3. 52800 169 53 4
Table 2: Relation between sensor radius with power consumption time
The sensor radius means that the area in which the sensor can detect an event in it. when the area of the sensor becomes larges , it means that the sensor can detect more events and the transceiver of the ode send more packets to its neighboring nodes which result of more faster power drop and afterwards the power of the whole network. Three times readings have been taken, here the number of sensor nodes are constant i.e. No. of nodes is 53 sensors and the sensor radius reading taken three times are 96,130,169 units. The two networks that contain sensor radius of units 130 and 169, it is clear that these networks become out of service faster than the network of sensor radius 96 units. Out of service means there is no links between monitored area and the observer area. For the network that contain 169 units will detect more events and that will cause more drop in the total power of the network.
Figure 12: Graph showing sensor radius with power consumption.
3. Effects of Transmission Radius on power consumption:
The maximum distance between two connected nodes. Transmission radius is the distance between two nodes of network where communication between them occur. If set to a high value, nodes on opposite sides of the map may be able to reach each other; if set to a low value, nodes must be very close to communicate.
Figure 13 : Sensor nodes with high transmission radius.
S.No. Initial power
TRANSMISSION radius (units)
no. of
nodes
total time taken
1. 52800 96 53 9
2. 52800 173 53 6
3. 52800 255 53 3
Table 3: Relationship between transmission randius & simulation time
4 Effects of Transmitter Period on power consumption:
Transmitter period directly affects the power consumption. If the transmitter period is set to high value then the signal received will be very stale and power consumption will be lower and if set very low then the power consumption will be very high that causes faster battery depletion. The simulation results reveals that if transmitter period is one unit then remaining power after 4 minutes will be 2323 and if the transmitter period is set to 2 and 3 units then the remaining power after 4 minutes will be 3060 and 4021.The transmitter period inversely affects the power consumption.
Figure 15: inter dependency of transmitter period and power consumption.
Conclusion and future work
,seismic detection, smart spaces, inventory tracking etc. Though power consumption is one of the main challenges particularly in application set-up where an extensive network lifetime is necessary. Actually nodes are usually powered through batteries which possess inadequate capacity. Power is a limited supply & it should be used sensibly. Some useful power management approaches should be set up at the nodes level and at the network level for battery life extension. It is very hard to replace or recharge the exhausted battery in a wireless sensor network, since the communication among nodes uses more power than the nodes computation. Communication is the foremost source of consumption of power. A central system means some nodes communicate for long distance which can cause of more power lessening.
Wireless sensor networks have limited power and extra jobs may decrease the life time of the network and our aim is to extend the power with good management.
The research work has related to reducing power consumption.
While the batteries of sensor nodes are of limited power, a node having a condition of depleted power is being considered as out of communication. The worst case of the wireless sensor network is its minimum life of its sensor. This research work has been devoted for maximizing the network lifetime.
The simulation work of the wireless sensor network has been described as: the network being deployed based on certain number of parameters: network size (number of nodes), Sensor Radius, Transmission Radius and Transmitter Period).The network can be used to detect the vectors travelling across the sensor network field. Each node too simulates power store which become deplete by sending and receiving packets and by detecting vectors. The nodes have finite power storage, they eventually power down and drop out of communication network which causes of network failure.
the network and running the simulations. Configuring the network means setting these parameters as networks size, Sensor Radius, Transmission Radius and Transmitter Period according to the required level. The properties are set the network is created.
Running the simulation
Once the network deployed simulated just by clicking start simulation. The map showed vectors moving through the field and triggering sensors. The progress of the network has been viewed through the simulation status box.
Below are our parameters where we want to perform the task with simulation and readings have been achieved above. These parameters are: Network size, sensor radius, transmission radius and transmitter interval.
Depending on the application that the wireless sensor networks designed for the designers should select the sensor specification (network size, sensor radius, transmission period and transmitter period) to give the network long life time.
Various readings of the parameters discussed above showed various results of power consumption. Changing these values directly changes the power consumption level, while designing the wireless sensor networks those parameters mentiond above should be considered at implementation time to give long network life.
We intend to develop energy monitoring hardware which will monitor the current flowing to the system and achieves accurate measurement.
BIBLIOGRAPHY:
Electrical and Computer Engineering, 393-422. [21] Bharathidasn, Archana and Ponduru, Vijay Anand Sai. “Sensor
Networks: an overview." 2003. Potentials, IEEE
Proceedings 22(2): 20- 23, May 2003,
Doi:10.1109/MP.2003.1197877 [1]
Demirkol, Ilker, Cem Ersoy and Fatih Alagoz. 2006. “MAC Protocols for wireless sensor networks: a survey." IEEE Communications Magazine 44(4): 115-121. [3]
GhoLamzadeh, Bahareh and Hooman Naboyati. 2008. “Concepts for Designing Low Power Wireless Sensor Networks” World Academy of Science and Technology 45. [7] Klues, Kelvin, Guoliang Xing, and Chenyang lu. “Towards a Unifield Radio Power Management Architecture for Wireless Sensor Networks.” Department of Computer Science and Engineering, Washington. [6]
Kaur, Palwinder and Anand Nayyar. 2013. “Conceptual representation and Survey of Dynamic Power Management (DPM) in Wireless Sensor Networks.” International Journal of Advanced Research in Computer Science and Software Engineering. 3(3). [22] Kawadia, Vikas and P.R. Kumar. 2003. “Power Control and
Clustering in Ad hoc Networks.” IEEE Department of Electrical and Computer Engineering and Coordinated Science Laboratory University of Illinois, IEEE INFOCOM, 2003. [8]
Liang, Wei, Haibin Yu, Peng Zeng, and Chang Che. 2006. “BESM: A Balancing Energy-Aware Sensor Management Protocol for Wireless Sensor Networks.” International Journal of Information Technology 12(4). [17]
Muhammad, A., Mazliham, M. S., and Shahrulniaz, M. 2009. “Power Management for Portable Devices by using Clutter based Information.” International Journal of
Computer Science and Networks Security 9(4): 237-244.
[9]
Niewiadomska-Szynkiewioz, Ewa, Piotr Kwasniewski, and Izabela Windyga. 2009. “Comparative Study of Wireless Sensor Networks Energy-Efficient Topologies and Power Save Protocols.” Journal of Telecommunication and Information Technology 3. [10]
O’Hare, G.M.P., David Marsh, Antonio Ruzzilli ,Richard Tynan. 2005. “Agents for Wireless Sensor Network Power Management.” Department of Computer Science, University College Dublin, Belfield Dublin 4, Ireland. [5]
Padmavathi, G. and Shanmugapriya, D. 2009. “A Survey of attacks, Security Mechanisms and Challenges in Wireless Sensor Networks.” International Journal of Computer Science and Information Security 4(1/2). [13] Ramesh, Siddharth. “A Protocol Architecture for Wireless
Sensor Networks.” School of computing University of Utah Salt Lake City, 1-10. [12]
Romer, Kay and Friedemann Mattern. 2004. “The Design Space of Wireless Sensor Networks.” Institute for Pervasive Computing ETH Zurich, NCCR-MICS Grant No.5005-67322, IEEE. [15]
Saraogi, Mayank. “Security in Wireless Sensor Networks” Department of Computer Science University of Tennessee, Knoxville. [11]
Sharma, Priyanka and M. K. Rai. 2013. “Review Paper on Cluster Based Caching Technique for Wireless Sensor Networks with multi-sink.” International Journal for Advance Research in Engineering and Technology 1(2). [23]
Department of Computer Science, University of Virginia, June 19, 2006. [2]
Yadav, Rajesh, Shirshu Varma, and N. Malaviya. 2009. “A Survey of MAC Protocols for Wireless Sensor Network.” UbiCC Journal 4(3). [19]
Ye, Fan, Gary Zhong, Songwu lu, Lixia Zhang Fyefan, Gzhong Slu. “Peas: A Robust Energy Conserving Protocol For Long Lived Sensor Networks.” UCLA Computer Science Department, Los Angeles. [16]
Yonng, Yao and Johannes Geherke. “The Cougar Approach to in-network Query Processing in Sensor Networks.” Department of Computer Science, Cornell University. [4]
Yu, Yang, Bhaskar Krishnamachari, and Viktor K. Prasananna “Issues in Designing Middleware for Wireless.” Department of EE-Systems University of Southern California Los Angeles, NSF grant number IIS-0330445, NSF ITR award number 032585. [14]