University of Windsor University of Windsor
Scholarship at UWindsor
Scholarship at UWindsor
Electronic Theses and Dissertations Theses, Dissertations, and Major Papers
1-1-2019
Forecast Model for Return Quality in Reverse Logistics Networks
Forecast Model for Return Quality in Reverse Logistics Networks
Aamira Mohammed Ashraf University of Windsor
Follow this and additional works at: https://scholar.uwindsor.ca/etd Part of the Engineering Commons
Recommended Citation Recommended Citation
Ashraf, Aamira Mohammed, "Forecast Model for Return Quality in Reverse Logistics Networks" (2019). Electronic Theses and Dissertations. 7757.
https://scholar.uwindsor.ca/etd/7757
This online database contains the full-text of PhD dissertations and Masters’ theses of University of Windsor students from 1954 forward. These documents are made available for personal study and research purposes only, in accordance with the Canadian Copyright Act and the Creative Commons license—CC BY-NC-ND (Attribution, Non-Commercial, No Derivative Works). Under this license, works must always be attributed to the copyright holder (original author), cannot be used for any commercial purposes, and may not be altered. Any other use would require the permission of the copyright holder. Students may inquire about withdrawing their dissertation and/or thesis from this database. For additional inquiries, please contact the repository administrator via email
Forecast Model for Return Quality in Reverse Logistics Networks
By
Aamirah Mohammed Ashraf
A Thesis
Submitted to the Faculty of Graduate Studies
through the Department of Mechanical, Automotive and Materials Engineering in Partial Fulfillment of the Requirements for
the Degree of Master of Applied Science at the University of Windsor
Windsor, Ontario, Canada
2019
Forecast Model for Return Quality in Reverse Logistics Networks
by
Aamirah Mohammed Ashraf
APPROVED BY:
______________________________________________ B. Chaouch
Odette School of Business
______________________________________________ G. Kabir
Department of Mechanical, Automotive and Materials Engineering
______________________________________________ W. Abdul-Kader, Advisor
Department of Mechanical, Automotive and Materials Engineering
iii
DECLARATION OF ORIGINALITY
I hereby certify that I am the sole author of this thesis and that no part of
this thesis has been published or submitted for publication.
I certify that, to the best of my knowledge, my thesis does not infringe
upon anyone’s copyright nor violate any proprietary rights and that any ideas,
techniques, quotations, or any other material from the work of other people
included in my thesis, published or otherwise, are fully acknowledged in
accordance with the standard referencing practices. Furthermore, to the extent that
I have included copyrighted material that surpasses the bounds of fair dealing
within the meaning of the Canada Copyright Act, I certify that I have obtained a
written permission from the copyright owner(s) to include such material(s) in my
thesis and have included copies of such copyright clearances to my appendix.
I declare that this is a true copy of my thesis, including any final revisions,
as approved by my thesis committee and the Graduate Studies office, and that this
thesis has not been submitted for a higher degree to any other University or
iv ABSTRACT
Giving rise to the field of reverse logistics are the governmental legislations
mandating used electronics take-backs and sustainable recovery, which often
burden manufacturers with the challenge of high implementation costs but no
guaranteed profitability. One way to tackle this challenge is to demystify the
multi-faceted uncertainties of product returns, namely timing, quantity and quality, that
currently inhibit optimal design and operations of reverse logistics networks
(RLN). In recognition of the limitations particularly caused by uncertainty of
returns’ quality in the strategic, tactical and operational planning of the RLN, this research seeks to develop a forecast model for the prediction of the returns’ quality
of future electronics returns. The proposed forecast model comprehensively
incorporates three major factors that affect quality decisions which are usage,
technological age and remaining economic value of expected product returns to
predict its quality grade. While technological age and economic trends can readily
be established, the main complexity lies in modeling of usage-dependent reliability
distribution of returned electronics. The novelty of the proposed forecast model
lies in deducing usage distributions through segmentation of the consumer base by
socioeconomic factors such as age, income, educational status and location. These
usage distributions are then used to estimate remaining useful life of returned
products and their components, the associated repair costs and the subsequent
profitability of reprocessing based on economic value in the market. This research
develops analytical models of expected return quality based on empirical usage
distributions and pricing trends. The analytical models are then applied in Monte
Carlo simulations to forecast expected returns’ quality from different urban and
v
DEDICATION
To Farhatulaain Jaleel Shaikh,
vi
ACKNOWLEDGEMENTS
I am sincerely grateful to my research supervisor, Dr. Walid Abdul-Kader, for
providing the anchorage I needed for not only guiding me with this thesis, but also
in forming a strong foundation in crucial research and interpersonal skills which
will always be useful. His patience and trust in my abilities served as a launch pad
for me to explore the subject and formulate my research topic at my own pace,
which in turn allowed me to grow and gain confidence as a researcher who can
truly make a contribution in the future.
I would like to thank Dr. Ben Chaouch and Dr. Golam Kabir for agreeing to be
part of my thesis committee. Their time and consideration in providing comments
and feedback on this thesis is invaluable.
To Dr. Walid Metwally and Dr. Victor Gillette from my undergraduate studies at
University of Sharjah, I am forever indebted for their belief in me, and the firm
support they provided in favor of my decision to pursue graduate studies in
Industrial Engineering.
Last but not the least, I am grateful to all my family and friends who supported me
in countless ways, and participated with me in this learning process through
engaging in constructive discussions, being openly critical of my ideas and
providing new perspectives. Most of all, they made this work possible for me by
vii
TABLE OF CONTENTS
DECLARATION OF ORIGINALITY ... iii
ABSTRACT ... iv
DEDICATION ...v
ACKNOWLEDGEMENTS ... vi
LIST OF TABLES ... xi
LIST OF FIGURES ... xii
LIST OF APPENDICES ... xiv
LIST OF ABBREVIATIONS/SYMBOLS ...xv
NOMENCLATURE ... xvii
CHAPTER 1 INTRODUCTION ...1
1.1 Birth of Sustainable Development ...1
1.1.1 Reverse Logistics: Challenges and Decisions ...3
1.1.2 Recovery Processes ...5
1.2 Motivation ...7
1.2.1 Return Quality Uncertainty ...8
1.2.2 Problem Description: Challenges under Quality Uncertainty ...10
1.2.3 Value of Prior Information on Return Quality ...14
1.3 Research Objective and Expected Contribution...16
1.4 Description of Methodology ...16
1.5 Scope and Limitations ...17
1.6 Industry Selection ...18
CHAPTER 2 LITERATURE REVIEW ...19
viii
2.2 Impact of Uncertainty of Return Quality (Economics/ Recovery Decisions) ...20
2.2.1 On Strategic Planning ...21
2.2.2 Procurement Decisions ...22
2.2.3 On Remanufacturing Profits ...25
2.3 Methods of Forecasting Return Quality in Present Literature ...28
2.3.1 Historical Sorting Data as Predictor of Quality ...28
2.3.2 Data-Driven Predictors of Return Quality ...28
2.3.3 Empirical Data Models ...30
2.4 Consumer Behaviour and Socioeconomic Factors...31
2.4.1 Reverse Logistics Context ...31
2.4.2 Smartphone Usage Behaviour Context ...34
2.4.4 Conclusion: Applicability of Socioeconomic factors in this study ...35
2.5 Thesis Contribution ...35
2.5.1 Gap in Literature ...35
2.5.2 Thesis Contribution ...36
2.6 Background on Methodology/Techniques used in the Model ...36
2.6.1 Aggregate Forecast Models ...36
2.6.2 Monte Carlo Simulations ...37
CHAPTER 3 MATHEMATICAL MODELS ...39
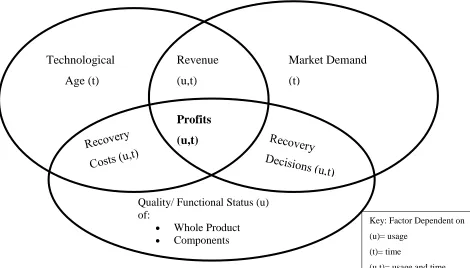
3.1 Model Description/Metrics for Recovery Decisions ...39
3.1.1 Schematic for Influencers of Recovery Decisions ...41
3.2 Socioeconomic Usage Model ...41
3.2.1 Factor Selection using Statistical Methods ...42
3.2.2 Usage Distribution Based on Age ...45
ix
3.2.4 Social Factors Selection: Conclusion ...53
3.2.5 Usage Model Formulation ...53
3.3 Usage-based Reliability Model ...54
3.3.1 Usage-based Product Reliability ...54
3.3.2 Usage-based Component Reliability ...56
3.3.3 Usage based Reliability Calculations for Batteries ...61
3.3.4 Usage-based Reliability Calculations for LCD ...62
3.4. Economic Factors ...63
3.4.1 Product Life Cycle ...63
3.4.2 Secondary Value for Product ...67
3.4.3 Secondary Value for Used Parts ...67
3.5 Equations for Pricing of New and Used OEM Components ...72
CHAPTER 4 SOLUTION METHODOLOGY ...74
4.1 Proposed Forecast Model: Description and Algorithm ...74
4.2 Profit-based Recovery Decisions ...75
4.3 Development of the Profit Equations ...76
4.3.1 Reusability Profit Function ...76
4.2.2 Remanufacturability: Profit Function ...78
4.2.3 Part Harvesting Profit Function ...81
4.2.4 Material Recycling Profit Function ...81
4.4 Summary ...82
CHAPTER 5 NUMERICAL EXAMPLE FOR FUTURE RESULTS ...83
5.1 Data Collection ...83
5.2 Scenario Development ...86
x
CHAPTER 6 RESULTS AND ANALYSIS...90
6.1 Graphical Results and Analysis...90
6.1.1 Comparison of Quality Ratios for Regions in Ontario based on Age ...90
6.1.2 Comparison of Quality Ratios by Income Distributions ...96
6.1.3 Comparison of Quality Ratios from Major Cities in Canada ...100
6.1.4 Comparison of Quality Ratios from Rural and Urban Areas in Ontario ...104
6.1.5 Comparison of Model Trends with Literature ...107
6.2 Sources of Error and Sensitivity Analysis...111
6.3 Applicability ...115
6.3.1 Applicability for OEMs, Retailers, Third Party, and Governmental Reprocessors ...115
6.3.2 Applicability to Product ...117
6.3.3 Adaptability of the Model for Future Trends ...117
CHAPTER 7 CONCLUSION AND FUTURE RESEARCH ...118
7.1 Conclusion ...118
7.2 Recommendations for Future Research ...119
REFERENCES ...120
APPENDICES ...128
Appendix A Device usage and ownership distributions by provincial ...128
Appendix B Copyright permission from CWTA ...134
Appendix C Copyright permission from Forum Research Inc. ...135
Appendix D Permission to use data through Dataverse Portal ...137
Appendix E Data and trends for New and Used Component Pricing ...138
xi
LIST OF TABLES
Table 1 Hypothesis testing results for association between socioeconomic factors
and daily usage ... 44
Table 2 Example of the data table format used to generate failure distribution ... 56
Table 3 Failure probabilities for different components ... 58
Table 4 Bernoulli probabilities for failure of components ... 60
Table 5 Equations for pricing of new spare components ... 72
Table 6 Equations for pricing of used parts from parts harvest ... 73
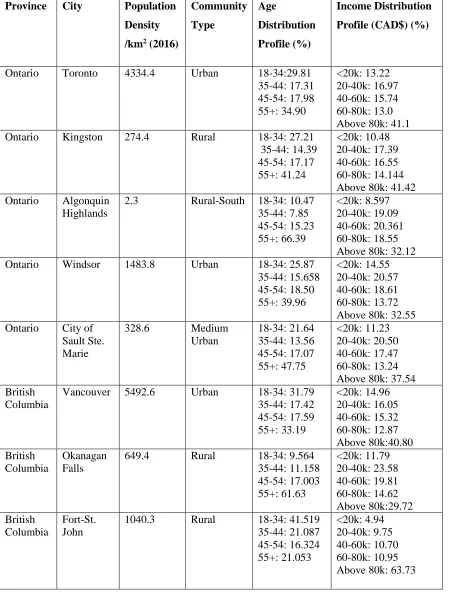
Table 7 Age and income distributions of cities for scenario development ... 84
Table 8 Distributions for consumer behavior based on socio-economic factors .... 85
Table 9 Scenario development ... 86
xii
LIST OF FIGURES
Figure 1 Quality-dependent costs of recovery. Adapted from Ostlin et al., (2009) 40
Figure 2 Interplay of factors that affect recovery decisions in RLN ... 41
Figure 3 Daily usage for Age 18-34 ... 46
Figure 4 Daily usage for Age 35-44 ... 46
Figure 5 Daily Usage for Age 45-54... 47
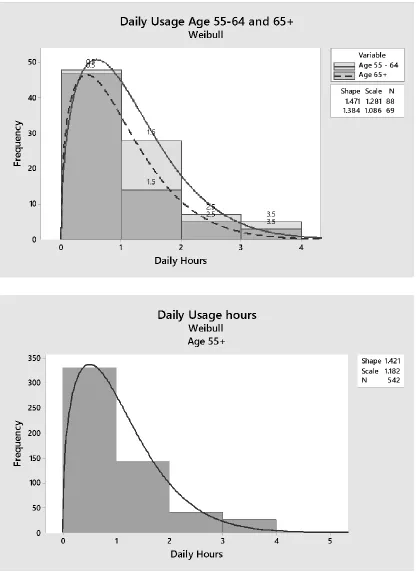
Figure 6 Daily usage for ages 55 and above ... 48
Figure 7 Length of usage for 18-34 ... 49
Figure 8 Length of usage for ages 35 to 54 ... 49
Figure 9 Length of usage for ages 55 and above ... 50
Figure 10 Daily Usage for income below $20K ... 50
Figure 11 Daily usage for income $20K to $40K ... 51
Figure 12 Daily Usage of income from $40K to $60K ... 51
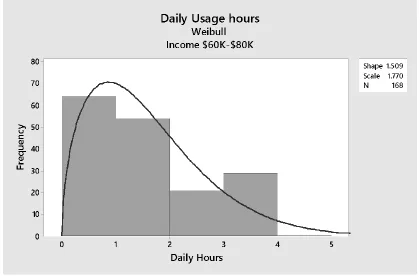
Figure 13 Daily usage for income $60K to $80K ... 52
Figure 14 Daily usage of income $80K and above ... 52
Figure 15 Example of reliability block diagram ... 55
Figure 16 Product survival function ... 56
Figure 17 Costs on product life cycle. Originally by Alting (1993), adapted from the version by Chouinard et al (2008)... 65
Figure 18 New and remanufactured product sales based on Aydin et al., (2015) and Ostlin et al., (2009) ... 66
Figure 19 Market value for refurbished phone from online pricing data ... 68
Figure 20 Market value for used LCDs from pricing data on e-commerce sites .... 70
Figure 21 Value trend for refurbished LCD part. Harvestcellular, Jones (2017) ... 72
Figure 22 MATLAB code for random sample generation... 88
Figure 23 Elapsed time for single simulation run ... 89
Figure 24 Quality ratios for Ontario Regions, T=1 ... 92
Figure 25 Quality ratios for Ontario regions, T=2 ... 93
Figure 26 Remanufacturing ratios for Ontario regions ... 93
Figure 27 Parts harvest ratios for Ontario regions ... 94
xiii
Figure 29 Income based remanufacture ratios ... 98
Figure 30 Income based parts harvest ratios ... 99
Figure 31 Quality ratios for major cities, T=1 ... 103
Figure 32 Quality ratios for major cities, T=2 ... 103
Figure 33 Quality ratios for major cities, T larger than 2 ... 104
Figure 34 Remanufacturing ratios for major cities ... 104
Figure 35 Returns from urban areas... 106
Figure 36 Returns from rural areas ... 107
Figure 37 Comparison of reused and remanufactured market value ... 109
Figure 38 Remanufacturing costs with respect to quality ... 110
Figure 39 Comparison between remanufacturing costs and profit ... 110
Figure 40 Histogram for Toronto with exponential LCD failure ... 112
Figure 41 Histogram for Toronto with empirical LCD failure ... 113
Figure 42 Toronto spectrum with exponential LCD failure ... 113
Figure 43 Toronto spectrum with empirical LCD failure distribution ... 114
Figure 44 Comparison of LCD survival probabilities from exponential and empirical distributions ... 114
xiv
LIST OF APPENDICES
Appendix A Device usage and ownership distributions by provincial ... 128
Appendix B Copyright permission from CWTA ... 134
Appendix C Copyright permission from Forum Research Inc. ... 135
Appendix D Permission to use data through Dataverse Portal ... 137
xv
LIST OF ABBREVIATIONS/SYMBOLS
Abbreviation Full-Form
CWTA Canadian Wireless and Telecommunications Association
EPR Extended Producer Responsibility
FSC Forward Supply Chain
RLN Reverse Logistics Network
WEEE Waste Electrical and Electronics Equipment
d Daily usage in hours
Component Pricei(t) Price of component i at time t needed for replacement
EP_PartH(u,t) Expected profits from part harvest from an individual end-of-use unit
EP_Recycle(u,t) Expected profits from recycling from an individual end-of-use unit
EP_Remanf(u,t) Expected profits from remanufacturing from an individual end-of-use unit
EP_Reuse(u,t) Expected profits from direct reuse of an individual end-of-use unit
np_product(t) New selling price of the product at time t
npi(t) Selling price of a new component i at time t
Pi Bernoulli trial, probability of failure of component
Pi(u) Probability of failure of component i after being used for u hours
Remanf Cost(u,t) Cost of remanufacturing an individual unit that has being used for u hours, at time t
Ri(u) Reliability of component i in used product after u hours
xvi
Si Bernoulli trial, probability of survival of component
Sp(t) Direst reuse selling price of product at time t
t Length of ownership
u Total usage of a product in hours
v Value of material recycling per unit
Xi(t) Selling price of used component i at time t
up_product(t) Market price for used version of the product at time t
upi(t) Selling price/salvage value of a used component i at time t
xvii
NOMENCLATURE
Consumer returns Products returned by customers to collection centers at end-of-use
Daily Usage Hours Number of hours an individual spends on their smartphone daily
End-of-life Products returned by customers after hardware failure or in decline stage
End-of-use Products returned by customers due to failure or new purchases, and before decline stage in product life-cycle
Forecast Quantitative estimation of a parameter trend in the future time periods
Length of Usage Number of months an individual uses their smartphone before next purchase
Parts harvest Extraction of used but functional parts from used products and selling them as-is
Quality grade Categorization of a used product as good, moderate or bad based on degradation
Recovery decision Selection of optimum recovery process from reuse, remanufacture, parts-harvest or recycle
Recycle Recovering materials from used product
Refurbish Replacing failed components in a used product to restore functionality
Remanufacture Replacing all components in a used product to reset its usage life to zero
Return quality Quality grade of a used product at the time when a customer returns it
Returned batch Consolidation of many units of consumer returns into one shipment or lot
xviii
Reverse logistics Process planning and all activities pertaining to the collection and sustainable disposition of used products
Technological age Time lapse after release of a product or model in the consumer market
Total usage hours Total accumulated usage or runtime of a device in hours at the time of return. It is a product of the daily usage hours and the length of usage
1 CHAPTER 1
INTRODUCTION
1.1 Birth of Sustainable Development
The digital revolution, also known as the third industrial evolution, of the late 1950’s set
the tone for the boom in the electronics industry which is still prevalent today. It began
with the gradual shift of analogue systems into digital ones, ushering in the rapid
adoption and proliferation of rapid computers for those who were able to afford it at that
time. As the demand for this technology grew, so did the manufacturing capabilities of
the industries which found themselves able to mass produce the digital products. With
mass production, came the decrease in prices which meant that more people could afford
it, further fueling the infiltration as well as the dependence of activities on these devices.
The opportunities for financial gain were too lucrative for businesses to ignore. Very
soon, the electronics industry began to seem like a race for rapid technological advances
and new product launches that furthered mass sales. At the height of financial euphoria,
no one was paying attention to the key enabler of such technological advances: the raw
materials, metals and semiconductors, that were being depleted into making these
electronics. All this mass production was only possible because of the readily available
natural resources. But what would happen when these ran out? This realization gave birth
to the concept of sustainable development.
Sustainable development means using the natural resources available to satisfy the needs
of this generation without diminishing the ability of the future generations to satisfy
theirs. In the electronics industry, the adoption of sustainable development is the
circulation of the resources from the old products that are no longer in use, to produce
new products so that the net mining of virgin natural sources is reduced and the resources
are conserved for the needs of the future generations. Under this concern, companies
have adopted multiple product recovery management options such as repairing
remanufacturing, or recycling (Ramani et al., 2010). In the words of Thierry et al.,
(1995), the term product recovery management means salvaging as much of the
economical (and ecological) value as sensibly possible in order to reduce the residual
2
In addition to conservation of non-renewable sources, concept of sustainable
development extends to environmentally friendly disposal of the electronics that
consumers no longer use, after they purchase a replacement. Electronics contain metals,
chemical batteries, silicon chips and other materials, which if sent to landfills, can release
toxic chemicals into the environment. This disposal issue is major concern today due to
the rapid rate at which consumers are disposing electronics today. In Canada alone,
nearly 40,000 mobile phone units are returned for recycling each day. This rapid
generation of electronics waste is a byproduct of the same factors that incite sales of new
purchases. In the smartphone industry for example, rapid technological advances, new
functionality and designs, and pressure from marketing and sales incite consumers to
replace their devices with new ones. At most times, their current devices are still
functional but, because of the factors mentioned earlier, the consumers feel entitled to a
new purchase. This has led to a shortened life cycle for smartphones. In the case for
Canada, the average life of a phone is 30.6 months which means consumers are likely to
upgrade their device in less than three years (Communcations Monitoring Report 2017).
In addition to the factors that affect consumer behavior, tactics such as
designed-for-obsolescence also ensure new sales for the manufacturers. Smartphones today are not
only less reliable in terms of functionality, but are also more difficult to repair. When a
device fails due to malfunction of one component such as the microphone or speaker,
consumers find it easier to buy a new device than repair it. The costs of repair have
increased due to the sleek designs and intricate assembly and disassembly of the current
generation of smartphones which require skilled labour (Ait-Kadi et al., 2012). This has
contributed to an increasing sales and an even larger and more frequent rate of mobile
phone returns reaching their end of use, thereby magnifying the disposal issue mentioned
earlier. The implementation of recovery options such as remanufacturing, repairing and
recycling can ensure the safe disposal of these electronics as well. In order to enforce
effective compliance of industries with the product recovery practices that facilitate
sustainable development, government regulatory bodies in various countries have
implemented strict legislations with regards to the recovery management of electronics
3
Under one such regulatory policy, the Extended Producer Responsibility (EPR)
legislation was put into practice in Canada in 2009. Under the EPR, all original
equipment manufacturers (OEMs) of electronics, electrical supplies, automobiles and
parts, or any other product which has toxic materials, are mandatorily responsible for
taking back their products from the consumers at the end of use, and performing product
recovery operations in an eco-friendly way. Under the government policy, the OEM is
usually responsible for funding any activities that are required to implement the EPR
legislation.
With the pressures of complying with EPR, OEMs were grappling with the difficult task
of not only collecting their end-of-use products from their country-wide consumer base,
but also with finding economic viability of the product recovery processes. This gave rise
to the entire field of product recovery management which has gained exponential interest
from both- industrial partners and academia. The common objective of this interest has
been in maximizing the efficiency and profitability of all activities that fall under EPR
compliance. Under the umbrella of sustainable development, these activities entailing
product-take back schemes and recovery operations are collectively addressed under the
term “reverse logistics”.
1.1.1 Reverse Logistics: Challenges and Decisions
Reverse logistics consists of a series of activities required to (1) collect used product from
a consumer and (2) reprocess the used product using the recovery decisions available, in
such a way so as to recover its leftover market value or dispose it in an environmentally
friendly manner. Based on this definition, the activities in reverse logistics can be split
into 2 groups: product take-back and product reprocessing (or recovery). Within these
two groups, there are many sub-activities that may overlap or directly affect the activities
of the other. In literature, the term reverse logistics has been used interchangeably with
reverse supply chains, where “logistics” is limited to the activities only pertaining to
group 1 which is product take-backs, collection and transportation and “reverse supply
chain” is comprehensive of all activities in both groups mentioned above.
A typical reverse logistics network (RLN) consists of collection centers which accept
4
customers buy reprocessed products. It may seem that this RLN structure is analogous to
the forward supply chain structure that consists of suppliers, manufacturers and demand
markets but there is far more dissimilarity between the two types of networks than meets
the eye. The stark differences in the two networks are adequately described by
(Fleischmann, Krikke, Dekker, & Flapper, 2000) who addresses reverse and forward
chains as “converging” and “divergent” networks respectively.
The first difference arises from the supplier sources which, in the reverse supply chain
context, are the consumers themselves. The consumers are located in large area spread
out across cities and countries. In fact, in FSC, manufacturers actually try to expand their
installed consumer base by gaining market share in as large an area as possible. However,
during the collection of used product, the burden of collecting products from the large
consumer base poses a logistics challenge because it requires large amounts of resources.
The fact that the suppliers are located in so many places and the stream of goods is
towards fewer reprocessing facilities is why Fleischmann (2001) addresses reverse supply
chains as “convergent” networks. The issue of optimizing collection networks, schemes,
routing and many other issues are addressed in a large body of literary work (Aras et al.,
2008; Min & Ko, 2006).
The second, and more complex part of reverse logistics is the profit maximization of the
recovery processes. There are generally three levels of recovery that are currently in
practice: direct reuse, refurbish or remanufacturing, and materials recycling. In order to
recover the costs of the product collections and sustain further profits from product
recovery, companies must exercise acumen in the design and allocation of their
reprocessing facilities.
It goes without saying that recovery business manufacturers and remanufacturers are not
only driven by environmental regulations, but mainly motivated by potential profits from
product or component recovery (Zikopoulos and Tagaras, 2007). Two critical issues that
heavily impact maximizing profits from recovery are: designing of the reprocessing
network, and selecting the optimal configuration of recovery strategies. Selection of
optimal configuration means assigning the most economically viable recovery strategy
5
This process of assigning an appropriate recovery decision is complex, and varies from
one unit of product to the other. To understand this complexity, it is first important to
explain the three recovery processes.
1.1.2 Recovery Processes
Reuse: The first option, reuse, means to directly retail the returned product after some
cleaning and repackaging. According to Geyer and Blass (2010), direct reuse of mobile
electronics generates the highest profit margins. This is because it doesn’t require any
reprocessing operations. Meng et al., 2017 also claim that reusing is also the most
environmentally-friendly option. However, for a returned product to be eligible for direct
reuse, it must satisfy two conditions (1) It should be completely functional with very little
cosmetic wear, and (2) there must be a demand for that model in the market.
For the purpose of this study, the term reusability is defined as the probability that a
product that has been returned by the customer is found to be excellent functional status
with only minor cosmetic wear such that it can be directly resold without any repairs. The
product may require some cleaning and repackaging but it does not require any
replacement of components and has not water damage.
Refurbishing/Remanufacturing: The second recovery option is remanufacturing.
Compared to recycling, this solution requires lesser resources and energy and is
increasingly gaining attention because of its value-added potential and
environment-friendly features (Guide and Wassenhove, 2009; Deng et al., 2017; Ji et al., 2017). As
one link of reverse logistics, remanufacturing is less dependent on virgin materials and
more profitable compared with manufacturing. In remanufacturing of cellphones, the
failed components, or the ones that do not meet the industry standards are replaced with
new components. Thus, remanufacturing incurs the costs of disassembly, new
components and the subsequent reassembly of the product, which are not applicable to
direct reuse. However, the selling price of a remanufactured or refurbished product is
usually more than the price of a reused product because the product has been reset to
manufacturer’s quality. In such a case, the increase in revenue is generally large enough
to offset the cost of remanufacturing. Having said that, not all returned products are
6
the quality of the returned product and the current market trends before making a decision
of whether to remanufacture or not.
Part Harvesting: Sometimes, the activity of removing used components from a used
device and selling them is more profitable than the process of remanufacturing. If the
costs of remanufacturing are too high due to bad return quality, then part harvesting can
be considered as a recovery option.
Recycling: If the quality of the returned product is so bad that it requires extensive
repairs, or, if the market value of the product has reached a point where the costs of
remanufacturing outweigh the profits, then the appropriate recovery decision for it will be
materials recycling. According to Geyer and Blass (2010), recycling is the least profitable
recovery decision. However, it is an enabler for natural resource conservation and more
environmentally friendly than mining of new materials. Therefore, even though an OEM
may not find recycling to be compatible with their economic objectives, they must adhere
to it due to environmental concerns.
When would recycling be feasible?
Sometimes the product returns can be of such low quality that the cost of repair or
remanufacturing is too high and cannot be matched with the possible value on a
secondary market (Ostlin et al., 2009).The recovery option that is slightly more
favorable than recycling is directly selling used components by harvesting them from
returned devices. Usually this is a low cost option that generates good profits as it
requires no repairs, replacement with new parts or even reassembly (as is needed in
remanufacturing). However, sometimes the revenue or demand of the used components
may not justify the disassembly costs needed for extraction of the components. In such a
case, the device would be assigned to recycling instead.
As seen from the above discussion, the recovery decision of a product is highly
dependent on two factors: the return quality, and the market value of the product. The
dynamics of these two factors inject high level of complexity in the product recovery
process and make the planning and management of reverse logistics highly challenging
7
The returns come with different qualities. Uncertainty in quality can impact various
aspects of the reverse logistics process (Pochampally et al., 2008). When the quality of
returned products is incorporated in the decision process, it is possible to develop more
intelligent remanufacturing and disposal policies.
1.2 Motivation
The operational viability of any supply chain network depends on how well it was
designed to sustain surplus in a multi-period setting. A supply chain surplus is defined as
the net profit from all the supply chain activities which include planning, manufacturing,
distributing, marketing and logistics (Chopra & Meindl, 2006) In reverse logistics the
complexity of designing a network that is robust in the face of multi-dimensional
uncertainties is challenging. The main uncertainties that hinder RLN planning are related
to the volume, quality and timing of consumer product returns. These uncertainties arise
from the randomness of consumer behaviour with regards to their usage patterns, their
willingness to return the used product and at what point of time they decide to return.
Several works in literature have attempted to quantify the uncertainties of return timing
and return volumes using a wide range of optimization and simulation tools including
stochastic programming, robust optimization, fuzzy techniques and forecasting methods.
The most effective way of dispelling the impact of uncertainties on network design is
through forecasting methods. Several works in literature attempt to forecast the timing of
consumer returns such as Krikke et al., (1999), Kelle and Silver (1989) and Toktay
(2001). Similarly, there have been several literary publications that effectively forecast
the volume of consumer returns that can be expected to enter the reverse supply chain
stream in a multi-period setting across a variety of product types (Marx-Gomez (2002),
Hanafi (2008), Kannan et al., (2014), Temur and Bolat (2014), Ugurlu (2012)). A recent
thesis by Pillai (2017) also addresses forecast of remanufacturing cores in a time-series
analysis. Evidently, there is a plethora of substantial research dated as early as 1989 that
can be used practically to optimize reverse logistics network decisions against risks that
accompany the uncertainties in return timing and return quantities. Unfortunately, there is
no presence of such a body of research on forecasting return quality although this factor
8
Return quality is basically the quality grade of a product when it is returned by the
consumer post-use. The random and individualistic consumer usage patterns induce a
large variance in the return quality. The effect of return quality on the structure and
operations of a reverse supply chain have been elaborated in many publications (Guide et
al., (2006), Zikopoulos and Tagaras (2007), Ferguson et al., (2009), Ondemir and Gupta
(2014), Liang et al., (2014), Meng et al., (2017)).While the importance of the effect of
return quality has been well established, there is a lack of literature pertaining to
forecasting of return quality of highly volatile and short-lived electronics products such
as smartphones. Considering the vast tonnage of wastes that smartphones create all over
the world, it is important to dedicate research that optimizes their reprocessing for faster
and more efficient of product and materials recovery. This research is motivated by the
need to demystify the volatility of return quality of end-of-use mobile electronics in order
to facilitate the managerial decisions in the design and operations of their reverse supply
chain.
The sections that follow elaborate on what return quality means in the context of reverse
logistics, what areas of management are impacted by its volatility, existing gaps in
literature and finally, the objective this research attempts to fulfill.
1.2.1 Return Quality Uncertainty
Exploitation of the remaining useful value in consumer returns has been identified as a
promising source of revenues. In reverse logistics and product recovery, the term “useful value” is a transient quantity that is subjective to the product type, industry and the
concerned stakeholder (OEM, third-party remanufacturer, government or consumer). In
their book, Pochampally et al., (2008) mention that the definition of “value” must
encompass all aspects of environmental, social and economic opportunities. The
remaining value of any product will directly depend of the cost of repairs that it needs,
and the potential profit it will generate when resold in the market. There is an inherent
nexus between the cost of repairs and the quality of the used product when it is returned
by the customer. While this correlation has been acknowledged in many literary works,
9
Return quality, in the context of RL, is defined as the condition of a product unit when it
is returned by a consumer at the end of its use. Based on the assessment of the quality of
the product, it is assigned to an appropriate recovery decision. Authors in RL literature
refer to return quality using various terms such as: input quality in remanufacturing
(Denizel et al., 2004), condition of used product (Galberth and Blackburn, 2010),
heterogeneity of input (Ferguson et al., 2009), or core quality (Teunter and Flapper
2011). Return quality ratios, or simply quality ratios refers to the fraction of the total
volume of returns that can be subjected to one of the recovery processes: direct reuse,
remanufacturing or recycling. In most of the literature present, it is assumed that this
quality ratio is deterministic (Zikopoulos and Tagaras, 2015). However, in reality the
quality of returns is stochastic and random (Aras et al., 2004).
The uncertainty in these quality ratios arises from the randomness that characterizes
consumer behaviour (Ferguson et al., 2009). In the case of electronics, consumer
purchasing frequency and daily usage behaviour largely depends on their income, social
status and age. There is a nexus between these usage patterns and the product wear at the
end of its use. Moreover, Zikopoulos and Tagaras (2015) mention that, in addition to
these socioeconomic end-user characteristics, factors such as an individual’s motivation
for returning product and the characteristics of the location of use (temperature and
humidity) also affect the return quality of the product. Thus, it is established that return
quality of each unit of returned product varies according to its length and intensity of
usage and the environment in which it was used. This creates a huge uncertainty in return
quality which greatly impacts profitability and decision making in reverse logistics on
strategic, tactical and operational level of reverse supply chain management.
A successful supply chain network is one that can sustain favorable surplus in a
multi-period setting, and ensure profit margins withstanding all the various possible
uncertainties. In the field of reverse supply chains, this is no easy feat due to the
uncertainties involved concerning timing, quantity and quality of returns. The variations
in the return quality of products make it difficult to plan an optimal network. This inhibits
10
offset the profitability of the recovery process, as explained by Denizel et al., (2010) in
their case study on the IBM remanufacturing facility.
This research is highly motivated by the roadblocks in reverse supply chain management
that are caused by lack of return quality forecasting. The next section elucidates on these
hindrances.
1.2.2 Problem Description: Challenges under Quality Uncertainty
This section describes the problems that arise in strategic and tactical management of
reverse supply chain due to the uncertainty of return quality.
Strategic Planning
Designing supply chain networks is an exhaustive process that requires extensive
research across a range of diverse areas from consumer behaviour and demand to location
selection and in some case, even legislative measures.
A central issue in strategic phase of SCM is the configuration of network design. The
facilities and equipment required can incur large fixed costs which can only be justified if
the network layout is optimized for profitability over long periods. The major aspects of
network design are:
1. Location decisions for facilities
2. Number of facilities
3. Capacity allocation
A major determinant of the optimal number and capacity of the facilities is the forecasted
demand for manufactured goods (Lambert, Riopel and Abdul-Kader, 2011). In forward
logistics, demand forecasting is accepted as the most fundamental step in strategic
planning. The decision to invest in facilities and the manufacturing equipment is
dependent on this demand. In fact, 80% of a product value comes from its design stage
which includes the fixed cost of its supply chain network (Pochampally et al., 2008).
Forward chains have the advantage of robust forecast models that accurately predict
demand trends, allowing economically justified investment in equipment and facilities
11
chains. Due to the unknown quality distribution, ‘traditional expectation-based
optimization” which are generally adequate for forward supply chains, become
completely incompetent in reverse supply chain planning (Jiang, Netessine, and Savin,
2011).
In the reverse supply chain, the conventional “demand for volume of goods” is replaced by “volume of returned goods”. The manufacturing equipment is replaced by more
specialized reprocessing equipment essential for recovery processes such as machines for
automatic disassembly, remanufacturing or cleaning of returned products. While forward
chains need only one type of equipment which performs manufacturing and assembly,
reverse supply chains need multiple types of specialized equipment based on the recovery
methods. The returned products exhibit varying levels of wear and tear and thus, require
tailored recovery operations. This is because consumer behaviour of electronics is not
consistent. For e.g. a user who might be prone to overheating the device due to excessive
usage, will return their phone with a much lower grade quality than another user who
only uses the same type of device for basic functions. This gives rise to randomness in
the quality of the returned products collected.
It is usually unknown what volumes of the different quality grades are going to enter the
reverse chain. As Ait-Kadi et al., (2012) mention, the efforts and resources needed to
justify and support this type of uncertain returns are much more significant as compared
to returns that would just fit one type of reprocessing option. To this end, investment in
the rather expensive equipment required for reprocessing carries high levels of risk. It is
necessary to take into account what type of specialized reprocessing equipment and what
capacity is required for a viable network design. Similar to forward chains where
decision makers have forecasts of demands to assist them in deciding the number and
capacity of manufacturing plants, the decision makers in reverse supply chains are also in
need of forecasts of return volumes pertaining to variant quality grades. This information
will enable them to generate higher profit margins by optimizing their fixed costs.
The above problem is acknowledged by Pochampally et al., (2008) in their book, where
they mention that in current network design, some predefined configurations of what
12
“possible processing options” as one of the network constraints. They mention literature
works that suggest directing products towards processing options by assuming
proportions or fixed amounts for each recovery process. Other approaches can also
configure a lower proportion of products to be cleanly disposed of whereas the remaining
products are sent for remanufacturing. A higher proportion of repair, remanufacturing,
updating or upgrading and a smaller portion for recycling is used for designing a network
with a desired level of flexibility. They say that these “proportions” are decided so that
they take into account technical, commercial, and environmental constraints. Such a
practice leads to an overly conservative network design, which has a lot of scope for
optimization with accurate quality ratio forecasts so that “predefined recovery configurations” do not have to be assumed. Moreover, this existing practice does not
necessarily sustain profitability in multi-periods.
Tactical Planning
On a tactical and operational level, there are two major issues that can be addressed
through the forecast model proposed in this research. These are deciding on used product
acquisition policy, and planning the production lines for the recovery options that are
available.
Most reprocessing facilities purchase batches of returned products in fixed lots from
informal or formal collectors. Usually these batches are aggregates of consumer returns
across multiple collection points in an area and then consolidated into one larger batch for
the collector. It is most often unknown what the functional state of the products in any
given batch are. While some phones may be good enough for direct reuse after general
cleaning, others might be completely malfunctioned and need costly repairs. Denizel,
Ferguson and Souza (2010) identify this issue that, since a returned shipment vary in the
quality of the cores, some cores will need more capacity to restore the unit to standard
quality than others. These batches, regardless of how many bad phones are inside them,
are quoted at a fixed selling price to the reprocessing facilities. While the batches are
randomly tested and labeled with an expected quality ratio based on expertise, their
precision cannot be reported. This concept of testing a sample of a returned batch, and the
13
Zikopoulos (2013). Earlier than that, Nikolaidis (2009) had developed a model to find the
optimal acquisition and remanufacturing quantities under the effect of sampling
inspection of the returned batches. Sometimes, a batch can have many malfunctioned
devices or models that are aged and no longer have any market value. In such cases, it
does not justify for the reprocessor to spend in their repairs as they do not generate any
profitability from future sales. However, a reprocessor cannot demand a device-by-device
test of each unit in a batch before purchasing, nor can they return a batch if they find it to
be unprofitable. Thus the cost incurred of buying such a low quality batch is often a hefty
financial loss for the reprocessor. The impact that overestimation of the quality of the
returned batch on the profitability of remanufacturing is acknowledged by Van
Wassenhove and Zikopoulos (2010). It would be financially beneficial for reprocessing
facilities if they could get a quote for a batch based on an accurate estimation of the
quality ratio of each batch rather than an estimate applied across all batches, a fact that is
asserted by Denizel, Ferguson and Souza (2010) who mention that the acquisition price
of used cores should be lower for lower quality grades. When the quote is based on the
quality ratio, they know precisely what to expect from the box and can then decide if the
cost of the box is justified against the potential profit it will generate for them. Since
collections are aggregated into batches by region, this research avails the opportunity to
estimate quality ratio of batches by accounting for regional differences through
socioeconomic factors (See 3.2 Socioeconomic Usage Model).
The first four steps for products that enter the value recovery stream are: gatekeeping,
collection, inspection and sorting (Lambert, Riopel and Abdul-Kader, 2011). When a
batch of returned products arrives at a reprocessing facility from collectors, it is standard
inspection to perform functional tests on each unit in the batch in order to determine
which reprocessing option is most feasible, and then sends them to the appropriate
reprocessing department. This process is a fail-proof method of ensuring that each device
generates maximum profit. However, this real-time method of incrementing the lot size
that arrives at the different reprocessing production lines can induce extreme
inefficiencies and variabilities in the production planning. Having uncertain knowledge
of how much inflow of raw material (in this case, returned products) to expect for their
14
Moreover, variations in production input can reduce overall equipment efficiency of the
line by causing increasing change over frequency and suboptimal utilization of the line
capacity. Guide and Srivastava (1997) list unknown conditions of recovered parts and
probabilistic recovery rate of parts among other factors that add complexity to inventory
control and production planning. This is a contingency due to the random quality ratios of
the batches fed into the line. For e.g. a remanufacturing line has a capacity of x units per
day. A reprocessor purchases a batch of x units with an estimated quality ratio of 0.6 and
another of 0.3 to make a day’s production. However, after sorting the devices from the
batches, it is found that the quality ratios reported were significantly different. Then, in
this case, the remanufacturing line capacity will not be optimized. If the quality ratios are
lower, then the line will have excess capacity. If the quality ratios are found to be higher,
then the reprocessor will incur an opportunity cost and will be at a loss. This loss is due
to the fact that, for each day the remanufacturable units spend in the facility, they lose
time value. Pochampally et al., (2008) name this as “loss of sale” cost. Since the
secondary market value of electronics is highly sensitive to time, it is not profitable for
the remanufacturer to incur a profit loss by decaying good quality cores at its facility.
This dilemma is acknowledged by Ait-Kadi et al., (2012) where they state that companies
must strike a balance between the acquisition price of the returned product-whether that
is batch purchasing from collectors or incentives paid to the customers, and the resale
value. Inherently, to gauge the resale value, they must also consider the various
reprocessing paths that the recovered product may take (Pochampally et al., 2008). While
the above mentioned example is for a remanufacturing line, the same concept applies to
repairing or recycling equipment and lines.
To conclude from the above discussion, equipping reprocessing facilities with accurate
forecasts of the quality ratios empowers them to configure their batch purchases, plan
their production lines efficiently and sustain favorable economic profits.
1.2.3 Value of Prior Information on Return Quality
From the above discussion it is clear that the return quality affects not only strategic
decisions of network design, but also affects the tactical and operational decisions. From
15
production schedules, all of these activities are affected by the quality of the returned
products. In order to enable effective managerial decisions at the correct time, it is
important to have knowledge of the return quality forecasts based on the customer zones
for a multi-period setting.
What positive impact can a return quality forecast have on strategic planning?
A forecast of return quality will empower the decision makers in reverse supply chains
with the expected volume of returns that will be of good, moderate or bad quality in any
given time period. This will allow them to make the following strategic decisions:
1. Optimal location for reprocessing facilities
2. Optimal number and capacity of reprocessing facilities based on the expected
volume of returns in multi-period network
3. Optimal supplier zones: In the case of RLN, the end-users are the suppliers
(Fleischmann, 2001). Since consumers exhibit variability in device usage, they
produce end products of different quality, which can be attributed as “suppliers
with different return quality”. It is possible to assign nominal quality ratios to
returned batches based on area of collection if a pattern between these two
variables in established. some consumer areas will generate high quality of used
products than others e.g. urban vs. rural. One way to correlate return quality by
region is to characterize returned products based on the demographic profile of
that region. This study attempts to achieve this through the proposed
socioeconomic forecast model.
By optimizing the fixed costs of the RLN, forecasts of return quality can greatly increase
the reverse supply chain surplus.
What positive impact can a return quality forecast have on tactical planning?
Confidence in the quality ratio of returned batches through forecasts will enable more
profit-based acquisition policies. Based on current market trends and the remanufacturers
own production capacities, they will be able to configure how many batches to acquire, of
16
will allow them to efficiently plan their production schedules, comply with delivery times
(due to better throughput management) and enhance their overall line efficiency. All this
cannot be planned if the information of quality ratios is made available to the planners
only after a batch enters the facility’s doors.
1.3 Research Objective and Expected Contribution
As seen from the above discussion, the random nature of the return quality of electronics
can significantly reduce the surplus of sustainable supply chains. It is critical to
accurately quantify what quality ratios to expect from returned products a priori to the
strategical planning stage so that decision makers can design robust networks that can
successfully generate financial profits in a multi-period setting. As a solution to this
problem this research proposes a forecast model to predict the quality ratios of returned
electronics. The main objective of this research is to:
1. Create smartphones usage distributions by categorizing consumers by
socioeconomic factors namely, age income, education and region.
2. Use the categorization of products by socioeconomic factors to formulate
probability distributions for the quality of end-of-use consumer returns
3. Combine these formulated return quality distributions with economic trends to
formulate a forecast model that will predict quality ratios of the future returns that
will be subjected to direct reuse, remanufacturing or recycling.
1.4 Description of Methodology
The first step will be to use available data on smartphone usage characterized by age,
income, gender, education and region to identify which of these factors play a significant
part in determining smartphone usage and purchase behaviour. The independent variable
will be the socioeconomic factors and the dependent variables will be (1) number of
usage hours per day and (2) length of ownership of one smartphone device. Next step will
be to identify the statistical distributions that govern the relationship between the input
factors and the outputs.
After the usage distributions have been established, the usage model will be used to
end-of-17
use. The usage distributions will be used in reliability calculations to determine the
probability distribution of returned products that will survive at the time of their return.
This survival probability will also be calculated for the crucial components of the device
based on component selection.
In the formulation of the forecast model, the survival distributions will be used in
conjunction with economic depreciation trends of mobile devices and their components
to predict the most suitable recovery option. To this end, the expected cost of repairs
needed will be calculated based on the survival probabilities, and the expected revenues
will be calculated based on the market price of the product in the current period. Then the
difference of costs and revenue will be used to calculate the expected profit for each
recovery option. The recovery option with the highest profit will be assigned to the used
product.
1.5 Scope and Limitations
This section lists the assumptions and limitations of the proposed forecast model.
Assumptions
1. The phones were not stored for any period of time after their end of use.
2. The year of release of the phone coincides with the start of the usage time
3. One phone unit has not been reused by more than one age group.
4. The usage intensity of the phone (such as the type of application: games, graphic
content versus office usage) have not been taken into consideration.
5. Probability of water damage and physical fall are the same across all age groups
6. No lead time for reprocessing is taken into account. It is assumed that the time
value of the product at the time of return stays the same while it’s being
reprocessed
7. At t=0, the quality of all phones is uniform with usage hours=0.
Limitations
This research provides an aggregate forecast model to predict future quality of returns.
18
phases. The model does not eliminate the need for the gatekeeping and inspection steps
that are characteristic of the reverse logistic process and are instrumental in assigning the
appropriate recovery decision to each device on an disaggregate level.
1.6 Industry Selection
The electronics waste generated from smartphones all over the world is a growing issue.
The catalysts to this problem are the growing sales and the shortening life-cycle of
smartphone devices. In 2017 alone, 1.5 billion units of mobile phones were sold
worldwide, generating nearly US $500 billion in revenue. In North America, the
smartphone penetration has peaked, and most of the smartphone sales are from
replacement purchases i.e. consumers replacing their existing smartphone with a new
one. Technological advancements, marketing activities, hardware obsolescence and the
adoption of latest technology as a status symbol are all contributors to what spurs
consumers to in the race to acquire the latest phone models, even when their old ones are
perfectly functional. This phenomenon has led to shortening of the life-cycle of mobile
phones. In Canada, the average length of ownership is about 30.6 months (CWTA, 2016).
This means that the more sales, the more electronic waste accumulates. Thus, even
though mobile phones are small, light in weight and use lesser materials than bigger
electronics, they are contributing tonnes to the growing problem of WEEE management
by virtue of their short life-cycles.
In recognition of the criticality of managing wastes from smartphones, this study has
chosen the smartphone industry for the numerical application of the proposed forecast
19 CHAPTER 2
LITERATURE REVIEW
Following the theme of return quality in reverse logistics, this section attempts to compile
existing literature that establishes the inevitable existence of this uncertainty in RL. It
also discusses relevant work which brings to light the various management issues which
are impacted by the uncertainty in return quality, and how it is currently being addressed
through qualitative methods that rely on human expertise and data-driven methods that
employ electronic data logging systems. Lastly, it provides an overture of the forecasting
method and the Monte Carlo simulation technique that will be used in this study.
2.1 Quality Grades and Recovery Decisions
Most of the work in literature classifies the quality of returned product in three discrete
groups: good, moderate and bad. Literature in which quality grades are treated as discrete
variables include Teunter and Flapper (2011). However, in some literature, quality grade
is also treated as a continuous variable (Galberth and Blackburn, 2010). Regardless of
whether return quality is modeled as a discrete or continuous variable, it is almost always
assumed to be deterministic.
In Zikopoulos and Tagaras (2015), the remanufacturability (a measure of quality) of a
returned product is modeled as a continuous variable but with a known distribution.
Regardless of the type of variable, the quality ratios have almost always been treated as
deterministic parameters.
Golany et al., (2001) assume a single quality grade for all returns, while Robotis et al.,
(2005) assume two distinct return qualities, each sourced from a separate supplier with no
correlation. Zikopoulus and Tagaras also assume two quality grades: refurbishable and
non-refurbishable. However, they upgrade the model presented by Robotis et al., (2005)
by assuming that there is correlation between the stochastic distribution quality of returns
collected from each of the two separate suppliers.
Aras et al., (2004) also use two quality grades: high quality and low quality in their
Markov Chain model to optimize inventory management of hybrid manufacturing
20
or low quality is already known. Similarly, Galberth and Blackburn (2010) considered the
uncertainty in the quality condition of the returns and assumed that the quality grade
followed a binomial distribution, the parameters of which are assumed to be known.
Ferguson et al., (2009) use three quality grades: for-scrap, for-part-harvest and
fit-for-remanufacturing in their case study on an electronics company for evaluating the
effect of quality grading before remanufacturing operations.
In all the studies mentioned above, it is clear that the quality of the product has been used
as an indicator to assign it to the appropriate recovery decision. However, none of the
studies above mention the data source that forms the basis of their assumptions of
choosing a distribution to model the quality ratios. All the studies mention that their
stochastic modeling of the return quality is based off of expert opinion or historical data.
While both of these may be a reliable source in electronics with long life cycles such as
household appliances, they cannot be used as reliable sources with fast moving consumer
electronics with short life cycle. This is because the trends pertaining to usage and returns
of these electronics is constantly changing, which automatically reflects in the quality
distribution of these products when they are returned at the post-consumer stage.
2.2 Impact of Uncertainty of Return Quality (Economics/ Recovery Decisions)
There is a large body of work that emphasizes the impact of uncertainty of return quality
on various aspects of reverse logistics and its profitability (Zikopoukos and Tagaras
2007; Aras et al., 2004; Teunter and Flapper 2011). A recent review by Ondemir and
Gupta (2014) showed that quality was incorporated into a wide range of decision models
for reverse logistics, which further proves that return quality is an important parameter in
reverse supply chain planning.
This section discusses relevant literature on how return quality can impact three main
areas in RL: network configuration, procurement decisions and remanufacturing profits.
The reason these three areas have been specifically chosen is because these are the areas
where profitability can largely be enhanced with prior information on the quality ratios of
future returns by means of forecasts. However, due to lack of forecasting models of
21
distributions and scenario analysis for their optimization models (Aras et al., (2004);
Zikopoulos & Tagaras (2007); Panagiotidou et al., (2017)).
2.2.1 On Strategic Planning
There is ample research which shows that the uncertainty of the return quality can have
impact on network design, especially in a multi-period setting. In a reverse supply chain,
network decisions include location, number and capacity of collection and disassembly
centers, remanufacturing and recycling facilities. One may ask, how can return quality
affect these decisions? The answer to this is analogous to the planning of manufacturing
centers in the forward supply chain where it is common practice to study demand
forecasts of different zones before selecting facility locations and deciding their capacity.
Similar to that, in reverse supply chain it is important to forecast how many returned
products will be arriving at the facility, the zones where they will be arriving from, and
what kind of reprocessing capacity will be required. The decision-making with regards to
reprocessing capacity is where the complexity of return quality has a large influence.
Reprocessing capacity encompasses decisions such as capacity to repair, disassemble,
remanufacture and parts inventory. In order to exploit economies of scale in a
multi-period setting, the remanufacturers must have enough knowledge of what kind of
processing the future returns will need so that they can adjust their investments in their
reprocessing production lines. By providing them with forecasts of return qualities, they
will have information on what fractions of the returns will be expected to undergo repairs
or what fraction will need refurbishing and what fraction of the arrival will only be fit for
recycling. With this knowledge, they can optimize on their investments of facilities and
equipment capacities as well. Some relevant literature with results that explore the effect
of uncertainty in quality on strategic planning of the reverse supply chain are discussed in
this section.
Zikopoulus and Tagaras (2007) argue that a single-period problem is sufficient in the
strategic planning of the RLN. However, this is inadequate for OEMs where the lifecycle
of the product may be too short for example, cellphones. In other electronics where a
single period can be of ten years or more, this model would be more suitable. In another