LEVY, REBECCA ABAGAIL. Effectiveness of a Modified Approach to Small-group SRSD for Second Grade Students with Writing Difficulties. (Under the direction of Dr. John
Begeny).
Writing is an important skill for students to master before reaching adulthood. However, a large percentage of US students in elementary, middle, and high school are not proficient writers. Additionally, with today’s economic climate, US schools and teachers are increasingly challenged to be more efficient with time and resources. Thus, research is needed to determine the effectiveness of promising writing intervention programs,
by
Rebecca Abagail Levy
A dissertation submitted to the Graduate Faculty of North Carolina State University
in partial fulfillment of the requirements for the degree of
Doctor of Philosophy
Psychology
Raleigh, North Carolina 2018
APPROVED BY:
_______________________________ _______________________________
Dr. John Begeny Dr. Scott Stage
Committee Chair
_______________________________ _______________________________
DEDICATION
BIOGRAPHY
Rebecca Abagail Levy was born on November 18, 1990 in Mineola, NY. She
graduated from Sanford H. Calhoun High School in 2008, and pursued a Bachelor of Arts in Psychology from Syracuse University. She graduated from Syracuse in 2012. Following graduation, Rebecca moved to Raleigh, North Carolina to commence her graduate training in School Psychology at North Carolina State University. She earned her Master of Science in Psychology from North Carolina State University in May 2015. After earning her master’s degree, Rebecca began working on her dissertation while completing doctoral-level courses, gaining hands-on training experiences in the mental health field, and teaching undergraduate Abnormal Psychology at North Carolina State University. Rebecca is currently completing her APPIC pre-doctoral internship at Guilford County Schools in Greensboro, NC, where she
TABLE OF CONTENTS
LIST OF TABLES ... vi!
LIST OF FIGURES ... viii!
Effectiveness of a Modified Approach to Small-group SRSD for Second Grade Students with Writing Difficulties ... 1!
Theoretical Underpinnings of the Writing Process ... 2!
Self-Regulated Strategy Development (SRSD) ... 3!
Small-group Interventions within the Response-to-Intervention Framework ... 5!
Usable Interventions ... 8!
Purpose of Study ... 8!
Method...10!
Research Design ... 10!
Participants ... 10!
Setting ... 12!
Measures ... 12!
Modified SRSD Writing Intervention ... 18!
Procedures ... 20!
Data Analysis Strategy ... 23!
Results...24!
AIMSweb Prompts ... 24!
Picture-Prompts ... 25!
Social Validity ... 29!
Discussion ... 30!
Research Questions 1 & 2 ... 31!
Research Questions 3 & 4 ... 33!
Research Question 5 ... 34!
Limitations and Future Research Directions ... 34!
Practical Implications ... 38!
Conclusion ... 39!
References ... 61!
APPENDICES ... 84!
APPENDIX A ... 85!
APPENDIX B ... 87!
APPENDIX C ... 89!
APPENDIX D ... 90!
APPENDIX E ... 92!
APPENDIX F ... 94!
APPENDIX G ... 103!
LIST OF TABLES
Table 1. Detailed Description of SRSD (Harris & Graham, 1996) ... 54
Table 2. SRSD Mnemonics (adapted from Mason, Harris, & Graham, 2011)………....54!
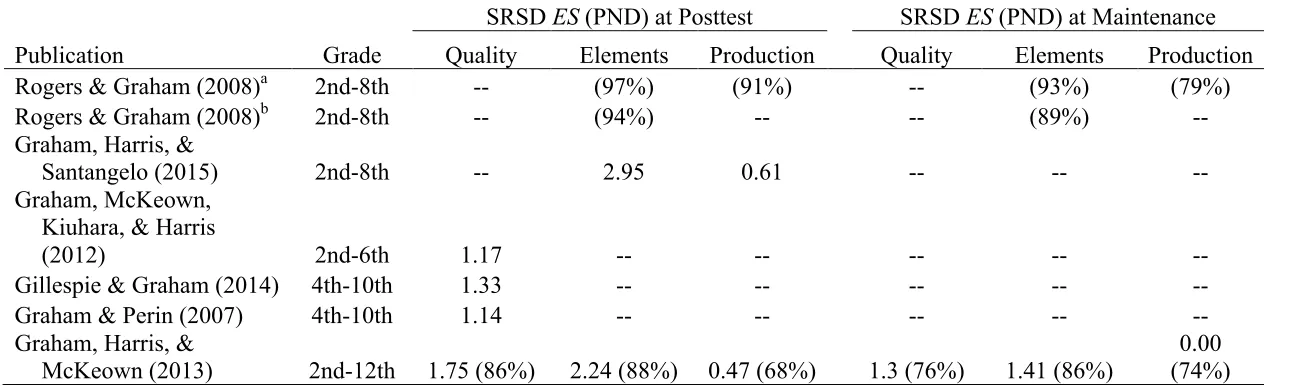
Table 3. Summary of SRSD Meta-analyses Conducted Since 2006 ... 55!
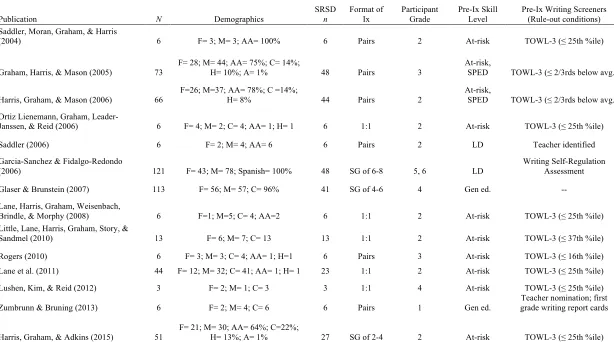
Table 4. Summary of Relevant SRSD Literature with Elementary-aged Participants, 1 of 4 ... 56!
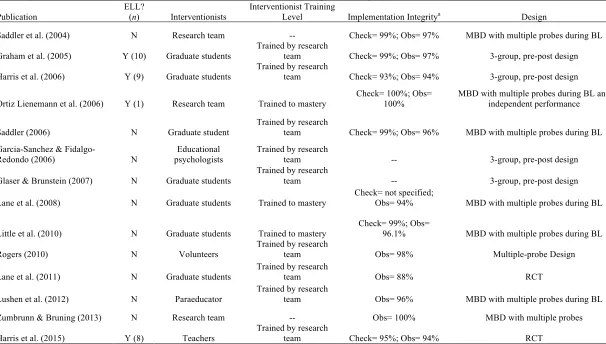
Table 5. Summary of Relevant SRSD Literature with Elementary-aged Participants, 2 of 4 ... 57!
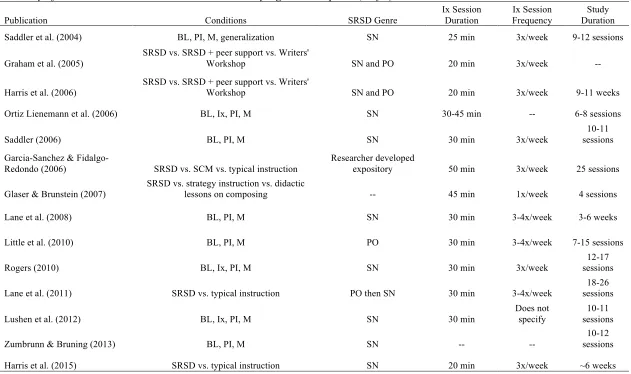
Table 6. Summary of Relevant SRSD Literature with Elementary-aged Participants, 3 of 4 ... 58!
Table 7. Summary of Relevant SRSD Literature with Elementary-aged Participants, 4 of 4 ... 59!
Table 8. Requirements to be a Methodologically Rigorous Multiple Baseline Design ... 60!
Table 9. Participant Demographics...61!
Table 10. Reliabilities and Validities Reported in Reviewed SRSD Literature ... 62!
Table 11. Reliabilities Reported for Writing CBMs ... 63!
Table 12. Criterion Related Validities Reported for Writing CBMs ... 64!
Table 13. PW Training Materials ... 65!
Table 14. Tau Effect Size by Median AIMSweb Dependent Variable and Small Group ... 66!
and Small Group ... 67!
Table 16. AIMSweb Median Scores per Participant ... 68!
Table 17. Picture-Prompt Individual Median Scores per Experimental Phase ... 69!
Table 18. Student Participants' Remembering and Applying of the Mnemonic by Group .... 70!
Table 19. Fidelity Data During and After Coaching ... 71!
Table 20. Lesson Plan Components Provided When Intended………72!
Table 21. Usage Rating Profile—Intervention, Revised (URP-IR) Scores (N = 4)…………73!
LIST OF FIGURES
Figure 1.Cognitive Process Theory of Writing model………76
Figure 2.Fixed-topic model……….77
Figure 3. Topic-elaboration model………..………78
Figure 4.The Simple View of Writing model……….79
Figure 5.The SCRIBE 2016 Checklist………80
Figure 6. Sampling flow chart throughout study. ... 81!
Figure 7. AIMSweb median group scores. ... 82!
Figure 8. Picture-prompts median group scores for elements and quality. ... 83!
Effectiveness of a Modified Approach to Small-group SRSD for Second Grade Students with Writing Difficulties
Writing is a critical academic skill for students to master prior to adulthood. Proficient writing as an adult allows one to better engage in “professional, social,
community, and civic activities,” and “students who develop proficient writing skills early on in life gain a priceless communication tool that helps facilitate learning and self-expression” (Graham, Bollinger et al., 2012, p. 6). Despite being an important skill to develop, writing is an under-researched area in contrast to other academic areas, such as reading (Cutler & Graham, 2008; National Commission on Writing, 2003).
Although the last US national report of writing that included elementary-aged
students is over a decade old (Persky, Daane, & Jin, 2003), findings from this report suggest that far too many students are not proficient writers. Persky and colleagues found that 72% of US fourth-graders are performing at the basic or below basic level (i.e., not proficient in writing). In this assessment, proficient fourth-graders are able to write an organized response within the allotted time, which includes details to “support and develop their main idea,” and shows they are aware of their audience whom they are “expected to address” (Persky, Daane, & Jin, 2003, p. 9); and basic “denotes partial mastery of prerequisite knowledge and skills that are fundamental [to becoming proficient]” (National Center for Education Statistics [NCES], 2012, p. 7). Additionally, the most recent national writing performance report indicates 73% of US eighth and twelfth grade students are writing below proficiency (NCES, 2012). Taken together, this suggests that writing is still a significant area of need for
Theoretical Underpinnings of the Writing Process
Writing is a complex academic skill to master. To best understand how to help students develop and improve their writing skills, it is important to understand the theories explaining how individuals successfully write. Flower and Hayes (1981) proposed one of the most influential writing theories called the Cognitive Process Model (see Figure 1). These authors posit that writing is a complex process of three interconnected components (i.e., task environment, long-term memory, and writing processes), which rely upon each other to successfully write. Despite its influence, it is important to note this model was developed with adult writers in mind.
To consider younger writers, Hayes (2012) found that the majority of elementary students’ expository compositions fall within two theoretical models: fixed-topic model
(Figure 2)and topic-elaboration model (Figure 3). The fixed-topic model posits that writers have the main goal of staying on topic while they write, and the topic-elaboration model posits that writers change and nest topics throughout their compositions.
Writing instruction. To best instruct students on how to develop writing skills (i.e., transcription, self-regulation, text generation), Graham, Bollinger and colleagues (2012) developed the following recommendations: (a) “provide daily time for students to write;” (b) “teach students to use the writing process for a variety of purposes;” (c) “teach students to become fluent with handwriting, spelling, sentence construction, typing, and word
processing;” and (d) “create an engaged community of writers” (p. 1). Of the aforementioned recommendations, teaching students to use the writing process has the strongest evidence to date. Self-Regulated Strategy Development is one instructional framework that teaches students how to successfully use the writing process.
Self-Regulated Strategy Development (SRSD)
Self-Regulated Strategy Development (SRSD) is an instructional framework that can be applied to different academic areas, including reading comprehension (Mason, Snyder, Sukhram, & Kedem, 2006), math problem-solving (Pericola Case, Harris, & Graham, 1992), and writing composition (Harris & Graham, 1996). Originally developed for writing
instruction, SRSD for writing (henceforth referred to as SRSD) has been well-researched and generally shown to improve students’ writing skills. The three goals of SRSD include helping students: (a) master the complex “processes involved in the planning, production, revising, and editing” of written text; (b) “to monitor and manage their own writing” of compositions; and (c) develop more “positive attitudes about writing and themselves as writers” (Harris & Graham, 1996, p. 25). There are six recursive stages of instruction within the SRSD
are two different SRSD mnemonics for different writing genres: (a) narrative/story, and (b) persuasive/opinion. See Tables 1 and 2 for a more elaborate description of SRSD.
Arguably one of the most heavily researched writing interventions, SRSD has much support behind its use in improving students’ writing composition skills (Graham,
McKeown, Kiuhara, & Harris, 2012; Graham & Perin, 2007; Rogers & Graham, 2008; What Works Clearinghouse, 2017). Because this current study focuses on evaluating SRSD with second grade participants, only studies that evaluated SRSD in grades 1-3 will be described. Tables 3, 4, 5, 6, and 7 summarize the relevant SRSD literature over the past 10 years.
Research with elementary-aged participants is less prevalent than SRSD research with middle- and high-school aged participants. Despite the smaller literature-base, Graham, McKeown, Kiuhara, and Harris (2012) conducted a meta-analysis focusing on the
effectiveness of writing interventions for elementary-aged students and found that SRSD is considered an effective intervention for improving struggling and non-struggling
participants’ writing quality (ES= 1.17) in grades 2-6. Additionally, previous studies support the use of SRSD in one-on-one (Lane et al., 2008; Lane et al., 2011; Little et al., 2010; Ortiz Lienemann, Graham, Leader-Janssen, & Reid, 2006), one-on-two (Graham, Harris, & Mason, 2005; Harris, Graham, & Mason, 2006; Saddler, 2006; Saddler, Moran, Graham, & Harris, 2004; Zumbrunn & Bruning, 2013), and small-group (Harris, Graham & Adkins, 2015) intervention formats for primary grade students.
either experimental group designs or modified multiple baseline designs to evaluate effectiveness; (d) all included participants who struggle with writing; (e) all saw posttest improvements across dependent measures and some maintenance of gains; (f) suggest SRSD is a socially valid writing intervention (when measured); and (g) support the use of SRSD with struggling writers regardless of the instructional grouping (e.g., one-on-one or small-group). Due to the specific goals of this current study, small-group SRSD will be discussed next.
Small-group SRSD. Only one published study to date has focused on evaluating the small-group format (i.e., 2-4 students per group) of SRSD for elementary-aged students. Harris, Graham, and Adkins (2015) used a randomized controlled study to examine the effectiveness of small-group SRSD on second grade struggling writers and found that participants who received small-group SRSD significantly outperformed those in the control group on measures of writing quality (ES = 1.22) and story elements (ES = 0.89), and the results maintained over time for writing quality (ES = 1.65) and story elements (ES = 1.01). Finding effectiveness for a small-group version of SRSD is noteworthy because of the recent shift in educational policy towards the response-to-intervention framework and the need for more time- and cost-efficient intervention programs for struggling students.
Small-group Interventions within the Response-to-Intervention Framework
et al., 2008, p. 4). There are typically three tiers within RTI models: (a) at tier 1 students receive evidence-based class-wide instruction and universal screening is used 3-4 times per school year to monitor students’ skill level; (b) tier 2 is the first level of intervention for struggling students, and provides struggling students with targeted intervention, often in a small-group context; and (c) tier 3 provides more intensive interventions that are only necessary when students fail to improve from tier 2 intervention (Burns, Jimerson, VanDerHeyden, & Deno, 2016; Denton, 2012).
For the purposes of this current study it is necessary to further discuss tier 2, small-group interventions. In addition to being a major component of RTI, a small-small-group
intervention approach is considered more efficient and practical for educators to use with their struggling students over a one-on-one intervention approach (Foorman & Torgesen, 2001; Wasik, 2008). Research in reading instruction has found that most students equally improve whether they receive a one-on-one or small-group intervention as long as the instructional components are similar between the interventions (Begeny, Levy, & Field, 2018; Vaughn et al., 2003). For example, similar outcomes were found across participants when they received either a small-group version or a one-on-one version of the same reading intervention (Vaughn et al., 2003).
systematic process is used to identify the student’s needs, identify an individualized
intervention approach, and then evaluate the student’s progress over time (Gresham, 2009). Harris and colleagues (2015) evaluated small-group SRSD within a tier 2 problem-solving model.
The standard-treatment protocol approach uses a prescriptive approach to
intervention. For example, every child who has the same identified problem (e.g., reading fluency difficulty) will receive the same evidence-based intervention (Begeny, Schulte, & Johnson, 2012; Fuchs & Fuchs, 2006). Interventions used within this approach to RTI are typically scripted in nature (Harris et al., 2015), which are programs that provide all information and procedural protocols necessary for an interventionist to implement the program well (Begeny et al., 2012; Simmons et al., 2011). Scripted interventions can also reduce interventionist idiosyncrasies (Schoenwald, Carter, Chapman, & Sheidow, 2008) and increase consistency across interventionists (Reeves, 2010). This scripted approach to intervention may serve as a way to reduce the SRSD research-to-practice gap (as noted by Harris & Graham, 2017) by translating a supported research intervention to scripts and protocols for interventionists’ ease of implementation. Harris and Graham (2017) note that one current method to rolling-out SRSD in educational practice is the professional
development approach; however, the developers of SRSD encourage developing and researching other approaches to getting SRSD into schools to benefit students. Taken
Usable Interventions
According to the National Implementation Research Network (NIRN), in order for an intervention to be implemented correctly it needs be considered usable. A usable intervention includes multiple components such as a clear description of the intervention, clear functions of intervention components, working operational definitions, and progress monitoring of performance (NIRN Active Implementation Hub, n.d.). Based on a comprehensive review of the literature and SRSD lesson plan examples and recommendations (see Harris & Graham, 1996), SRSD achieves some usable intervention factors. However, there are areas that can be improved upon, such as essential functions and operational definitions. Scripting parts of SRSD may improve upon the usability of this small-group intervention and might allow for non-educators and non-researchers (e.g., paraprofessionals, undergraduate university
students, or community volunteers), to successfully implement an otherwise unusable writing intervention.
Purpose of Study
Research Questions. This study was designed to answer the following five research questions:
1. Will student participants’ performance in writing improve as a function of receiving the modified version of SRSD?
2. Will student participants’ improvement in writing maintain approximately two weeks after SRSD instruction is removed?
3. After 6-9 hours of training and 2-3 coaching/feedback sessions, will interventionists provide the modified version of SRSD with high fidelity (i.e., ≥ 90% fidelity in using core steps and ≥ 80% fidelity in using quality implementation indicators)?
4. Will interventionists’ implementation fidelity maintain over time after coaching/feedback sessions are removed?
5. Is this modified version of SRSD considered socially valid according to the student participants and undergraduate interventionists?
Hypotheses. The hypotheses for the five aforementioned research questions are: 1. Student participants’ performance in writing will improve as a function of receiving
the modified version of SRSD. Specifically, it is hypothesized that after
approximately three to four weeks of SRSD lesson plans (i.e., 9-12 intervention sessions), participants will start to gradually improve over time in five measures of writing (story elements, writing quality, production, total words written [TWW], correct writing sequences [CWS]).
3. Interventionists will provide the modified version of SRSD with adequate fidelity after receiving training and coaching/feedback sessions.
4. Interventionists’ fidelity will maintain after coaching/feedback sessions are removed. 5. The student participants and interventionists will consider this modified version of
SRSD socially valid, as measured by psychometrically valid rating scales. Method
The North Carolina State University Institutional Review Board approved all of the methodological procedures prior to commencing this study.
Research Design
A multiple baseline design across intervention groups was conducted to answer research questions one and two. To achieve experimental control and ultimately assess for causality, this design included three experimental phases (baseline, intervention, and posttest) and three baselines staggered by one week. For the purposes of this study, it is worth
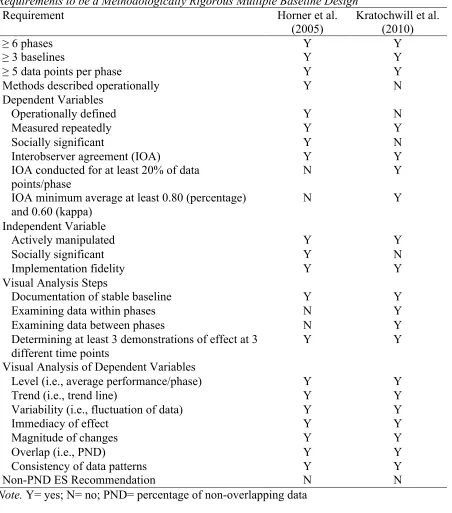
highlighting that all methodological details described below adhere to what numerous and well-regarded sources (e.g., Horner et al., 2005; Kratochwill et al., 2010; Kratochwill et al., 2013; Tate et al., 2016) consider to be a methodologically rigorous multiple baseline design. Refer to Table 8 and Figure 5 for specifics from these sources.
Participants
Student participants. Because US students are struggling with writing starting in the elementary grades, this study sought to provide early writing intervention to second grade students. To be included in this study, all second graders in the participating school were screened with an AIMSweb writing prompt (see below for further information on
between the 10th and 43rd percentile on TWW and CWS from the AIMSweb writing prompt, (b) not eligible for special education services, (c) speak English as their primary language, and (d) teachers confirmed they were experiencing difficulty with story writing. See Figure 6 for flowchart of included participants.
Thirteen students were identified as qualifying to participate in this study. These 13 out of 54 total second graders in the school equates to 24% of the grade, which is somewhat commensurate with the theoretical guidelines of 20% of students requiring supplemental, tier 2 instruction within the RTI/MTSS framework (Burns et al., 2016). A total of 12 students’ parents returned consent forms, thus 12 students participated in this study. After consent was received, the participants were administered the Handwriting subtest from the Process Assessment of the Learner, second edition (PAL-II; Berninger, 2007), which focuses on transcription skills. This measure was collected because SRSD will likely not be an
appropriate intervention for students with low transcription scores because SRSD does not focus on transcription skills (i.e., handwriting; Berninger et al., 2002). Of the 12 participants, 58.3% of the participants were White, 33.3% were Black, and 8.3% were Biracial.
Furthermore, 25% (n= 3) of the sample was female, and the mean age was 8.01 (range= 7.48-8.62). Students’ PAL-II scores ranged from Low Average to Superior (standard score range = 6-15). See Table 9 for demographic data, PAL-II scores, and group assignment per individual participant.
primary investigator. Prior to being considered a fully trained interventionist, each person participated in six training modules developed by the primary investigator. Furthermore, each training module included a module specific mastery check, and all interventionists
successfully passed the mastery checks at the specific levels prior to working with the participants. Additional details about training are described later.
Setting
This study took place within the participants’ K-5 public elementary school in the southeast region of the United States. Approximately 324 students are enrolled in this school and 24% of them receive free or reduced price lunch. Assessment and intervention sessions were implemented in an empty classroom free from noise and other distractions.
Measures
Curriculum-based measurement in written expression (CBM-WE). CBM-WE is
amount of these two adjacent writing units written within a three-minute span.
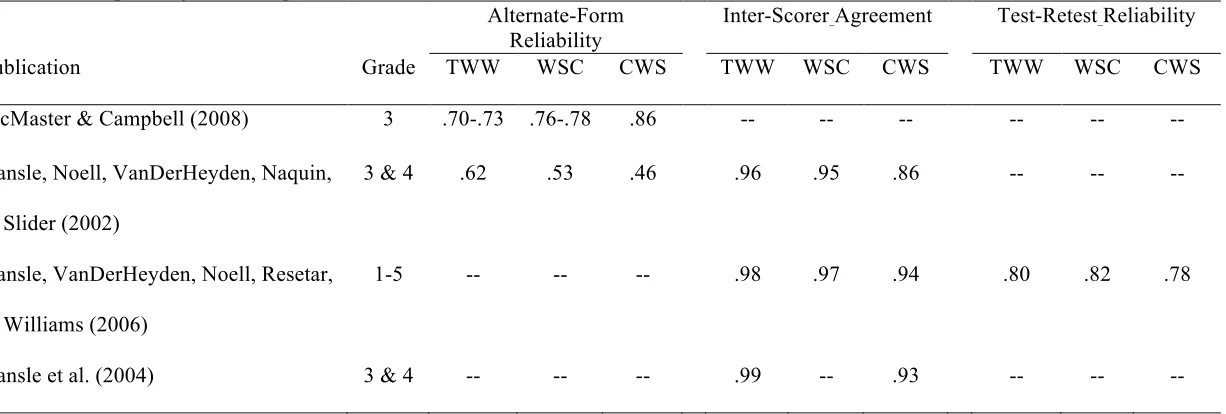
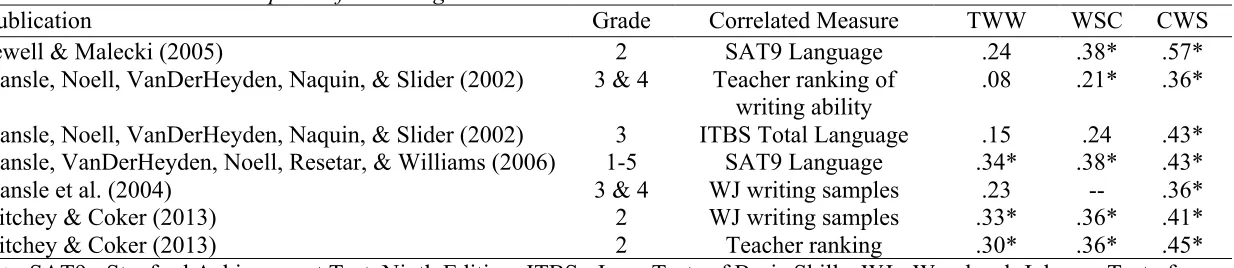
AIMSweb CBM-WE (Powell-Smith & Shinn, 2004) is a packaged writing CBM that is available as a progress-monitoring tool. AIMSweb CBM-WE is considered a reliable and valid measurement of TWW, WSC, and CWS (Powell-Smith & Shinn, 2004). Alternate-form reliabilities for each CBM measure are quite variable, ranging from .62-.73 for TWW, .53-.78 for WSC, and .46-.86 for CWS (Gansle, Noell, VanDerHeyden, Naquin, & Slider, 2002; McMaster & Campbell, 2008). Inter-scorer agreement is more stable, ranging from .96-.99 for TWW, .95-.97 for WSC, and .86-.94 for CWS (Gansle et al., 2002, 2004; Gansle, VanDerHeyden, Noell, Resetar, & Williams, 2006). Gansle and colleagues (2006) provided test-retest reliability for each CBM measure: .80 for TWW, .82 for WSC, and .78 for CWS. The average criterion-related validities for each measure are .24 for TWW, .32 for WSC, and .43 for CWS (Gansle et al., 2002, 2004, 2006; Jewell & Malecki, 2005; Ritchey & Coker, 2013), which are considered relatively weak validity coefficients (Field, 2009). All available reliabilities and validities for writing CBM measures (TWW, WSC, CWS) collected with elementary-aged samples are compiled in Tables 11 and 12.
PAL-II handwriting subtest. There are three tasks that make up the PAL-II handwriting subtest: Alphabet Writing, Sentence Copying, and Paragraph Copying
(Berninger, 2007). All of the tasks require the participant to write as quickly and accurately as possible. The Alphabet Writing task requires the participant to write the alphabet in order; Sentence Copying requires the participant to copy a sentence word-for-word; and Paragraph Copying requires the participant to copy a paragraph word-for-word. Three composite scores are derived from the completion of these three handwriting tasks: Handwriting Total
Legibility (TLC; i.e., accuracy of writing legibly), and Handwriting Total Time (TTC; i.e., speed of writing).
According to the corresponding user guide, the PAL-II reliably and validly measures handwriting. However, only reliability coefficients are available in the user guide, and are provided next. Internal consistencies for the three composites with a second grade sample are .73 for TALC, .82 for TLC, and .84 for TTC. Test-retest reliabilities for kindergarten through third grade, with administrations that occurred between two to thirty-four days apart, were .54 for TALC, .78 for TLC, and .75 for TTC. Finally, inter-scorer agreement for each task was also reported: 91-98% for Alphabet Writing, 88-96% for Sentence Copying, and 91-97% for Paragraph Copying.
Picture-prompts. To maintain consistency with and allow for comparison of outcomes to other SRSD studies (i.e., Harris et al., 2006, 2015), the same story writing prompts and corresponding measures were also used in this proposed study. Harris and colleagues (2006, 2015) used picture story writing prompts (i.e., picture-prompts) to collect stories written by their participants. These picture-prompts are black and white drawn images of scenes for participants to compose stories about (see Appendix B for an example).
Participants wrote stories based on these picture-prompts during baseline and intervention. Participants were prompted to look at the picture, plan a story, and do their best writing. It is important to note that these procedures were untimed, however after 15 minutes of writing, students were encouraged to finish up their stories. During baseline, it took student
software. This is a common practice used to reduce bias in scoring (Graham, 1999). Three measures were collected based on these typed stories: (a) number of words written (i.e., production), (b) story elements included, and (c) writing quality.
Story elements rubric. The story elements rubric (i.e., story elements) has been consistently used in studies evaluating SRSD (i.e., used in 15 of the 20 studies included in Tables 3-7) to measure the amount of basic compositional elements included in each story written. The rubric is a rating scale where the participants receive one point for each element they include in their untimed, written composition: “main character(s), locale, time, what the main character(s) want to do (goals), action to achieve goal(s), consequence of actions, and characters’ reaction” (Harris et al., 2015, p. 11; See Appendix C). The score ranges from zero to seven, with zero being the lowest score and seven being the highest score. Due to the subjective nature of this measure, the story elements score in this study will be the average of two independent raters’ ratings.
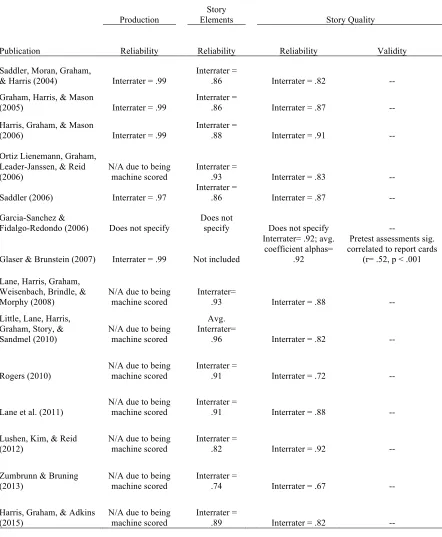
Story elements is not considered a norm-referenced measure of writing but previous research supports it as a reliable measure for assessing elements with an average inter-rater reliability of .88 (See Table 10). No validity statistics have been reported for this measure.
Holistic writing quality. Similar to the story elements rubric, the writing quality
will be the average of two independent raters’ ratings.
Writing quality is also not considered a norm-referenced measure of writing, however previous research supports its use as a reliable measure for assessing writing quality, with an average inter-rater reliability of .84 (See Table 10). Only one reviewed SRSD study included validity statistics; Glaser and Brunstein (2007) found that their pretest measures of writing quality significantly correlated to participants’ report cards (N = 113, r = .52, p < .001).
Social validity. Previous SRSD studies collected social validity data with the
Intervention Rating Profile (IRP; Witt & Elliot, 1985) and the Children’s Intervention Rating Profile (CIRP; Witt & Elliot, 1985). It was generally found that SRSD is a socially valid intervention (Lane et al., 2008, 2011; Little et al., 2010). Although the IRP and CIRP have previously been used to measure social validity, this study will use the Usage Rating Profile—Intervention, Revised (URP-IR; Chafouleas, Briesch, Neugebauer, & Riley-Tillman, 2011) and the corresponding Children’s Usage Rating Profile (CURP; Briesch, & Chafouleas, 2009a). The URP will be used instead of the IRP because the URP measures usage/usability of the intervention in addition to acceptability of the intervention, rather than only acceptability.
URP-IR. The URP-IR is a 29-item rating scale filled out by the interventionist,
which includes the following six subscales: (a) Acceptability, (b) Understanding, (c)
Feasibility, (d) Family-School Collaboration, (e) System Climate, and(f) System Support
for any given URP-IR scale. Per the authors, higher scores on Acceptability, Understanding, Feasibility, and System Climate indicate higher usability and acceptability of the
intervention. However, higher scores on Home School Collaboration and System Support indicate lower usability and acceptability of the intervention. Internal consistency reliability estimates for the six subscales were considered to be at acceptable levels (range = .72-.95; Briesch et al., 2013). See Appendix D for a copy of the rating scale.
CURP. The CURP is a 21-item rating scale completed by the child receiving the
intervention. The CURP includes three different subscales: (a) Personal Desirability, (b)
Feasibility, and (c) Understanding. It is important to note there are no specified criteria, recommendations, or cutoff scores for determining what is considered “acceptable” for any given CURP scale. Per the authors, scores range from 7-28 on Personal Desirability and from 6-24 on Understanding, and higher scores on these factors indicate higher desirability of use and higher understanding of use; while, scores range from 8-32 on the Feasibility factor, and a higher score on this factor indicates lower feasibility of use. Internal consistency reliability estimates for the three subscales fell at the acceptable levels (range = .75-.92; Briesch & Chafouleas, 2009b). See Appendix E for a copy of the rating scale. It is important to note that the sample used by Briesch and Chafouleas consisted of third, fourth, and fifth grade
students. No psychometric data are available for second grade students.
the measures, inter-scorer reliability was calculated with intraclass correlation (ICC; Field, 2009; Hallgren, 2012) for the picture-prompts, and the following formula was used for the AIMSwebs: “Agreements/(Agreements + Disagreements) x 100” (Powell-Smith & Shinn, 2004, p. 17). All of the picture-prompts (100%) were double-scored, yielding excellent reliability scores for story elements (ICC= 0.864) and for writing quality (ICC=0.767) based on Cicchetti’s (1994) guidelines. A total of 25.3% of the AIMSweb writing samples were double-scored, yielding inter-scorer agreement scores of 96.7% for TWW, 91.9% for WSC, and 82.6% for CWS.
Modified SRSD Writing Intervention
As previously stated, SRSD is considered an effective intervention for improving writing skills in struggling second grade students (e.g., Graham, McKeown et al., 2012; Harris et al., 2015; Little et al., 2010; Ortiz Lienemann et al., 2006; Saddler, Moran, Graham, & Harris, 2004). Only one published study to date has provided SRSD in a small-group format, and this current study utilized a modified, scripted version of small-group SRSD. For the purposes of this study, the interventionists used a modified version of the mnemonic for story writing: POW + WWW, What, What?!, How, How?!. Refer to Table 2 for what the POW + WWW mnemonic stands for. Additionally, the modified version of SRSD was aptly named POWerful Writers (PW). This name was chosen to make reference to the POW mnemonic that was developed for use with SRSD while also making the name catchy and fun for the participants. PW is similar to SRSD in many ways, including students’ use of (a) the mnemonic (POW + WWW, What = 2, How = 2) and applying those mnemonics
writing. However, PW is different from SRSD in some of the following ways: (a) PW lesson plans are scripted and therefore implementation is fully consistent across PW
interventionists, (b) a star chart and corresponding goal-setting was integrated into each lesson, (c) stories used were more complex and novel to PW, (d) student worksheets were developed to guide lessons and keep students on track, and (e) progress-monitoring of remembering the mnemonics was built into each lesson.
Scripted lesson plans. Seventeen PW lesson plans were adapted and developed based on materials found in Harris and Graham (1996), Zumbrunn (2010), and Rogers (2010). Each of these lesson plans provide information on what materials are needed for the lesson and include scripted directions for the interventionist to say to the students with embedded procedural instructions to follow. Because a major tenet of SRSD is to increase students’ independent performance over time, the lessons shifted from interventionist-led (lessons 1-6), to a group focus (lessons 7-13), to an individual focus (lessons 14-17) as time went on. See Appendix F for lesson plan 1 and corresponding instructional materials. Example stories included in the lesson plans were either adapted from the HELPS Curriculum (Begeny, Mann, Cunningham, & Tsuen, 2009) or developed by the primary investigator and her faculty advisor.
session observed yielded the following information: fidelity of core steps, fidelity of sub-core steps, fidelity of TRs, and time of session.
Procedures
The following procedures began in January 2017 and ended in May 2017. The North Carolina State University IRB and the local district’s data and accountability department approved all of the following procedures.
Consent and screening. All second-grade students in the participating school were class-wide administered three AIMSweb writing prompts in their classrooms. Once collected, all data were de-identified and the primary investigator scored the writing samples for TWW and CWS. The median TWW and CWS scores of the three writing samples were the final scores used to determine eligibility. The 18 students whose scores fell within the 10th to 45th percentile range were identified as potential participants, participants’ teachers confirmed which students would benefit from PW, and 13 were sent home consent forms for parents to fill out and send back to the school. Twelve consent forms were collected, and these 12 participants were further screened with the PAL-II Handwriting subtest. Immediately before being administered the PAL-II tasks, assent was obtained individually. All participants assented to participating in the study.
Assessment. Picture-prompts (PPs) and AIMSweb CBM-WEs (AWs) were
approximately every Monday and Thursday. A writing sample was collected each day during the intervention phase; depending on the day, PPs were collected before the daily SRSD lesson, and AWs were collected after the daily PW lesson. At the conclusion of the
intervention phase, social validity measures were collected. Approximately two weeks after the end of the intervention phase, three AWs were collected for all second-graders in the participating school, including 11 of the participants.
Interventionist training and coaching sessions. Interventionist training concluded five weeks prior to the first PW group starting. It took approximately eight hours and specifically four training sessions over the course of two weeks to complete the six training modules as a team. The topics of the six training modules were as follows: (a) preparing for lessons with participants, (b) collecting daily writing samples, (c) reviewing PW instructional materials, (d) tips for being an effective interventionist, (e) using PW instructional materials, and (f) collecting PW observation data. See Table 13 for specifics on what was included in each training module and mastery check requirements.
Once intervention began, the five interventionists received two in-vivo coaching sessions by the primary investigator. The first coaching session occurred the first time the interventionist provided a lesson. The second coaching session occurred for either the second, third, or fourth lesson provided by the interventionists. During these coaching
sessions the primary investigator observed silently behind the students during the lessons and used the observation checklists. After each observed session, the primary investigator asked the interventionist about what she did well and what she would like to improve for the next session, and then the primary investigator provided the same type of feedback.
coaching sessions ended, with 64.1% of sessions observed. The interventionists met with the primary investigator once per week as a group to discuss the following week’s schedule, logistics of traveling to and from the school, and general behavioral management strategies.
Instructional grouping. Gersten and colleagues (2008) strongly recommend tier 2 interventions be implemented in skill-based homogeneous groups of three to four students. Thus, during the first week of baseline data collection all participants completed one PP. The PP score served as the primary measure for grouping participants into three homogenous groups of four based on story writing performance. First, the students were ranked based on their elements score, and for students who had the same elements score they were further ranked based on quality score. Length of stories was also taken into consideration for differentiating between groups of stories. After all 12 students were ranked based on PP performance; teachers’ input regarding students’ behavior was taken into consideration. Those students who teachers indicated should not be assigned to the same group were separated into different groups. This grouping procedure yielded three instructional groups that were all performing somewhat differently in story writing ability. Groups will henceforth be referred to as the Green, Orange, and Red Group.
manage students’ behavior. These procedures continued once the intervention phase began for the Green Group and then the Orange Group. Students remaining in baseline were seated away from students in the intervention phase and were taken back to class after the groups’ writing samples were completed to reduce contamination from the intervention phase.
During the intervention phase, participants met with the interventionists for
approximately 15- to 30-minute PW sessions, three times per week, at the end of the school day. Each session either started or ended with a writing sample. Each lesson began with an introduction for the day and a majority of lessons then prompted the students to write down what they could remember of the PW mnemonic (i.e., Activity A). After completing Activity A, the interventionist facilitated the remainder of the lesson within the remaining allotted time. During the intervention phase the Green Group received 17 lessons, the Orange Group received 14, and the Red Group received 11 lessons.
Data Analysis Strategy
Tau effect size was conducted as the secondary analysis instead of percent of non-overlapping data (PND) because it (a) can control for baseline trend if it exists (i.e., Tau-U), (b) takes both trend and nonoverlapping data into account, and (c) is nonparametric and ideal for smaller datasets (Parker, Vannest, Davis, & Sauber, 2016; Vannest, Parker, Gonen, & Adiguzel, 2016). Tau, rather than Tau-U, was calculated in this study because there were no baseline trends to control for in this dataset (i.e., there were no significant baseline trends; Vannest et al.). Tau is an effect size for single-subject design data, and is a proportion that ranges between -1 and 1 (Solomon, Howard, & Stein, 2015). Vannest and Nanci (2015) suggest the following interpretation guidelines for Tau coefficient sizes: “[a] 0.20
improvement may be considered a small change, 0.20 to 0.60 a moderate change, 0.60 to 0.80 a large change, and above 0.80 a large to very large change” (p. 408). Tau was calculated using the web-based application developed by Vannest and colleagues, which provides effect size coefficients and corresponding p-values that indicate if there was a significant intervention effect.
Results AIMSweb Prompts
intervention data points, there is no evidence of an intervention effect for the Green Group on the AW measures. The Orange Group and Red Group’s AW data likewise did not evidence an intervention effect. For example, there were no immediate changes in level, no increasing trends during intervention, and considerable overlap between baseline and intervention data points.
As a secondary analysis, Tau effect size was computed for each AW dependent variable. The average Tau proportions across small groups (see Table 14) likewise do not evidence an intervention effect on the AW dependent variables: TWW (Tau = -0.07, p = .68), WSC (Tau = -0.07, p = .69), and CWS (Tau = 0.08, p = .66). Similarly, as shown in Table 16, each student’s individual median AW score by experimental condition does not suggest any notable improvements between conditions, but does suggest some improvement over time from winter to spring benchmarks. Average rate-of-improvements (ROI) were
calculated from Pearson’s (2012) ROI growth norms for students performing within the very low, low, and average ranges. Based on these calculations, it was expected that participants would typically improve on average by 10.4 TWW, 13.6 WSC, and 7.42 CWS over the course of 16-weeks (the amount of time between winter and spring benchmarks). The following number of participants exceeded expected growth for each variable: five for TWW, two for WSC, and two for CWS.
Picture-Prompts
Elements. The Elements data in Figure 8 does not consistently suggest a possible intervention effect. Regarding the Green Group, there was much variability and overlap of data in both the baseline and intervention phases, which suggest a minimal intervention effect. For the Orange Group, there was an initial stable baseline with a sudden decrease prior to the start of intervention, and a slight increasing trend in the intervention phase; however, there was much overlap between the experimental phases, again suggesting minimal intervention effect. Finally, the Red Group had stable baseline and intervention data. Although there were no trends in baseline or intervention, there was an immediate effect and change in level, and all intervention data points exceeded baseline, suggesting a potential intervention effect for the Red Group. However, this improved performance cannot be considered a function of PW because this intervention effect was not replicated across groups.
Quality. The Quality data in Figure 8 suggest a possible intervention effect. Baseline data for the Green Group were relatively stable, followed by an immediate decrease in level, and then an increasing trend with the final two data points exceeding all baseline data points. The Orange Group also had a relatively stable baseline, followed by a slight increasing trend which then stabilized with the final three data points exceeding all baseline data points. Finally, the Red Group had a stable baseline, followed by an immediate change in level with all intervention data points exceeding baseline data.
intervention phase, with only the second and the fourth intervention data points exceeding baseline. Finally, the Red Group had a stable baseline, followed by an immediate change in level with all intervention data points exceeding baseline data.
Secondary analysis. Tau weighted average scores, found in Table 15, suggest some intervention effects on the PP dependent variables across small-groups: Elements (Tau = 0.41, p = .11), Quality (Tau = 0.65, p = .01), and Production (Tau = 0.52, p = .04). These results supplement the visual analyses and suggest the participants generally improved their performance on the PP variables during the intervention condition. However, when
separating out each small group’s data, Tau scores suggest each group responded differently to intervention. Specifically, the Green Group had no significant Tau values across variables, the Orange Group only had one significant Tau effect size in Quality (Tau = 0.94, p = .03), and the Red Group had significant Tau effect sizes (Tau = 1.00, p = .03) across all PP variables. Regarding Tau practical significance, the Green Group did not make practical improvements over the course of the study; the Orange Group’s improvement across phases in (a) Elements was moderate, (b) Quality was very large, and (c) Production was large. Furthermore, the Red Group’s improvement in all PP variables across phases was very large (Vannest & Nanci, 2015).
There are no rates-of-improvement to refer to for determining expected growth on these PP variables. See Table 17 for individual participants’ median scores across
experimental phases. These individual results suggest there was a small but notable
scores from baseline to intervention, with an average increase of 50 total words (range = 3-181.5) for these participants. However, only five (42%) participants improved their Elements score by at least one point from baseline to intervention, and four (33%) participants’
Elements score actually decreased from baseline to intervention.
Follow-up review of the Elements data suggest that student participants, while receiving PW, tended to include Who (96.81%) and What happened (89.36%) elements in the vast majority of their stories; sometimes included Where (52.13%), How feels (27.66%), and How ends (54.26%); and rarely included When (12.77%) and What Wants (15.96%) in their stories. Additionally, students tended to have difficulty remembering what the
mnemonic (i.e., WWW, What, What?! How, How?!) stood for during the PW lessons. Specifically, at the beginning of most lessons, students were instructed to fill out a blank mnemonic worksheet, and these data were entered into a spreadsheet and reviewed. On average, students struggled to correctly remember what the mnemonic stood for throughout the intervention phase, with all percentages falling below 60%: Who (50.94%), When (52.83%), Where (52.83%), What wants (48.94%), What happens (36.17%), How feels (54.74%), and How ends (50.53%). See Table 18 for these data separated out by small group. Implementation Fidelity
To understand interventionists’ implementation fidelity, data from observation checklists before and after coaching were averaged by time point and compiled into Table 19. For the 11 PW lessons that were observed and had coaching at the beginning of
Steps (M = 100%), Sub-Core Steps (M = 96.50%), and Tips and Reminders (M = 91.54%). Overall, implementation fidelity was consistently high throughout the study.
It is important to note these implementation fidelity data reflect those components of the lesson plans the interventionists were able to provide in the time allotted. Meaning, there were components of the lesson plans that interventionists were not able to complete due to factors outside of the interventionists’ control. For example, participants’ teachers sometimes requested shortened PW intervention time, usually due to end of school-day procedures, and therefore did not allow interventionists to complete full sessions. However, the
aforementioned data reflect that, of the procedures that could be implemented in the time provided, interventionists implemented those procedures with high fidelity. Refer to Table 20 for the percentage and frequency count of the specific lesson plan components that were provided by the interventionists in the allotted intervention session time.
Social Validity
responded with a 3) on all items in that scale. These cut-point scores and URP-IR data are reported in Table 21. Based on these data, interventionists tended to (a) agree that PW is understandable; (b) slightly agree to agree that PW is acceptable, feasible, and is viewed positively within the school climate; and (c) slightly disagree to disagree that PW needs support within the system to be feasible (e.g., consultation) and needs support from the students’ families to be usable.
Additionally, the average CURP scores provide the students’ perspective. CURP cut-points were also calculated, and an average kind of agree score was calculated for the scales where higher scores indicated higher usability (personal desirability and understanding), and an average kind of disagree score was calculated for the scale where lower scores indicated higher usability (feasibility). The average kind of agree score indicates the cut-point of what scale scores would be if the participant slightly agreed (or responded with a 3) for each question that makes up the factor, and the average kind of disagree score is the same concept applied if the participant slightly disagreed (or responded with a 2) on all items in that scale. These cut-point scores and CURP data are reported in Table 22. Based on these data,
students tended to (a) at least slightly agree they had a personal desirability to participate in PW and they understood why they were receiving PW; and (b) disagree that PW was feasible, meaning that PW tended to require too much effort and was “[intrusive] to the classroom dynamic” (Briesch & Chafouleas, 2009).
Discussion
attempt to translate research into practice and to increase the usability and feasibility of providing research-based writing intervention to students within tier 2 of RTI. There are three factors that made this SRSD study novel from the current literature-base: (a) a scripted version of SRSD was developed and used, (b) AWs were used to track student outcomes, and (c) a true multiple baseline design was utilized in which progress was tracked throughout the intervention phase. The two main research questions asked if students’ writing performance would improve from receiving PW and if the improvement would maintain over time. The other three research questions asked if interventionists could implement PW with high fidelity after a relatively brief amount of training, if the high fidelity would maintain over time, and if PW is considered socially valid.
Research Questions 1 & 2
words, it is important to match the skill area being assessed with the intervention skills being targeted (Ardoin, Wagner, & Bangs, 2016; Hosp, Hosp, & Howell, 2016). Because writing fluency and written expression involve using different skills, based on theoretical models of writing (Berninger et al., 2002; Ritchey et al., 2016), it is understandable that the AW
variables examined in this study did not improve as a result of PW. This was the first study to date that incorporated aspects of SRSD and measured participants’ performance over time with AWs in addition to PPs, and this novel finding supports the need for (a) progress monitoring to coincide with the targeted skill area of the writing intervention, and (b) a general writing CBM to be developed that fully encompasses elementary students’ writing skills.
As such, one would most expect the PP variables to improve as a result of PW, and findings from this study evidence such improvements. Similar to other SRSD studies, participants in the present study generally improved in their Quality (Tau = 0.65, p = .01) and Production (Tau = 0.52, p = .04) scores (e.g., see Tables 3-7). Also, approximately 70% of participants responded positively to receiving small-group intervention, which is
growth on their Elements scores (Tau = 0.41, p = .11) despite receiving explicit teaching of the elements rubric during PW lessons.
To explore why participants did not improve on a dependent variable that was explicitly taught to the participants, the PP writing samples were further reviewed for the exact elements that were and were not included. Overall patterns indicated participants tended to include only a select few story elements consistently while receiving PW.
Additionally, student participants tended to have difficulty memorizing the mnemonic based on their completion of PW lesson plan worksheets.
Research Questions 3 & 4
According to Fixsen, Naoom, Blase, Friedman, and Wallace (2005), implementation fidelity should be strong after receiving training that explicitly teaches the components of the intervention, shows how to implement the intervention, and provides opportunities for practice and feedback in real time. Furthermore, coaching in addition to didactic training is known to drastically increase the likelihood that an educator will (a) use a newly trained intervention strategy and (b) implement the strategy correctly (Joyce & Showers, 1982). The methods for training the interventionists in this study included both didactic training and coaching. Based on the implementation fidelity results from this study, interventionists were able to implement PW adequately after they participated in approximately eight hours of training that included video examples and role-plays. Additionally, interventionists received in-vivo coaching from the primary investigator to support what they learned in the trainings. Throughout the course of the study, interventionists were able to maintain high
teach or deliver intervention) can learn a relatively complex intervention program through relatively concise training. As discussed earlier, this finding has positive implications for the many schools that (a) have high percentages of students who do not write at proficient levels, and (b) need to find resource-efficient ways to support those students’ writing development. Research Question 5
Previous SRSD studies measured social validity, and an overwhelming majority of results from these studies suggest that SRSD is considered socially valid and acceptable (see Table 7). The current study sought to understand if PW was socially valid/acceptable and also a usable intervention (NIRN Active Implementation Hub, n.d.) by both interventionists and student participants. Results from the URP-IR and CURP suggest that overall PW is considered usable; however, student participants did not agree that PW could be completed feasibly, which is likely due to many rushed PW sessions and interventionists skipping ahead in the PW lessons due to regularly having a limited amount of time. This and other
limitations will be discussed next.
Limitations and Future Research Directions
Limitations of this study and future research directions can be summarized into the following three categories: sampling, time management, and measurement.
2016), the participating school had a relatively small student population that ultimately limited the pool of eligible students to pull from for the purposes of this study. Student participants, although grouped as homogenously as possible, based on recommendations by Gersten et al. (2008), tended to exhibit different individual skills and understanding of what was taught during the PW curriculum while working in the small groups. This variation of skill-level and conceptual understanding of PW concepts, based on observations of students’ handwriting/behavioral skills and lesson plan worksheet data, may have influenced the variation in student participants’ response to intervention.
To address these sampling concerns, future studies should (a) attempt to team up with either a larger school or with multiple schools, which would theoretically increase the
number of students falling within tier 2 of the RTI/MTSS model; (b) assess students on their handwriting and behavioral skills prior to starting intervention and provide targeted
remediation prior to using PW in a small group; and (c) develop individualized procedures to follow when certain students are not adequately responding to PW at the tier 2 level.
Additionally, it may be helpful for future research and development of PW to consider (a) adapting PW into a one-on-one intervention for use at tier 3, and (b) allowing for
Time management. Time in general was a limitation throughout this study. Specifically, the baseline phases were not as level as they ideally should have been before moving onto the intervention phases; fewer lesson plans were provided than originally planned; lesson plans were cut short; and there was no opportunity for students to makeup lessons missed if they were absent. Despite the interventionists’ fidelity being strong for the lesson plan components that were provided, student participants did not receive all
components of the lesson plans as intended due to some sessions being cut short. Ultimately, the interventionists adhered to the procedural steps in the PW lesson plans as well as they could, but the full dosage of the intervention was not consistently provided to the student participants due to time constraints (Sanetti & Kratochwill, 2009).
Future studies should explore the impact of PW when dosage is increased, and may also examine whether particular components of PW lead to stronger effects. Results of this study suggest some positive outcomes with the intervention components that were
implemented (refer to Table 20). Researchers should consider the importance of balancing resource efficiency with providing appropriate dosage (i.e., intervention sessions and components) to students requiring tier 2 academic intervention.
of Written Language (TOWL; Hammill & Larsen, 1996) has been used in previous SRSD studies; but there are no TOWL norms available for second grade students, meaning it would have been impossible to provide scores for the student participants if the TOWL was used in the current study.
Furthermore, there are general limitations with AWs and PPs that do not just affect this study. Regarding AW specific limitations, all scores from one AW prompt appear to be linked and based on the TWW score; and this is a brief, timed measure of writing fluency that does not strongly coincide with the expected complexities of written expression based on relatively weak criterion-related validities as presented in Table 12. For example, if a student became figuratively stuck while trying to develop ideas for the AW prompt, then the three minute assessment period could pass without the student writing very much (i.e., TWW) and ultimately not capture the student’s skills in written expression.
Regarding PP specific limitations, this is a research-supported measurement tool based directly on SRSD and appears to have only been used by researchers. This tool is used in a vast majority of SRSD published studies; however, a developed manual with
Practical Implications
Despite the aforementioned limitations, there are numerous practical implications to take away from the results of this study. Based on PP data, a majority of students (i.e., approx.70%) made practical improvements in their writing skills over the course of this study, which meets responsiveness expectations based on previous small-group reading research (Begeny et al., 2018) and the RTI framework (Burns et al., 2016). For the purposes of this applied study, PW was provided to general education students who were confirmed to need tier 2 writing instruction by their teachers, during their school day, within their own public school by paraprofessional interventionists. There were promising intervention effects from students receiving PW after a relatively short amount of time, which is notable
considering the applied context for implementation and data collection in this study
PW was developed to translate SRSD research into practice and potentially improve the usability of SRSD. Based on the implementation fidelity results, paraprofessional interventionists were able to successfully implement PW with minimal support, further suggesting PW’s potential usability in classrooms. Although the interventionists were not able to consistently provide all lesson plan components as intended due to time constraints, they were able to maintain high fidelity of the components they had time to provide. This is important for practitioners to consider because student participants generally improved in their writing quality and production despite not having time to provide the entirety of the lesson plans, which is an important finding because many teachers face time restrictions when attempting to provide instruction (New Teacher Center, n.d.).
practice and continued research and development of PW or other intervention strategies that integrate SRSD mnemonics. For example, practitioners using such procedures should carefully examine the extent to which students are able to recall the mnemonics prior to moving to more advanced parts of the writing intervention lessons (e.g., group practice). In the context of the present study and development of PW, the daily embedded progress
monitoring worksheets that specifically document students’ recall of the mnemonics could be helpful for practitioners to assess the students’ grasp of the mnemonics, which is particularly important when utilizing small-group instruction. However, the utility of such worksheets would need to be evaluated in future research.
This study brought to light potential practical challenges with measuring students’ general progress in writing. As discussed above, CBM-WE may not be the ideal tool to measure written expression and it may not be an ideal progress-monitoring tool to use while tracking students’ progress throughout PW or SRSD. Educators and practitioners should consider this limitation of the existing writing assessment scholarship when intervention planning. It is also important to consider that CBM-WE is the only norm-referenced progress monitoring writing tool currently available for practitioners’ use. Future research and
development is needed to build upon this existing measure. Conclusion
REFERENCES
Ardoin, S. P., Wagner, L., & Bangs, K. E. (2016). Applied behavior analysis: A foundation for response to intervention. In S. R. Jimerson, M. K. Burns, & A. M. VanDerHeyden (Eds.), Handbook of response to intervention: The science and practice of multi-tiered systems of support (second edition, pp.29-42). doi:10.1007/978-1-4899-7568-3 Begeny, J. C., Schulte, A. C., & Johnson, K. (2012). Enhancing instructional problem
solving: An efficient system for assisting struggling learners (pp. 3-15). New York, NY: The Guilford Press.
Begeny, J.C., Levy, R.A., & Field, S.A. (2018). Using small-group instruction to improve
students’ reading fluency: An evaluation of the existing research. Journal of Applied
School Psychology, 34, 36-64. doi:10.1080/15377903.2017.1328628
Begeny, J. C., Mann, C. M., Cunningham, M. D., & Tsuen, H. Y. (2009). The helping early literacy with practice strategies (HELPS) curriculum: Instructional passages
developed for use with the HELPS program. Raleigh, NC: Helps Education Fund. Retrieved from http://helpsprogram.org.
Begeny, J. C., Whitehouse, M. H., Methe, S. M., Codding, R. S., Stage, S. A., & Neupert, S. (2015). Do intervention-embedded assessment procedures successfully measure student growth in reading? Psychology in the Schools, 52, 578-293. doi:10.1002/pits Berninger, V. W. (2007). Process Assessment of the Learner: Diagnostic assessment for
reading and writing (2nd ed). San Antonio, TX: Harcourt Assessment, Inc.
(Eds.), Handbook of Learning Disabilities (pp. 345-363). New York, NY: The Guilford Press.
Berninger, V. W., Vaughan, K., Abbott, R. D., Coleman, K. B., Curtin, G., Hawkins, J. M., & Graham, S. (2002). Teaching spelling and composition alone and together: Implications for the simple view of writing. Journal of Educational Psychology, 94, 291-304. doi:10.1037//0022-0663.94.2.291
Briesch, A. M., & Chafouleas, S. M. (2009a). Children’s Usage Rating Profile (Actual). Storrs, CT: University of Connecticut.
Briesch, A. M., & Chafouleas, S. M. (2009b). Exploring student buy-in: Initial development of an instrument to measure likelihood of children’s intervention usage. Journal of Educational and Psychological Consultation, 19, 321-336.
doi:10.1080/10474410903408885
Briesch, A. M., Chafouleas, S. M., Neugebauer, S. R., & Riley-Tillman, C. (2013). Assessing influences on intervention implementation: Revision of the Usage Rating Profile-Intervention. Journal of School Psychology, 51, 81-96. doi:10.1016/j.jsp.2012.08.006 Buffum, A., Mattos, M., & Weber, C. (2009). Pyramid response to intervention: RTI,
professional learning communities, and how to respond when kids don’t learn.
Bloomington, IN: Solution Tree Press.
Chafouleas, S. M., Briesch, A. M., Neugebauer, S. R., & Riley-Tillman, T. C. (2011). Usage Rating Profile – Intervention (Revised). Storrs, CT: University of Connecticut. Cicchetti, D. V. (1994). Guidelines, criteria, and rules of thumb for evaluating normed and
standardized assessment instruments in psychology. Psychological Assessment, 6,
284-290.
Cutler, L. & Graham, S. (2008). Primary grade writing instruction: A national survey.
Journal of Educational Psychology, 100, 907-919. doi:10.1037/a0012656
Denton, C. A. (2012). Response to intervention for reading difficulties in the primary grades: Some answers and lingering questions. Journal of Learning Disabilities, 45(3), 232– 243. doi:10.1177/0022219412442155
Field, A. (2009). Discovering statistics using SPSS (3rd ed.). Thousand Oaks, CA: SAGE Publications Inc.
Fixsen, D. L., Naoom, S. F., Blase, K. A., Friedman, R. M., & Wallace, F. (2005). Implementation research: A synthesis of the literature. Tampa, FL: University of South Florida, Louis de la Parte Florida Mental Health Institute, The National Implementation Research Network (FMHI Publication #231).
Flower, L., & Hayes, J. R. (1981). A cognitive process theory of writing. College
Composition and Communication, 32, 365-387.
Foorman, B. R., & Torgesen, J. (2001). Critical elements of classroom and small-group instruction promote reading success in all children. Learning Disabilities Research & Practice, 16(4), 203-212.
Gansle, K. A., Noell, G. H., VanDerHeyden, A. M., Naquin, G. M., & Slider, N. J. (2002). Moving beyond total words written: The reliability, criterion validity, and time cost of alternate measures for curriculum-based measurement in writing. School Psychology Review, 31, 477-497.
Gansle, K. A., Noell, G. H., VanDerHeyden, A. M., Slider, N. J., Hoffpauir, L. D.,
Whitmarsh, E. L., & Naquin, G. M. (2004). An examination of the criterion validity and sensitivity to brief intervention of alternate curriculum-based measures of writing skill. Psychology in the Schools, 41, 291-300. doi:10.1002/pits.10166
Gansle, K. A., VanDerHeyden, A. M., Noell, G. H., Resetar, J. L., & Williams, K. L. (2006). The technical adequacy of curriculum-based and rating-based measures of written expression for elementary school students. School Psychology Review, 35, 435-450. Garcia-Sanchez, J-N., & Fidalgo-Redondo, R. (2006). Effects of two types of self-regulatory
instruction programs on students with learning disabilities in writing products, processes, and self-efficacy. Learning Disability Quarterly, 29, 181-211.
Gersten, R., Compton, D., Connor, C.M., Dimino, J., Santoro, L., Linan-Thompson, S., & Tilly, W.D. (2008). Assisting students struggling with reading: Response to
Intervention and multi-tier intervention for reading in the primary grades. A practice guide. (NCEE 2009-4045). Washington, DC: National Center for Education
Evaluation and Regional Assistance, Institute of Education Sciences, U.S. Department of Education. Retrieved from http://ies.ed.gov/ncee/wwc/ publications/practiceguides/.
Psychology, 99, 297-310. doi:10.1037/0022-0663.99.2.297
Graham, S. (1999). Handwriting and spelling instruction for students with learning disabilities: A review. Learning Disability Quarterly, 22, 78–98.
Graham, S., Bollinger, A., Booth Olson, C., D’Aoust, C., MacArthur, C., McCutchen, D., & Olinghouse, N. (2012). Teaching elementary school students to be effective writers: A
practice guide (NCEE 2012- 4058). Washington, DC: National Center for Education
Evaluation and Regional Assistance, Institute of Education Sciences, U.S. Department of Education. Retrieved from http://ies.ed.gov/ncee/
wwc/publications_reviews.aspx#pubsearch.
Graham, S., Harris, K. R., & Mason, L. (2005). Improving the writing performance, knowledge, and efficacy of struggling young writers: The effects of self-regulation strategy development. Contemporary Educational Psychology, 30, 207-241. doi:10.1016/j.cedpsych.2004.08.001
Graham, S., McKeown, D., Kiuhara, S., & Harris, K. R. (2012). A meta-analysis of writing instruction for students in the elementary grades. Journal of Educational Psychology, 104, 879-896. doi:10.1037/a0029185
Graham, S., & Perin, D. (2007). A meta-analysis of writing instruction for adolescent students. Journal of Educational Psychology, 99, 445-476. doi:10.1037/0022-0663.99.3.445
Gresham, F. M. (2009). Using response to intervention for identification of specific learning disabilities. In A. Akin-Little, S. G. Little, M. A. Bray, & T. J. Kehle (Eds.),