Clinical Ophthalmology
Assessment of retinal sensitivity using
a time-saving strategy in normal individuals
Hirotaka Suzumura1
Keiji Yoshikawa2
Shiro Mizoue3
Ryoko Hyodo4
Tairo Kimura5
1Eye Department, Nakano General
Hospital, Tokyo, 2Yoshikawa Eye
Clinic, Tokyo, 3Department of
Ophthalmology, Ehime University, Ehime, 4Eye Department, Minami
Matsuyama Hospital, Ehime, 5Ueno
Eye Clinic, Tokyo, Japan
Correspondence: Hirotaka Suzumura Eye Department, Nakano General Hospital, 4-59-16 Chuo, Nakano-ku, Tokyo 164-8607, Japan
Tel +813 3382 1231 Fax +813 3382 1588
Email [email protected]
Background: The purpose of this study was to compare retinal sensitivities in normal
indi-viduals obtained using the Swedish Interactive Threshold Algorithm Standard (SITA-S) on the Humphrey field analyzer with those obtained using the Dynamic strategy on the Octopus.
Methods: Prior to visual field examinations, the background luminance, stimulus size, and
exposure time with the Octopus 101 were conformed to the Humphrey field analyzer II settings. Volunteers over 20 years of age without apparent ophthalmic abnormalities were examined with the SITA-S central 30-2 program followed by the Dynamic 32 program. Eye with corrected visual acuity $ 0.8, refraction $−6.0 diopters, and fields with satisfactory levels of reliability in SITA-S and Dynamic were selected.
Results: Sixty-seven eyes from 67 normal individuals of mean age 51.3 ± 16.3 (range
22–76) years satisfied the selection criteria and were analyzed. Mean retinal sensitivity was significantly (P , 0.0001) higher with SITA-S (29.0 ± 2.4 dB) than with Dynamic (26.8 ± 2.1 dB). Changes in retinal sensitivity with increasing age were significantly (P = 0.0003) greater with Dynamic (−0.09 ± 0.04 dB/year; 95% confidence interval [CI] −0.10 to −0.08 dB/year) than with SITA-S (−0.07 ± 0.04 dB/year, 95% CI −0.08 to −0.06 dB/year). When classifying the visual field into three areas (central, mid-peripheral, and peripheral), retinal sensitivities with SITA-S were significantly higher in all areas than with Dynamic (P , 0.0001 for all three areas).
Conclusion: Differences in Dynamic and SITA-S strategies may contribute to the differences
in retinal sensitivities observed in normal individuals.
Keywords: time-saving strategy, frequency-of-seeing curve, dynamic, Swedish Interactive
Threshold Algorithm Standard, Octopus perimeter, Humphrey field analyzer
Introduction
In automated perimetry, the stimulus intensity at prescribed testing locations is changed in order to determine the perceptible limit of stimulus intensity (threshold), which is the retinal sensitivity. Subsequently, the retinal sensitivity distribution at the test locations is determined in order to complete the assessment of the visual field. Standard automated perimetry is a psychophysical test that is designed to determine the retinal sensitivity by checking the subject’s responses. Because standard automated perimetry involves many stimulus presentations, much time is needed to complete the test,1 this can be tiring for patients and can lead to a higher error rate. In order to
shorten the test duration, standard automated perimetry uses a suprathreshold method that can make use of precollected data for normal retinal sensitivity in order to optimize the initially displayed thresholds at the test locations. Despite this design, standard
Dove
press
O R i G i N A L R E S E A R C H open access to scientific and medical research
Open Access Full Text Article
Clinical Ophthalmology downloaded from https://www.dovepress.com/ by 118.70.13.36 on 21-Aug-2020
For personal use only.
Number of times this article has been viewed
This article was published in the following Dove Press journal: Clinical Ophthalmology
automated perimetry typically requires presentation of about 600 stimuli and 15–20 minutes for evaluating the central visual field, thus often causing significant psychophysical overload on the subject.2 If the frequency of the stimulus
crossings of the threshold of each test location is reduced markedly, the test duration can be shortened significantly, but obvious decreases in accuracy of the visual field sensitivity
have been reported.3
To ensure a shortened test duration and preserved accu-racy of the test concurrently, several time-saving strategies for presenting stimuli that take into account the
frequency-of-seeing curve have been developed.4,5 Examples of these
strategies are the Dynamic strategy (Dynamic)6 and the
Swedish Interactive Threshold Algorithm (SITA) strategy.7
The Dynamic resembles the conventional suprathreshold method when applied to relative normal retinal sensitivity points. However, for depressed retinal sensitivity points with a more shallow slope of frequency-of-seeing curve or retinal points that are expected to exhibit such a feature, the Dynamic enables a reduction in the number of stimulus presentations by expanding the interval between two
subse-quent thresholds compared with the conventional method.8
In SITA, the number of stimulus presentations is reduced by starting the stimulus presentation based on predictions of the sensitivity level corresponding to 50% of the frequency-of-seeing curve for each test location using normal and glaucoma-affected visual field models and statistical meth-ods applying Bayes’ theorem and the maximum likelihood
method. Both strategies have been used clinically.9 Although
possible differences between the two strategies may affect assessment of retinal sensitivity, data on the normal retinal sensitivities in subjects of different age groups have not been determined for either SITA or Dynamic. Therefore, we evaluated the retinal sensitivities of normal individuals using both strategies and analyzed the effect of the differ-ences observed between the retinal sensitivities measured using the two strategies.
Patients and methods
Participants
The study was performed according to the Declaration of Helsinki and approved by the Nakano General Hospital institutional review board. Subjects aged 20 years or older and who gave their informed consent to participate in this study were recruited at Nakano General Hospital, Yoshikawa Eye Clinic, Minami Matsuyama Hospital, and Ueno Eye Clinic between October 2009 and March 2010.
Methods
Patients who visited the abovementioned clinics and who fully met the following requirements were asked to participate in this study: corrected visual acuity $ 0.8;
spheri-cal equivalent of $−6.0 diopters; and absence of disease of
the anterior segment, optic media, and fundus, other than mild cataracts, which could markedly affect visual field when assessed in ophthalmic examinations; absence of evi-dent systemic disease, including the disease currently being treated or its history as revealed by interview; and absence of evident visual field abnormalities in preliminary testing of the visual field using a SITA Standard (SITA-S) central 30-2 (C30-2) with a Humphrey Field Analyzer II (HFA II; Carl Zeiss Meditec, Dublin, CA).
Ophthalmological evaluation
Within three days of the preliminary test, each subject received visual field tests with the following two methods on the same day: Dynamic with the Octopus 101 (Octopus, Haag-Streit AG, Koniz, Switzerland) computer-automated perimeter and SITA-S with the HFA II. The programs used for measurement were 32 with Dynamic in the Octopus and C30-2 with SITA-S in the HFA II. Visual field testing was first conducted on the right eye, with SITA-S initially and Dynamic thereafter. The test was subsequently performed on the left eye in the same way. Subjects were allowed to rest for at least 15 minutes between the two sequential visual field test sessions, and the next testing began only after subject recovery had been confirmed. After the visual field tests, intraocular pressure was measured using a Goldmann appla-nation tonometer (Haag-Streit AG, Koniz, Switzerland).
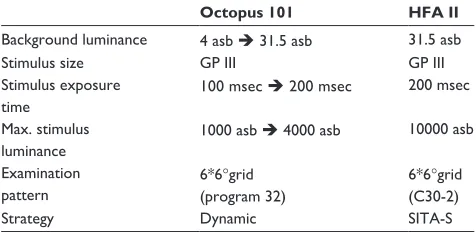
Prior to the test with Dynamic, the background inten-sity of Octopus 101 was changed from 4 apostilbs to 31.5 apostilbs, the stimulus exposure time was changed from 0.1 sec to 0.2 sec, and the maximum stimulus intensity was
Table 1 Examination conditions
Octopus 101 HFA II
Background luminance 4 asb 31.5 asb 31.5 asb
Stimulus size GP iii GP iii
Stimulus exposure time
100 msec 200 msec 200 msec
Max. stimulus luminance
1000 asb 4000 asb 10000 asb
Examination pattern
6*6°grid (program 32)
6*6°grid (C30-2)
Strategy Dynamic SiTA-S
Note: Arrows indicate what settings were changed to match stimulus parameters.
Abbreviations: HFA, Humphrey field analyzer; GP, Goldmann perimeter; C30-2, Central 30-2; SITA-S, SITA-Standard.
Dovepress
Suzumara et al
Clinical Ophthalmology downloaded from https://www.dovepress.com/ by 118.70.13.36 on 21-Aug-2020
changed from 1000 apostilbs to 4000 apostilbs. The size of the stimulus was unchanged. The Octopus Goldmann size 3 and HFA II size III have the same visual angle, so served as a standard stimulus for both Dynamic and SITA (Table 1).
Data analysis
If the visual field data from a subject showed any fixation loss or false-positive errors or false-negative errors that were more frequent than 33%, the data were excluded. The actual retinal sensitivities of the 74 points, excluding two points corresponding to the Mariotte blind spot, were examined in Dynamic and SITA-S in order to compare the results. In addition, the rates of change in retinal sensitivities by age were calculated. For all eyes of the study subjects, data from the left eye were converted to those from the right eye for analysis. All 74 test locations were divided into the
fol-lowing: the central region (,10 degrees, 12 locations); the
mid-peripheral region (10–20 degrees, 18 locations); and the peripheral region (20–30 degrees, 44 locations) in order to compare the retinal sensitivities in Dynamic and SITA-S. We used t-tests and Dunn’s test to compare the retinal sensitivities and to estimate the parameters for correlation (regression analysis). The JMP 9.0.0 (SAS Institute, Tokyo, Japan) com-puter program was used for the statistical analyses. Statistical
significance was defined as P values , 0.05.
Results
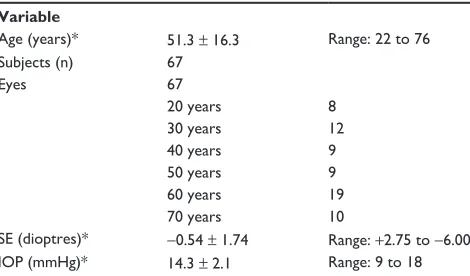
Of the 134 eyes from the 67 subjects who gave informed consent for the study, 67 eyes of 67 subjects (32 men and 35 women) met the reliability criteria in at least one eye based on the tests (Table 2). The mean retinal sensitivities of the subjects studied ranged from 19.0 dB to 30.6 dB in Dynamic and from 22.2 dB to 32.7 dB in SITA-S. The mean retinal sensitivity for all 74 locations was significantly depressed in Dynamic
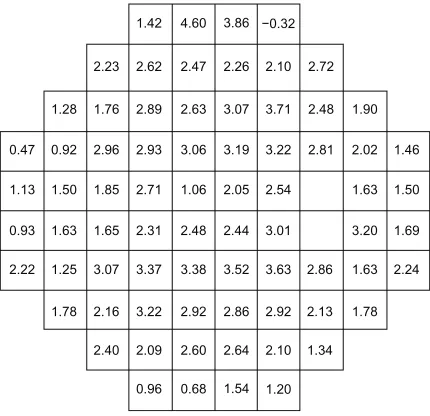
com-pared with SITA-S (Figure 1). Of the corresponding test loca-tions between Dynamic and SITA-S, 73 localoca-tions, except for one point at the superotemporal peripheral area, showed higher retinal sensitivities in SITA-S than in Dynamic (Figure 2).
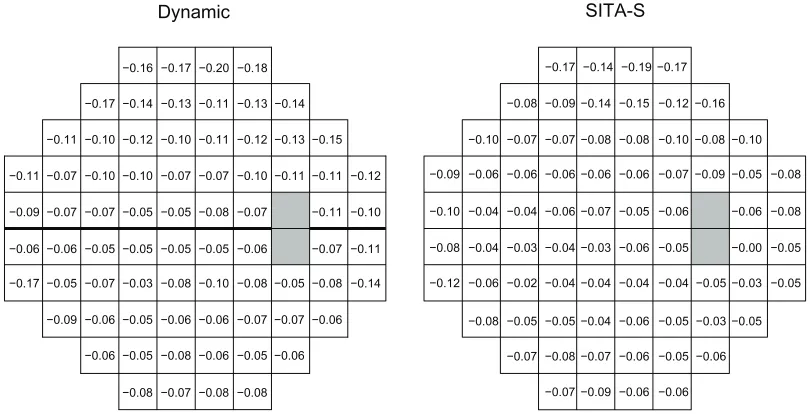
Correlations of the mean retinal sensitivities at each test location (measured with Dynamic and SITA-S) with age were analyzed, and the rate of change in mean sensitivities was calculated as a function of age. The mean change in retinal sensitivity depending on age (regression coefficient) was sig-nificantly different between the two strategies (Figure 3).
The mean retinal sensitivity in each three region (central, mid-peripheral, and peripheral) in SITA-S was significantly higher than that in Dynamic (Figure 4). However, no signifi-cant difference in retinal sensitivities was observed between the central and mid-peripheral regions, whereas retinal sen-sitivity in the peripheral region was significantly depressed compared with that in the central and mid-peripheral regions in Dynamic and SITA-S.
Discussion
When the retinal sensitivities of normal individuals were mea-sured using two time-saving strategies, Dynamic and SITA-S. The sensitivity distributions differed between two strategies, reflecting the differences between them. Glaucomatous visual field disturbances was found earlier with Dynamic than with
SITA-S10 when the original settings for the Octopus and the
HFA were used. It is known that retinal sensitivity is affected
by factors such as stimulus exposure time,11 stimulus size,12
retinal adaptation,13 eccentricity of the test location,14 and
subject reliability.15 Therefore, we tried to compare
differ-ences in retinal sensitivities between the two strategies under an identical HFA and Octopus settings. When the standard automated perimetry settings are changed, age-specific normal values and ranges should be determined. Thus, we recruited normal individuals aged 20–80 years to investigate the effects of the differences in strategies on retinal sensitivities.
In the visual field test, the mean retinal sensitivities ranged from 19.0 dB to 30.6 dB with Dynamic and from 22.2 dB to 32.7 dB when measured with SITA-S. A comparison of the mean retinal sensitivities at the corresponding test locations between the two strategies revealed the following results: mean retinal sensitivity in SITA-S was higher by 2.2 dB than that in Dynamic; and mean retinal sensitivities for each test location were significantly higher with SITA-S than with Dynamic, except for one point in the superotemporal area. In this test, because the same maximum stimulus intensity could not be used for both the Octopus and the HFA, the dynamic ranges were different16 and the retinal sensitivity at each
Table 2 Patient demographics
Variable
Age (years)* 51.3 ± 16.3 Range: 22 to 76 Subjects (n) 67
Eyes 67
20 years 8
30 years 12
40 years 9
50 years 9
60 years 19
70 years 10
SE (dioptres)* −0.54 ± 1.74 Range: +2.75 to −6.00 iOP (mmHg)* 14.3 ± 2.1 Range: 9 to 18 Note: *Value is presented as the mean ± standard deviation.
Abbreviations: SE, spherical equivalent; IOP, intraocular pressure.
Dovepress Time-saving assessment of retinal sensitivity
Clinical Ophthalmology downloaded from https://www.dovepress.com/ by 118.70.13.36 on 21-Aug-2020
point measured with the HFA II and with the Octopus were estimated to differ by 4 dB. However, the retinal sensitivities
detected with SITA-S (29.0 ± 2.4 dB) differed by just 2.2 dB
from those with Dynamic (26.8 ± 2.1 dB). One of possible
reasons for this difference (between 4 dB and 2.2 dB) was
artifactual differences. However, the artifactual difference was not thought to affect the difference in retinal sensitivity observed in this study significantly because all subjects under-went a preliminary visual field test and were given sufficient time between the main tests conducted with the Octopus and the HFA to avoid subject fatigue. Therefore, we believe that measured differences between retinal sensitivity results using the two different testing modalities and strategies may have been caused by factors unrelated to intrasubject variability and measurement conditions.
Differences in setting of the frequency-of-seeing curve between the strategies may play a role in the differences in the algorithm results; in SITA-S, the measurement sensitivity
represents a lower value than an expected value.7 In contrast,
in Dynamic, the variance is small at normal locations, and the stimulus intensity steps become narrower,8,17 whereas
the stimulus intensity steps become broader at locations
with large variances,8 and this leads to overestimation of the
retinal sensitivity. Therefore, we suggest that these strategies, including differences in frequency-of-seeing curve settings, caused the differences between the theoretical values and the actual values in the present study.
The ages of the subjects and locations of test points have been reported to affect frequency-of-seeing curve settings.18,19
Thus, we examined changes in retinal sensitivities by age. SITA-S was less affected by age than Dynamic. We thought that adjustments according to Bayes’ theorem in SITA-S
22.3 19.4 6.4 19.0 6.1 22.9 5.1 5.9 23.7 24.0 5.3 22.8 6.6 22.5 7.2 5.8 23.5 4.9 24.5 4.3 24.8 4.1 25.2 4.3 26.5 3.6 26.4 3.9 27.1 3.6 26.3 3.1 25.6 4.2 26.2 3.7 25.8 3.9 26.5 3.9 28.3 2.6 29.3 2.5 29.7 2.5 29.4 2.6 29.3 2.8 28.7 2.5 27.7 3.4 25.0 4.3 27.1 3.5 27.2 3.3 28.4 2.7 28.2 2.6 27.6 2.7 25.7 3.5 27.3 3.0 25.7 2.9 27.3 2.9 25.9 3.3 27.6 2.8 23.9 5.9 27.4 2.8 27.6 2.9 28.8 2.3 28.5 2.8 28.3 2.9 28.4 3.1 28.0 2.4 28.2 2.7 26.6 4.8 26.2 4.7 28.7 2.7 30.7 2.9 32.2 1.7 31.8 1.7 31.8 1.8 32.0 1.9 30.8 2.1 29.8 1.9 28.9 2.7 28.0 2.9 28.0 2.3 28.1 2.8 28.5 2.4 27.7 2.8 27.6 2.7 27.7 4.2 29.7 2.1 30.9 2.1 30.8 2.1 31.0 2.2 30.6 2.5 29.4 3.0 30.8 2.0 27.8 3.6 29.1 2.7 29.7 2.5 29.7 2.7 28.7 3.3 28.6 3.4 26.7 4.4 28.2 2.7 28.2 3.1 26.3 4.5 Mean Dynamic SITA-S SD 25.4 3.6 26.5 3.4 27.0 2.9 27.6 2.6 27.4 2.4 26.5 3.3 26.0 3.3 26.6 2.9 27.0 3.3 25.4 3.5 29.7 2.5 29.3 2.4 30.3 2.3 30.2 2.2 28.7 2.9 27.1 4.3 27.4 3.4 29.1 2.6 29.4 2.4 30.6 2.6 30.2 2.7 28.7 2.9 27.6 3.6 27.3 3.6 26.8 3.7 28.8 2.4 31.0 1.9 32.1 1.9 32.1 4.1 32.2 1.9 31.2 2.3 29.2 3.9 28.8 3.7 26.7 4.0 29.0 2.1 31.4 2.4 31.6 3.6 32.7 2.0 32.6 1.9 31.7 2.1 30.3 2.1 29.1 2.7 27.2 3.2 26.8 3.4 26.9 2.9 26.4 3.5 25.1 4.9 28.0 2.7 30.1 2.3 31.3 2.0 31.2 2.0 30.8 2.0 30.5 2.3 29.6 2.6 29.0 2.1 27.9 3.6 24.1 4.1 24.3 4.3 23.8 4.8 25.7 4.1 27.1 3.0 27.2 4.3 26.4 5.0 26.4 3.9 26.5 4.8
Figure 1 Mean retinal sensitivities at each test point in Dynamic and SiTA-S.
Notes: Retinal sensitivities were similarly distributed both in Dynamic and in SiTA-S. Mean retinal sensitivity at each test point in 67 eyes that were assessed by SiTA-S (29.0 ± 2.4 dB) was higher than that by Dynamic (26.8 ± 2.1 dB, Student’s t-test =6.0493, P, 0.0001). Both mean retinal sensitivity (upper value) and standard deviation (lower value) are presented.
Abbreviations: SITA-S, Swedish Interactive Threshold Algorithm-Standard; mean, mean retinal sensitivity; SD, standard deviation.
1.42 4.60 3.86 −0.32
2.23 2.62 2.47 2.26 2.10 2.72
1.76
1.28 2.89 2.63 3.07 3.71 2.48 1.90
2.96 0.92
0.47 2.93 3.06 3.19 3.22 2.81 2.02 1.46
1.85 1.50
1.13 2.71 1.06 2.05 2.54
1.65 1.63
0.93 2.31 2.48 2.44 3.01
3.07 1.25
2.22 3.37 3.38 3.52 3.63 2.86 1.63 2.24
2.16
1.78 3.22 2.92 2.86 2.92 2.13 1.78
2.40 2.09 2.60 2.64 2.10 1.34
0.96 0.68 1.54 1.20
3.20 1.69 1.63 1.50
Figure 2 Differences between Dynamic and SiTA-S in retinal sensitivities at each test point.
Notes: With the exception of one point in the superotemporal periphery, 73 measurements were higher using the SiTA-S. On average, SiTA-S measurements were 2.2 ± 0.9 dB (range −0.7 to 4.6 dB) higher than Dynamic measurements (paired
t-test = 21.5711, P, 0.0001).
Abbreviations: SiTA-S, Swedish interactive Threshold Algorithm-Standard.
Dovepress
Suzumara et al
Clinical Ophthalmology downloaded from https://www.dovepress.com/ by 118.70.13.36 on 21-Aug-2020
minimized the effects of age on frequency-of-seeing curve slope settings, and this was reflected in the test results from nor-mal individuals in the present study. The regression coefficients for retinal sensitivity by age in Dynamic (−0.09 ± 0.04 dB/year) and SITA-S (−0.07 ± 0.04 dB/year) were similar to those (about −0.1 dB/year) previously reported,18,20,21 and there was
not overlap of 95% CIs for the regression coefficients and they
showed a significant difference. This suggests that the effects of age on the frequency-of-seeing curve lower the retinal sensitivity in Dynamics.
We classified the central 30-degree visual field into three regions in order to compare the retinal sensitivities at each location for both strategies. The retinal sensitivities with Dynamic were lower in all regions than those with SITA-S.
−0.16 −0.17
Dynamic SITA-S
−0.20 −0.18 −0.17 −0.14 −0.19 −0.17
−0.09
−0.08 −0.14 −0.15 −0.12 −0.16
−0.07 −0.07
−0.10 −0.08 −0.08 −0.10 −0.08 −0.10
−0.06 −0.06 −0.06
−0.09 −0.06 −0.06 −0.07 −0.09 −0.05 −0.08
−0.06 −0.04 −0.04
−0.10 −0.07 −0.05 −0.06 −0.06 −0.08
−0.04 −0.03 −0.04
−0.08 −0.03 −0.06 −0.05 −0.00 −0.05
−0.04 −0.02 −0.06
−0.12 −0.04 −0.04 −0.04 −0.05 −0.03 −0.05
−0.05 −0.05
−0.08 −0.04 −0.06 −0.05 −0.03 −0.05
−0.08
−0.07 −0.07 −0.06 −0.05
−0.07 −0.09 −0.06 −0.06 −0.06 −0.14
−0.17 −0.13 −0.11 −0.13 −0.14
−0.12 −0.10
−0.11 −0.10 −0.11 −0.12 −0.13 −0.15
−0.10 −0.10 −0.07
−0.11 −0.07 −0.07 −0.10 −0.11 −0.11 −0.12
−0.05 −0.07 −0.07
−0.09 −0.05 −0.08 −0.07 −0.11 −0.10
−0.05 −0.05 −0.06
−0.06 −0.05 −0.05 −0.06 −0.07 −0.11
−0.03 −0.07 −0.05
−0.17 −0.08 −0.10 −0.08 −0.05 −0.08 −0.14
−0.05 −0.06
−0.09 −0.06 −0.06 −0.07 −0.07 −0.06
−0.05
−0.06 −0.08 −0.06 −0.05 −0.06
−0.08 −0.07 −0.08 −0.08
Figure 3 Effect of age on retinal sensitivity (regression coefficients in dB/year) at each test point.
Notes: The mean regression coefficient across all 74 measurement points was −0.09 ± 0.04 dB/year (95% confidence interval [CI] −0.10 to −0.08 dB/year) in Dynamic
and −0.07 ± 0.04 dB/year (95% CI −0.08 to −0.06 dB/year) in SITA-S. There was a significant difference between regression coefficients in Dynamic and in SITA-S (paired
t-test = 6.2042, P, 0.0001).
Abbreviations: SITA-S, Swedish Interactive Threshold Algorithm-Standard; CI, confidence interval.
35
(dB)
30
25
20
15
Center
Retinal sensitivities
Mid-periphery Periphery
: Dynamic : SITA-S
Figure 4 Regional comparison of retinal sensitivity as measured with Dynamic and SiTA-S.
Notes: in the central area, the mean retinal sensitivity was 31.8 ± 0.6 dB in SiTA-S and 29.2 ± 1.0 dB in Dynamic (paired t-test = 16.4476, P, 0.0001). in the mid-peripheral area, mean retinal sensitivity was 30.6 ± 0.9 dB in SiTA-S and 27.7 ± 1.0 dB in Dynamic (paired t-test = 24.2905, P, 0.0001). in the peripheral area, mean retinal sensitivity was 27.6 ± 1.9 dB in SiTA-S and 25.8 ± 2.1 dB in Dynamic (paired t-test = 13.8011, P, 0.0001). The differences in retinal sensitivities between Dynamic and SiTA-S were 2.7 ± 0.6 dB in the central, 2.9 ± 0.5 dB in the mid-peripheral, and 1.9 ± 0.9 dB in the peripheral region. There was no significant difference in mean retinal sensitivities between the
central and mid-peripheral regions (Dunn’s test = 0.8596, P= 1.0000), whereas the retinal sensitivity in the peripheral region was significantly depressed compared with that in
the central and mid-peripheral regions (central versus peripheral, Dunn’s test =−3.1705, P= 0.0046; mid-peripheral versus peripheral, Dunn’s test =−4.8491, P, 0.0001).
Abbreviation: SiTA-S, Swedish interactive Threshold Algorithm-Standard.
Dovepress Time-saving assessment of retinal sensitivity
Clinical Ophthalmology downloaded from https://www.dovepress.com/ by 118.70.13.36 on 21-Aug-2020
Clinical Ophthalmology
Publish your work in this journal
Submit your manuscript here:http://www.dovepress.com/clinical-ophthalmology-journal
Clinical Ophthalmology is an international, peer-reviewed journal covering all subspecialties within ophthalmology. Key topics include: Optometry; Visual science; Pharmacology and drug therapy in eye diseases; Basic Sciences; Primary and Secondary eye care; Patient Safety and Quality of Care Improvements. This journal is indexed on
PubMed Central and CAS, and is the official journal of The Society of Clinical Ophthalmology (SCO). The manuscript management system is completely online and includes a very quick and fair peer-review system, which is all easy to use. Visit http://www.dovepress.com/ testimonials.php to read real quotes from published authors.
However, the difference in the peripheral region was smaller than that in the central region and in the mid-peripheral region. In the peripheral region, the discrepancy between the theoretical and actual retinal sensitivity was greater than in other regions. There was more variability in responses in the peripheral area (due to greater scattering), resulting in smaller differences between the retinal sensitivities with Dynamic, in which the slope of the frequency-of-seeing curve was more shallow, and those with SITA-S, in which the slope of the fre-quency-of-seeing curve was steeper. Moreover, in Dynamic, after the stimulus had crossed the threshold just once, the final retinal sensitivity was determined as the mean between the last seen and the last nonseen stimulus. In contrast, in SITA-S, after the stimulus had crossed the threshold twice, the final retinal sensitivity was determined as the last seen stimulus. The impact of these differences in determining final retinal
sensitivity is, at most, approximately 1 dB.22 This is smaller
than the 2.2 dB difference that we found between the two strategies. Therefore, we believe this sensitivity difference of 2.2 dB is due to the frequency-of-seeing curve settings with the two strategies.
We hypothesize that the final mean observed retinal sen-sitivity is likely to be higher in Dynamic and lower in SITA-S, and differences in Dynamic and SITA-S strategies may contribute to the differences in observed retinal sensitivities in normal individuals.
Acknowledgment
We are grateful for the assistance of Matthias Monhart for arranging the conditions in the Octopus perimeter for this study.
Disclosure
The authors report no conflicts of interest in this work.
References
1. Wild JM, Pacey IE, O’Neill EC, Cunliffe IA. The SITA perimet-ric threshold algorithms in glaucoma. Invest Ophthalmol Vis Sci. 1999;40(9):1998–2009.
2. Zulauf M, Caprioli J, Boeglin RJ, Lee M. Number of stimuli as a reli-ability parameter in perimetry. Ger J Ophthalmol. 1992;1(2):86–90.
3. Glass E, Schaumberger M, Lachenmayr BJ. Simulations for FASTPAC and the standard 4-2 dB full-threshold strategy of the Humphrey Field Analyzer. Invest Ophthalmol Vis Sci. 1995;36(9):1847–1854. 4. Chauhan BC, Tompkins JD, LeBlanc RP, McCormick TA. Characteristics
of frequency-of-seeing curves in normal subjects, patients with sus-pected glaucoma, and patients with glaucoma. Invest Ophthalmol Vis Sci. 1993;34(13):3534–3540.
5. Weber J, Rau S. The properties of perimetric thresholds in normal and glaucomatous eyes. Ger J Ophthalmol. 1992;1(2):79–85.
6. Weber J. A new strategy for automated static perimetry. Fortschr Ophthalmol. 1990;87(1):37–40. German.
7. Bengtsson B, Olsson J, Heijl A, Rootzen H. A new generation of algo-rithms for computerized threshold perimetry, SITA. Acta Ophthalmol Scand. 1997;75(4):368–375.
8. Weber J, Klimaschka T. Test time and efficiency of the dynamic strategy in glaucoma perimetry. Ger J Ophthalmol. 1995;4(1):25–31. 9. Bengtsson B, Heijl A, Olsson J. Evaluation of a new threshold visual
field strategy, SITA, in normal subjects. Acta Ophthalmol Scand. 1998;76(2):165–169.
10. Langerhorst CT, Carenini L, Bakker D, van den Berg TJTP, de Bie-Raakman MAC. Comparison of SITA and Dynamic strategies with same examination grid. In: Wall M, Wild JM, editors. Perimetry Update 1998/99. The Hague, The Netherlands: Kugler Publications; 1999. 11. Krakau CE. Temporal summation and perimetry. Ophthalmic Res.
1989;21(1):49–55.
12. Redmond T, Garway-Heath DF, Zlatkova MB, Anderson RS. Sensitivity loss in early glaucoma can be mapped to an enlargement of the area of complete spatial summation. Invest Ophthalmol Vis Sci. 2010;51(12):6540–6548.
13. Johnson CA, Keltner JL, Balestrery FG. Static and acuity profile perimetry at various adaptation levels. Doc Ophthalmol. 1981;50(2):371–388. 14. Heijl A, Lindgren G, Olsson J. Normal variability of static perimetric
threshold values across the central visual field. Arch Ophthalmol. 1987;105(11):1544–1549.
15. Katz J, Sommer A, Gaasterland DE, Anderson DR. Comparison of analytic algorithms for detecting glaucomatous visual field loss. Arch Ophthalmol. 1991;109(12):1684–1689.
16. Anderson DR. Automated Static Perimetry. St Louis, MO: Mosby; 1992. 17. Zulauf M, Fehlmann P, Flammer J. Perimetry with the standard Octopus
bracketing procedure compared to the ‘dynamic strategy’ of Weber – preliminary findings on the reproducibility of the measurements in glaucoma. Ophthalmologe. 1996;93(4):420–427.
18. Jaffe GJ, Alvarado JA, Juster RP. Age-related changes of the normal visual field. Arch Ophthalmol. 1986;104(7):1021–1025.
19. Wall M, Kutzko KE, Chauhan BC. Variability in patients with glau-comatous visual field damage is reduced using size V stimuli. Invest Ophthalmol Vis Sci. 1997;38(2):426–435.
20. Béchetoille A, Dykman P, Muratet JY. Data bank for analysis of the normal visual field using the 30/1 central program of the automated Humphrey perimeter. J Fr Ophtalmol. 1986;9(12):837–841. French. 21. Iwase A, Kitazawa Y, Ohno Y. On age-related norms of the visual field.
Jpn J Ophthalmol. 1988;32(4):429–437.
22. Fankhauser F, Bebie H, Flammer J. Threshold fluctuations in the Hum-phrey field analyzer and in the Octopus automated perimeter. Invest Ophthalmol Vis Sci. 1988;29(9):1466.
Dovepress
Dove
press
Suzumara et al
Clinical Ophthalmology downloaded from https://www.dovepress.com/ by 118.70.13.36 on 21-Aug-2020