Characterisation of the behaviour of welded aluminium
structures under dynamic loading
Huon Bornstein1,*, Brodie McDonald1,2, Emily Frain1, Daniel De Oliveira Damas1, Eric Yang2 and Norman Herzig3 1Defence Science and Technology Group, 506 Lorimer St Fishermans Bend 3207, Australia
2RMIT University, Melbourne 3001, Australia
3Nordmetall Material and Impact Engineering, Adorfer Hauptstrasse 16, 09221 Neukirchen, Germany
Abstract. The presence and quality of welds in metallic structures has the ability to influence their likelihood of failure under dynamic loading. This investigation focused on characterising the behaviour of a welded aluminium structure. Samples were taken from the parent metal, heat affected zone (HAZ) and the weld bead and high strain rate characterisation testing was performed to determine the Johnson-Cook (JC) strength and failure model parameters for each material. However, significant scatter was found in the data for the weld bead due to porosity within the samples. Additional tensile tests were performed using a rotating fly wheel machine with four larger samples, which were machined from the welded aluminium structure and contained HAZs on either side of the weld bead, located in the centre of the specimen. Three of the four samples had the weld bead ground flush to the level of the base plate. Digital image correlation was used to determine the surface strain within each region of the sample and identified significant strain localisation at the interface between the weld metal and the HAZ, as well as within the weld bead. Comparisons between the ground welded specimens and those with the weld reinforcement showed a different failure mode between the two specimens. For the ground specimens, the strain localisation in the weld bead initiated failure prior to the strain localisation occurring at the interface between the weld bead and HAZ. Sectioning of the welds indicated that the strain localisation in the weld bead may have been caused by significant levels of porosity within the weld bead. Preliminary numerical simulations of the ground specimens indicated that the force-time history could be well captured. However, as the strain localisation due to porosity is not captured using a JC model, in addition to the scatter in the characterisation data for the weld bead, failure was not accurately predicted numerically.
1 Introduction
Aluminium alloys may be used in military platforms due to the relative cost of the material and the advantages aluminium can offer in reducing the overall mass of the platform. The majority of these platforms use welded joints, and hence, there is a requirement to understand the response of welded aluminium structures that are subjected to loading at high strain rates, such as under blast or impact loading.
Fusion welding relies on melting of the weld consumable and localised melting of the parent plate to join materials. The process imparts heat into the parent plate, which alters the microstructure and properties of the material adjacent to the weld, resulting in the region known as the heat affected zone (HAZ). Consequently, even welded structures consisting of a single alloy are non-homogenous with respect to material properties; this inhomogeneity can be broadly categorised into weld metal, the HAZ, and the parent metal. Fig. 1 shows a diagram of a typical double-sided butt weld in a plate where the three zones have been identified.
Fusion welds in marine-grade aluminium are often under-matched (i.e. they have lower strength than the parent plate), and it is common for the proof strength of the HAZ to be 30% to 50% lower than the proof strength of the parent plate [1]. However, the weld consumable in other applications may have a higher strength than the parent plate, which results in the HAZ also having a higher strength than the parent plate [2,3].
findings when characterising the combined behaviour of the HAZ and weld metal from overmatched steel fillet welds. Whilst the strength of the weld metal and HAZ was higher than the parent plate, they noted a significant reduction in the failure strain for the weld metal and HAZ. When assessing their samples to impact loading, they assessed the strain field using digital image correlation (DIC) and clearly observed strain localisation within the welded region that led to failure of the specimen. These investigations highlight the importance of including the properties of the weld metal and HAZ in an engineering analysis, but there are presently very few published studies where the failure of welded joints under dynamic loading is modelled.
Fig. 1. Simplified diagram of the three regions of a double sided butt weld.
This investigation looks into the performance of a welded aluminium joint from a maritime structure under tensile loading, to understand the strain distribution and failure of the joint. The properties of the weld metal, HAZ and parent metal are characterised and fit to constitutive models. These constitutive models are then implemented in numerical simulations of the tensile tests on the welded joints to assess the ability of this approach to capture the performance of the welded aluminium structure.
2 Tensile Tests on Welded Coupons
2.1 Tensile Test Setup
A series of four tensile tests were conducted using specimens fabricated from a 6 mm thick butt-welded aluminium structure that was a non-structural component on a naval vessel. The specimens were large dog bone samples with the weld centred on the 40 mm gauge length. For three (of four) tests, the weld reinforcement was ground flush to the plate. All tests were conducted on a rotating wheel machine at a speed of 1 m/s. The nominal strain rate in the sample at this speed is 25 s-1.
The edge of the specimen was painted with a speckle pattern, and a high-speed camera was used to observe the specimen during the tests. DIC was used to assess the 2D strain field across the edge of the specimen. The use of the DIC technique across the welded specimen allows the difference in the strains within the weld metal, the HAZ and the parent metal to be captured. In addition, the technique provides valuable data for comparison with numerical simulations.
Fig. 2. Large dog bone specimen used in welded tensile test. Note: Specimen is shown post-test.
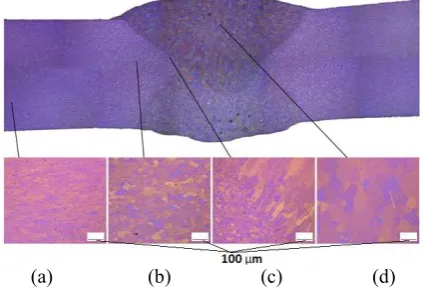
An evaluation of the microstructure of each region of the sample was performed and the results are shown in Fig. 3. The section was electrolytically etched in Barker’s reagent (5 g HBF4, 200 ml water using a stainless steel cathode) and viewed using polarised light with a sensitive tint plate. The aluminium grains in the Al 5083-H116 parent plate are small and elongated (aligned with the rolling direction). The structure consists of alpha phase grains and intermetallic inclusions. The microstructure of the HAZ consists of larger, more equiaxed alpha grains. At the fusion boundary (the boundary between the HAZ and the weld metal), the weld metal grains are columnar in the direction of solidification. The weld metal has a cast microstructure and the dendritic features of solidification are observable in the large grains. In addition, a hardness traverse across the welded specimen identified that the size of the HAZ was 10 mm on each side of the weld bead.
(a) (b) (c) (d)
Fig. 3. Microstructure of welded aluminium coupon. (a) parent plate (b) HAZ (c) fusion boundary (d) weld metal.
2.2 Tensile Test Results
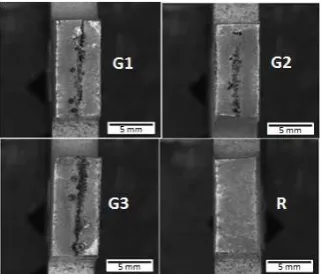
The engineering stress-strain curves for the four tests are shown in Fig. 4. Whilst the strength of all four samples is similar, there is a noticeable difference in the engineering failure strain of the specimen with weld reinforcement (~0.20) when compared to the ground specimens (average of 0.13). Fig. 5 shows the differences in failure location between the ground and weld reinforced samples. For the ground samples, failure always occurred within the weld metal, whereas failure was found to occur at the interface between the weld metal and the HAZ in the sample with weld reinforcement. In all tests, the failure appearance was slant fracture, which is characteristic of deformation and failure in the plane of maximum shear stress. There was significant scatter in the failure strain of ground
specimens, which was found to be due to varying levels of porosity within the sample (Fig. 6).
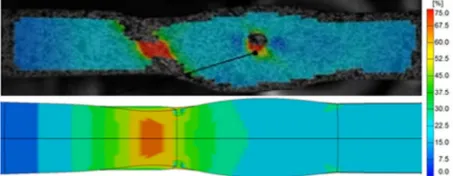
The DIC analysis showed strain localisation in the weld bead for all specimens. In the specimen with weld reinforcement, there was a second band of strain localisation at the interface between the weld bead and the HAZ (Fig. 7). This region of strain localisation resulted in failure of the specimen within this region of the sample. This indicated that the additional weld metal was able to compensate for the effects of the porosity within the weld bead and change the location of failure within the sample. As Fig. 6 presents the section along the failure plane, the porosity within the weld for this sample is not shown.
Fig. 4. Engineering stress vs strain behaviour for all four welded specimens.
Fig. 5. Edges of welded tensile specimens showing the failure locations of each specimen.
Fig. 6. Photographs of the sectioned specimens along the plane of failure. (Top Left) Ground Weld 1 – G1 (Top Right) Ground Weld 2 – G2 (Bottom Left) Ground Weld 3 – G3 (Bottom Right) Weld with reinforcement – R.
Fig. 7. DIC strain profile for the specimen with weld reinforcement near fracture.
3 Material Model Characterisation
3.1 Characterisation Test Setup
Four different test machines were used to evaluate the compressive stress-strain behaviour of the Al5083-H116 parent plate, the HAZ, and the weld metal in order to characterise Johnson-Cook (JC) strength model parameters. Each machine was used to assess the effect of strain rate on the flow stress of the material at a different strain rate. The four test machines are described below.
1. Quasi-static compression testing at strain rates of 10-3s-1 were performed using a calibrated universal
testing machine.
2. Compression testing at strain rates of 1 s-1 were
performed using a servo-hydraulic testing machine. 3. Dynamic compression testing at strain rates of 102-103 s-1 were performed using a drop tower
apparatus.
4. Dynamic compression testing at strain rates above 103 s-1 were performed using a split Hopkinson
pressure bar.
The specimens for the parent plate, the HAZ and the weld metal were cut through the thickness of the welded aluminium panel and had a 4 mm radius. The effect of temperature on flow stress was investigated at a strain rate of 200 s-1 using the drop tower. In addition to the
tests at room temperature (25 °C), tests were conducted at -40 °C, 80 °C, 170 °C, and 250 °C.
To characterise the JC failure model, quasi-static tensile tests were performed using a 100 kN mechanical testing machine, while the dynamic tests were performed using a rotating wheel machine. The rotating wheel machine consists of a 200 kg flywheel with a claw. The claw impacts the yoke which is attached to a specimen holder and results in pulling on the sample. Tests were performed at strain rates of 0.001 s-1, 1 s-1 and 100 s-1 in
order to characterise the effect of strain rate on the failure strain. In addition to testing at room temperature, tests were conducted at a strain rate of 100 s-1 using
3.2 Characterisation Test Results
The averaged true stress – true strain curves of the parent plate, the HAZ and the weld metal for a strain rate of 1 s-1 at room temperature (25 °C) are shown in
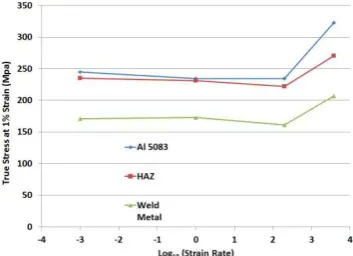
Fig. 8. The results highlights that the weld metal is significantly weaker than the HAZ and the Al 5083. The strength of the Al 5083 and the HAZ is almost identical. The effect of strain rate on Al 5083, the HAZ and the weld metal are shown in Fig. 9. The results indicate that there is minimal strain rate sensitivity until beyond a strain rate of 200 s-1. At higher strain rates, there is a
clear increase in the strength of all three materials. The effect of temperature on the strength of the three materials is shown in Fig. 10. The general trend is that the materials soften with increasing temperature; however, there appears to be a minor strengthening of the HAZ and the weld metal between 25 °C and 80 °C.
Fig. 8. True stress vs true strain results for parent plate, HAZ and weld metal at a strain rate of 1 s-1.
Fig. 9. Effect of strain rate on true stress at 1% strain.
Fig. 10. Effect of temperature on true stress at 1% strain.
The effect of both the strain rate and stress triaxiality on the failure strain for the parent plate and the HAZ are shown in Fig. 11. A clear decrease in the failure strain with increasing stress triaxiality for both materials was observed. The failure strains of the HAZ are slightly higher than the parent plate. Both materials showed an increase in the failure strain with increasing strain rate for the range of strain rates tested (up to 100 s-1). Whilst
the data was mostly consistent between the test conditions, some scatter was observed in the failure strain for the un-notched tensile tests for both materials. There was no discernible relationship between the failure strain and stress triaxiality or the strain rate for the weld material due to the high degree of scatter, which was likely due to the porosity within the weld metal. The effect of temperature on the failure strain was found to be minimal for the parent plate and the HAZ, while the data was too scattered to accurately assess any trends from the weld metal.
Fig. 11. Effect of stress triaxiality and strain rate on the failure strain for the parent plate (top), HAZ (middle) and weld metal (bottom).
3.3 Material Model Parameters
As the strain rate effects only became apparent beyond a strain rate of 200 s-1, two different models were
generated for each material based on the data. The first was a standard fit to all the data, while the other fit only included data from strain rates below 200 s-1. The
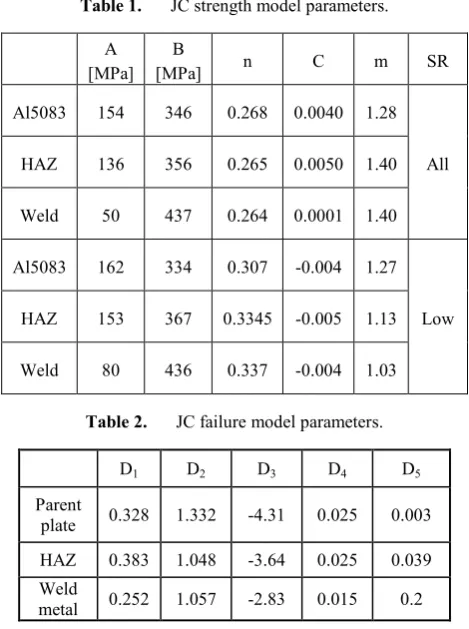
different parameters are shown in Table 1. The failure model parameters for each material was generated using a least squares fit for the 5 parameters.
Table 1. JC strength model parameters.
A [MPa]
B
[MPa] n C m SR
Al5083 154 346 0.268 0.0040 1.28
All HAZ 136 356 0.265 0.0050 1.40
Weld 50 437 0.264 0.0001 1.40
Al5083 162 334 0.307 -0.004 1.27
Low HAZ 153 367 0.3345 -0.005 1.13
Weld 80 436 0.337 -0.004 1.03
Table 2. JC failure model parameters.
D1 D2 D3 D4 D5 Parent
plate 0.328 1.332 -4.31 0.025 0.003 HAZ 0.383 1.048 -3.64 0.025 0.039 Weld
metal 0.252 1.057 -2.83 0.015 0.2
4 Numerical Modelling of Tensile Tests
on Welded Coupons
4.1 Numerical Setup
Numerical simulations of the large welded specimen under dynamic loading were performed using the LS-Dyna explicit solver. The weld was idealised as three 10 mm quadrangular regions within the gauge section as shown in Fig. 12. The models used the JC parameters from Tables 1 and 2. Following a convergence study, a uniform mesh size of 0.25 mm was used within the gauge section. Loading from the fly-wheel was applied through two rigid clevises in the bolt holes of the coupon with prescribed velocities reflecting the experimental conditions. Contact between the clevises and coupon was via a frictional contact where 0.3. The surface strain was measured at the location of the strain gauge in Fig. 2 and converted to a resultant stress within the reduced gauge section.
4.2 Numerical Results
A comparison between the experimental results for the ground specimens and the models with both sets of JC model parameters is presented in Fig. 13. The results show that the JC model that was fitted across all strain rates over-predicts the strength of the welded specimen, while the JC model, which was only fitted to strain rates below 200 s-1 provided a more accurate result for the
strength of the material. This is caused by the description of strain rate hardening in the JC model, where strength increases uniformly across strain rates rather than beyond a certain strain rate as was observed for the aluminium. In addition to these material models, the HAZ and weld metal were characterised using a simplified approach, based on the work of Seeger et al. [5], where the yield strength in the JC model (low strain rate) is adjusted based on the hardness ratio of the material and the parent metal. This simplified method provided a good description of the strength of the material. Whilst the low strain rate models provided a good description of the strength, all models over-predicted the ductility of the samples. This is attributed to the large amount of scatter in the failure strains recorded in the characterisation tests of the weld metal (Fig. 11). As the JC model has a prescribed fitting function, the failure strains used in the weld material model at a stress triaxiality of ~0.33 (uniaxial tensile test) are well above the recorded values.
Fig. 12. Numerical model of welded coupons. All dimensions are in mm and the thickness is 6 mm.
Fig. 13. Comparison of material models for ground welded tensile specimens.
A comparison between the experimental results for the specimen with weld reinforcement and the model with the low strain rate JC parameters is shown in Fig. 14. The strength of the specimen is slightly over predicted,
0 50 100 150 200 250 300
0 0.03 0.06 0.09 0.12 0.15 0.18 0.21
Engi
ne
er
ing
St
re
ss
(M
Pa
)
Engineering Strain (mm/mm)
Full Data Set Low Strain Rate Hardness Adjusted A Exp, 1
but there is a clear increase in the ductility when compared to the ground samples. As in the experiments, the models predicted that the weld reinforcement would result in a change in the failure location on the specimen. Figures 15 and 16 compare the strain distributions in the samples for the experiment and model of the unground specimen. In both cases, strain localisation occurs within the HAZ (at the interface with the weld metal), which results in failure of the specimen in this location. One issue with the numerical simulations is that they were not able to capture the localised strain within the weld bead, which may be due to the presence of porosity within the sample or an effect of the complex weld structure shown in Fig. 3, which was simplified in the numerical model.
Fig. 14. Effect of weld bead grinding on tensile response.
Fig. 15. Strain distribution within unground weld prior to strain localisation (top: DIC, bottom: FEM).
Fig. 16. Strain distribution within un-ground weld at fracture along HAZ and weld material interface (top: DIC, bottom: FEM).
To highlight the influence of the weld on the overall ductility of the tensile specimen, an additional simulation was performed using only the parent metal for the entire specimen (Fig. 17). Based on the modelling predictions, welding the aluminium resulted in a 30% reduction in the ductility of the sample. This shows that welds, particularly with defects, can significantly impact the performance of a structure and this should be factored
into design calculations or removed through better quality control of the welding process and inspection.
Fig. 17. Comparison of welded coupon and parent metal.
5 Conclusions
This investigation evaluated the mechanical behaviour of a welded aluminium panel under dynamic loading. The parent material (Al 5083) was found to have no strain rate dependency up to a strain rate of 200 s-1, after which
there was an increase in strength with increasing strain rate. This behaviour is not well captured by the standard JC strength model. The welds used in this investigation were found to have a significant level of porosity. This led to data with significant scatter in the characterisation of the parameters for the JC failure model for the weld material. DIC on the tensile tests for the welded specimens identified a region of highly localised strain within the weld bead. As this was not captured in the numerical models, it resulted in poor predictions of the ductility of the welded specimens. Differences in the failure location on the welded specimens were observed when the weld metal was not ground back to the thickness of the parent metal. For the ground specimens, failure occurred within the weld metal, whereas failure occurred at the HAZ/weld metal interface for the specimen with weld reinforcement. For these specimens the inclusion of a weld resulted in a 30% reduction in the ductility when compared with the parent material. Further work is needed to accurately model the weld geometry with defects, such as porosity.
References
1. M. Collette, 10th PRADS, (2007)
2. V. Pickerd, H. Bornstein, P. McCarthy, M. Buckland, Int J Impact Eng, 95, 20-53, (2016) 3. E. Grimsmo, A. Clause, A. Aalberg, M. Langseth,
Int J Impact Eng, 108, 101-133, (2017)
4. H. Wadley, T. Børvik, L. Olovsson, J. Wetzel, K. Dharmasena, O. Hopperstad, V. Deshpande, J. Hutchison, J Mech Phys Solids, 61, 674-699, (2013) 5. F. Seeger, G. Michel, M. Blanquet, German
LS-DYNA Forum, (2008)
0 50 100 150 200 250 300
0 0.03 0.06 0.09 0.12 0.15 0.18 0.21 0.24
St
res
s (
M
Pa)
Strain (mm/mm) FEM, Ground
FEM, Weld Reinforcement Exp, 1, Ground
Exp, 2, Ground Exp, 3 Ground
Exp, 4, Weld Reinforcement
0 50 100 150 200 250 300
0 0.03 0.06 0.09 0.12 0.15 0.18 0.21 0.24
St
re
ss
(M
Pa
)
Strain (mm/mm)
Parent Metal Welded Coupon Exp, 1 Exp, 2 Exp, 3