Mining Hidden Knowledge from Measured Data for Improving
Building Energy Performance
Zhun Yu
A Thesis in
The Department of
Building, Civil and Environmental Engineering
Presented in Partial Fulfillment of the Requirements for the Degree of Doctor of Philosophy at
Concordia University Montréal, Québec, Canada
January, 2012 © Zhun Yu, 2012
CONCORDIA UNIVERSITY
SCHOOL OF GRADUATE STUDIES
This is to certify that the Ph.D. thesis preparedBy: Zhun Yu
Entitled: Mining Hidden Knowledge from Measured Data for Improving Building Energy Performance
and submitted in partial fulfillment of the requirements for the degree of
Doctor of Philosophy
complies with the regulations of this University and meets the accepted standards with respect to originality and quality.
Signed by the final examining committee:
_________________________________ Dr. G. Gouw (Chair)
_________________________________ Dr. C. Inard (External Examiner) _________________________________ Dr. W. Ghaly (External to Program) _________________________________ Dr. R. Zmeureanu (Examiner) _________________________________ Dr. Z. Chen (Examiner)
_________________________________ Dr. B. Fung (Thesis Co-supervisor) _________________________________ Dr. F. Haghighat (Thesis Supervisor) Approved by __________________________________________________________
Chair of Department or Graduate Program Director
________________2012________________________________________________ Dean, Faculty of Engineering and Computer Science
iii
ABSTRACT
Mining Hidden Knowledge from Measured Data for Improving Building
Energy Performance
Zhun Yu, Ph.D.
Concordia University, 2012
Nowadays, building automation and energy management systems provide an opportunity to collect vast amounts of building-related data (e.g., climatic data, building operational data, etc.). The data can provide abundant useful knowledge about the interactions between building energy consumption and its influencing factors. Such interactions play a crucial role in developing and implementing control strategies to improve building energy performance. However, the data is rarely analyzed and this useful knowledge is seldom extracted due to a lack of effective data analysis techniques.
In this research, data mining (classification analysis, cluster analysis, and association rule mining) is proposed to extract hidden useful knowledge from building-related data. Moreover, a data analysis process and a data mining framework are proposed, enabling building-related data to be analyzed more efficiently. The applications of the process and framework to two sets of collected data demonstrate their applicability. Based on the process and framework, four data analysis methodologies were developed and applied to the collected data.
Classification analysis was applied to develop a methodology for establishing building energy demand predictive models. To demonstrate its applicability, the
iv
methodology was applied to estimate residential building energy performance indexes by modeling building energy use intensity (EUI) levels (either high or low). The results demonstrate that the methodology can classify and predict the building energy demand levels with an accuracy of 93% for training data and 92% for test data, and identify and rank significant factors of building EUI automatically.
Cluster analysis was used to develop a methodology for examining the influences of occupant behavior on building energy consumption. The results show that the methodology facilitates the evaluation of building energy-saving potential by improving the behavior of building occupants, and provides multifaceted insights into building energy end-use patterns associated with the occupant behavior.
Association rule mining was employed to develop a methodology for examining all associations and correlations between building operational data, thereby discovering useful knowledge about energy conservation. The results show there are possibilities for saving energy by modifying the operation of mechanical ventilation systems and by repairing equipment.
Cluster analysis, classification analysis, and association rule mining were combined to formulate a methodology for identifying and improving occupant behavior in buildings. The results show that the methodology was able to identify the behavior which needs to be modified, and provide occupants with feasible recommendations so that they can make required decisions to modify their behavior.
v
ACKNOWLEDGEMENTS
First of all, I would like to express my deepest gratitude to my supervisor, Dr. F. Haghighat, for his excellent guidance throughout my graduate studies. I benefit greatly from both his extensive expertise and charismatic personality. His strong support and great patience enabled me to strive for the highest level of achievement in carrying out this work, which led to a number of research accomplishments.
I would also like to extend my sincere gratitude and appreciation to my co-supervisor, Dr. B.C.M. Fung, for his valuable suggestions on my research and tremendous efforts to improve the quality of this thesis. Without his help, I could not finish this thesis.
Additionally, I am deeply indebted to all other supervisory committee members, Dr. G. Gouw, Dr. C. Inard, Dr. R. Zmeureanu, Dr. W.S. Ghaly, and Dr. Z. Chen, for accepting the appointment to the dissertation committee, as well as for their suggestions and support.
Financial support by Public Works and Government Service Canada (PWGSC), and Concordia University is gratefully acknowledged. I wish to express my gratitude to Dr. E.Morosfsky from PWGSC for having the vision to support my studies.
Many thanks to the School of Graduate Studies of Concordia University for providing me with valuable scholarships, awards and assistantships during my Ph.D. studies.
Special acknowledgements go to Dr. Yoshino Hiroshi, Yves Gilbert, and Denis Dumont for providing building-related data.
vi
with English writing.
I also thank my colleagues: Dr. Jiang Zhang, Dr. Parham Mirzaee, Lexuan Zhong, Arash Soleimani, Omid Ashrafi, Arash Bastani, Vida Safari, Reza Mostofi. They created a good and relaxed atmosphere in our office so that I can focus on and enjoy my research.
I would like to thank all my friends in Montreal, for their help, friendship and encouragements.
Finally, my utmost gratitude goes to my parents and brother, for their endless love and support without which this work would have been impossible.
vii
T
ABLE OFC
ONTENTS
ABSTRACT ... iii
ACKNOWLEDGEMENTS ... v
TABLE OF CONTENTS ... vii
LIST OF FIGURES ... x
LIST OF TABLES ... xii
NOMENCLATURE ... xiv
1. INTRODUCTION ... 1
1.1 Background and Motivation ... 1
1.2 Problem Statement ... 4
1.3 Proposed Data Analysis Techniques ... 5
1.4 Purpose and Objectives ... 6
1.5 Organization of the Thesis ... 7
2. LITERATURE REVIEW ... 10
2.1 Data Analysis Methods for Improving Building Energy Performance ... 10
2.1.1 Typical Indicators Method ...11
2.1.2 Statistical Analysis Method ... 13
2.1.3 Building Simulation Method ... 14
2.2 Application of the Three Data Mining Techniques in Building Engineering ... 15
2.3 Building Energy Prediction Models... 17
2.4 The Effects of Occupant Behavior on Building Energy Consumption ... 20
2.5 Discovering Associations and Correlations among Measured Data ... 25
2.6 Approaches to Modifying Occupant Behavior in Residential Buildings ... 26
3. Data mining Process and Framework FOR KNOWLEDGE DISCOVERY .... 30
3.1 Proposed Data Analysis Process ... 30
3.2 Proposed Data Mining Framework ... 32
3.3 Data Mining Techniques ... 33
3.3.1 Data Classification and Decision Tree ... 35
3.3.2 Cluster Analysis and the K-means Algorithm ... 42
3.3.3 Association Rule Mining ... 45
3.4 Data Collection ... 47
3.4.1 Measured Data from Residential Buildings ... 47
3.4.2 Measured Data from the EV Building ... 51
4. A Decision Tree Method for Building Energy Demand Modeling ... 56
viii
4.2 Methodology, Model target/input variables ... 57
4.2.1 Methodology ... 57
4.2.2 Model target variable ... 59
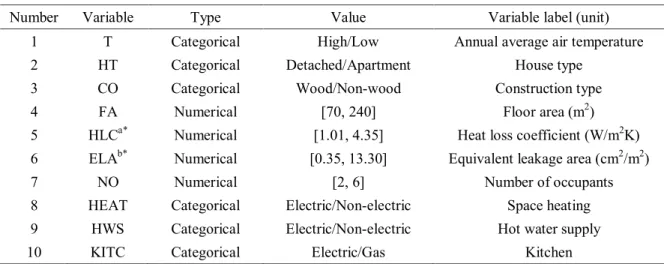
4.2.3 Model input variables ... 60
Ten parameters (or attributes) are selected from the database to be model input parameters and are summarized in Table 4-1. ... 60
4.3 Results and discussion ... 62
4.3.1 Generation of decision tree ... 62
4.3.2 Evaluation of the decision tree ... 64
4.3.3 Utilization of decision tree ... 67
4.4 Summary ... 75
5. A Systematic Procedure for Studying the Influence of Occupant Behavior on Building Energy Consumption ... 77
5.1 Introduction ... 77
5.2 Methodology ... 77
5.2.1 Data transformation... 79
5.2.2 Grey relational analysis ... 80
5.3 Selection of typical parameters ... 82
5.4 Results and discussion ... 83
5.4.1 Grey relational grades ... 83
5.4.2 Cluster analysis ... 84
5.4.3 Effects of occupant behavior... 85
5. 4 Summary ... 97
6. A Novel Methodology for Knowledge Discovery through Mining Associations between Building Operational Data ... 99
6.1 Introduction ... 99
6.2 Methodology ... 99
6.3 Data pre-processing ... 102
6.4 Results and Discussion ... 104
6.4.1 ARM on the Coldest Day in the Dataset_1 and Dataset_2 ... 104
6.4.2 ARM in winter in the dataset_1 and dataset_2 ...110
6.4.3 Association map ...118
6.5 Summary and conclusions ... 121
7. A Methodology for identifying and improving occupant behavior in residential buildings ... 124
7.1 Introduction ... 124
7.2 Methodology ... 125
7.3. Reference Building (RB) identification ... 129
7.4 Data pre-processing ... 131
ix
7.4.2 Data transformation for cluster analysis ... 133
7.4.3 Removal of outliers for conducting ARM in the case building ... 134
7.5 Results and Discussion ... 136
7.5.1 Clustering-then-classification ... 136
7.5.2 RB identification ... 142
7.5. 3 Association rule mining (ARM) ... 147
7.6 Summary ... 156
8. Conclusions and Recommendations ... 158
8.1 Conclusions ... 158
x
L
IST OFF
IGURESFigure 3-1 Process for data analysis within the building engineering domain ... 30
Figure 3-3 A schematic diagram of dataset, attribute and instance ... 35
Figure 3-4 Schematic illustration of a simple hypothetical decision tree ... 36
Figure 3-6 Clustering schema ... 43
Figure 3-7 Measuring instruments (from left to right: electricity, gas, kerosene and air temperature) ... 48
Figure 3-8 Boxplot for monthly average outdoor temperature in 2003 ... 49
Figure 3-9 Percentage breakdown of buildings in each district ... 50
Figure 3-10 EV Pavilion ... 51
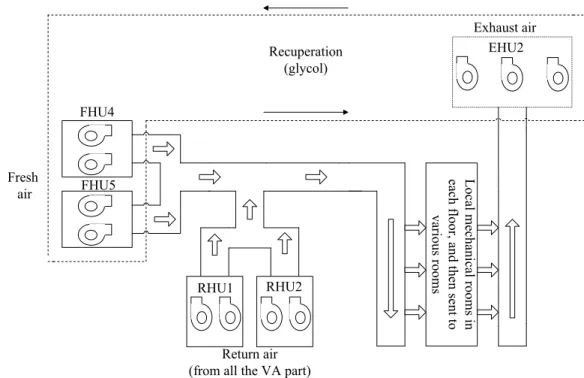
Figure 3-11 Flow chart of air-conditioning system in the ENCS pavilion ... 52
Figure 4-1 Proposed methodology for building energy demand modeling ... 58
Figure 4-2 Categorical distribution of the six categorical parameters ... 61
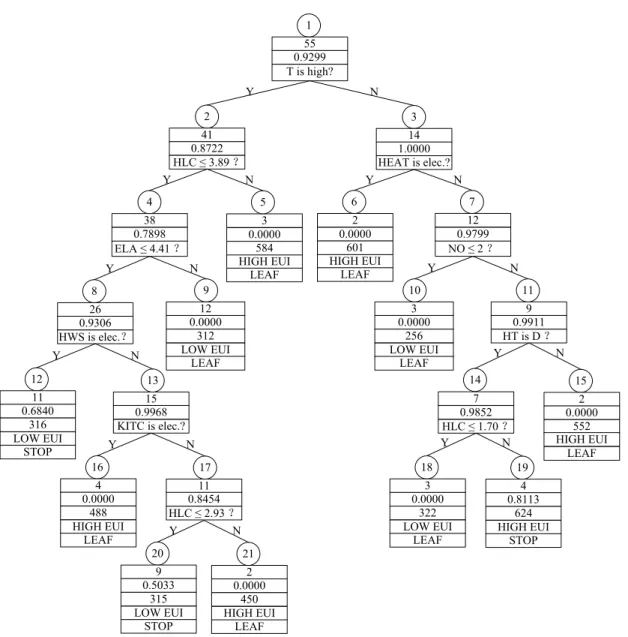
Figure 4-3 Decision tree for the prediction of building EUI level ... 64
Figure 4-5 Comparison of the EUI between electric HWS and non-electric HWS .. 72
Figure 4-6 Comparison of EUI between electric HEAT and non-electric HEAT ... 74
Figure 5-1 Average annual EUI of different end-use loads ... 86
Figure 5-2 Boxplot of normalized annual EUI of different end-use loads ... 89
Figure 5-3 Stacked-column diagram of annual EUI of end-use loads of three typical buildings ... 89
Figure 5-4 Monthly variation of end-use loads in Cluster 1 ... 93
Figure 5-5 Monthly variation of end-use loads in Cluster 2 ... 93
Figure 5-6 Monthly variation of end-use loads in Cluster 3 ... 93
Figure 5-7 Monthly variation of end-use loads in Cluster 4 ... 94
Figure 5-8 Monthly average living-room temperature of three typical buildings in Cluster 1 ... 95
Figure 5-9 Monthly average living-room temperature of three typical buildings in Cluster 2 ... 96
Figure 5-10 Monthly average living-room temperature of three typical buildings in Cluster 3 ... 96
Figure 5-11 Monthly average living-room temperature of three typical buildings in Cluster 4 ... 96
Figure 6-1 Proposed methodology to examine all the associations and correlations between building operational data ... 100
xi
Figure 6-2 Distribution of two intervals of all monitored parameters in the dataset_1
... 104
Figure 6-3 Screenshot of the FHU 4 control panel ... 106
Figure 6-4 Heating and humidification processes in psychrometric chart ... 107
Figure 6-5 Air temperature after heating coil (state C) and humidifier (state D) ... 108
Figure 6-6 Hypothetical air/water temperature in the FHU 4 before the remedy ... 109
Figure 6-7 Hypothetical air/water temperature in the FHU 4 after the remedy ... 109
Figure 6-8 Air flow rates of the FHUs 1 and 2 in the dataset_1 and dataset_2 ...112
Figure 6-9 Air flow rates of fan 1 in the FHUs 4 and 5 in dataset_1 ...114
Figure 6-10 Air flow rates of fan 1 in the FHUs 4 and 5 in dataset_2 ...114
Figure 6-11 Screenshot of the EHU 2 control panel ...116
Figure 6-12 Frequency of VSD on the fan in the RHU1 and RHU2 in dataset_1 ...118
Figure 6-13 Air flow rates of the fan in the RHUs 1 and 2 in dataset_1 ...118
Figure 6-14 Association map in the dataset_2 provided by RapidMiner...119
Figure 6-15 Air flow rates of fans 1 and 2 in the FHU4 in the dataset_2 ... 121
Figure 7-1 Two-level end-use loads ... 125
Figure 7-2 Methodology of evaluating and efficiently improving occupant behavior in the case building ... 127
Figure 7-3 Distribution of two intervals of all ARM attributes after the removal of outliers... 136
Figure 7-4 Decision tree for the prediction of cluster attribution ... 139
Figure 7-5 Mean daily air temperature in kitchen vs. mean daily outdoor air temperature (winter, 2003) ... 151
xii
L
IST OFT
ABLESTable 3-1 Investigation items and methods ... 48
Table 3-2 Conversion coefficients of different fuels... 50
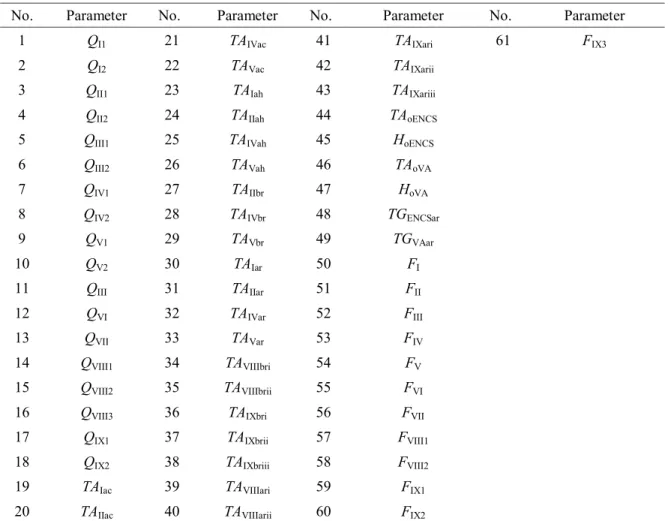
Table 3-3 The monitored parameters of the air-conditioning systems ... 54
Table 4-1 Summary of model input parameters ... 60
Table 4-2 Decision rules derived from the obtained decision tree ... 65
Table 4-3 Results of decision tree accuracy evaluation ... 67
Table 4-4 Building parameters for the prediction of building EUI levels ... 69
Table 4-5 Summary of significant factors ... 70
Table 5-1 Representative parameters of the four influencing factors ... 82
Table 5-2 Grey relational grades for each district ... 84
Table 5-3 Centroid of each cluster and statistics on the instances in each cluster .... 85
Table 5-4 Annual EUI of end-use loads of reference buildings (MJ/m2)... 89
Table 6-1 Three best rules generated ... 105
Table 6-2Four rules in Category 1 ... 111
Table 6-3 Six rules in Category 2 ...113
Table 6-4 Comparison between the two control strategies ...116
Table 6-5 One rule in Category 3 ...117
Table 7-1 Appliances in the case building and environmental parameters used in ARM ... 132
Table 7-2 Statistical data of the seven main end-use loads for the 66 buildings (unit: MJ per capita per year) ... 133
Table 7-3 Statistical data after normalization ... 134
Table 7-4 Centroid of each cluster and statistics on the number and percentage of instances assigned to different clusters ... 138
Table 7-5 The number of buildings in various districts in each cluster ... 138
Table 7-6 Confusion matrix ... 140
Table 7-7 End-use data in the case building (unit: MJ per capita per year) ... 142
Table 7-8 The main end-use loads in the 14 buildings in cluster_4 (Unit: MJ per capita per year) ... 144
Table 7-9 Transformation of categorical parameters ... 145
Table 7-10 Building-related parameters of RB candidate buildings and the case building ... 145 Table 7-11 Comparison of end-use data between the case building and RB (Unit: MJ
xiii
per capita per year)... 146 Table 7-12 Selected association rules (min_supa* = 50%, min_conf b*= 80%,
min_liftc*=1) ... 149 Table 7-13 Selected association rules between indoor/outdoor parameters and
household appliances (min_sup = 50%, min_conf = 80%, min_lift=1) ... 154 Table 7-14 Attributes without associations with the remaining attributes ... 155
xiv
N
OMENCLATUREEnd Use Loads
HVAC Heating, ventilation, air-conditioning load (MJ/m2)
SHW Supply hot water load (MJ/m2)
KITC Kitchen load (MJ/m2)
LIGHT Lighting load (MJ/m2)
REF Refrigerator load (MJ/m2)
A&I Amusement and information load (MJ/m2)
H&S Housework and sanitary load (MJ/m2)
OTHER Other load (MJ/m2)
English letters
T Annual mean air temperature (°C)
RH Annual mean relative humidity
V Annual mean wind speed (m/s)
RA Annual mean global solar radiation (MJ/m2)
HT House types
CO Construction type
FA Building area (m2)
ELA Equivalent leakage area (cm2/m2)
xv
NO Number of occupants
HEAT Space heating and cooling
HWS Hot water supply
KITC Kitchen equipment
TA Air temperature (°C)
TG Glycol temperature (°C)
H Relative humidity (kg/kg)
Q Flow rate (L/S)
F Frequency of variable-speed drives on fans (Hz)
Subscripts
I, II, III, IV, V Fresh air handling unit 1 (FHU1), FHU2, FHU3, FHU4, FHU5
VI, VII Return air handling unit 1 (RHU1), RHU2
VIII, IX Exhaust air handling unit 1 (EHU1), EHU2
ac After cooling coil
ah After heating coil
br Before recuperation
ar After recuperation
1, 2, 3 Fan1, fan2, fan3
i, ii, iii Recuperation1, recuperation2, recuperation3
xvi
VA VA part
1
1.
INTRODUCTION
1.1 Background and Motivation
Energy consumed in the building sector is of growing concern. With rising living standards, building energy consumption has significantly increased over the past few decades. For example, from 1994 to 2004, building energy consumption in Europe and North America increased at a rate of 1.5% and 1.9% per annum, respectively (Hein, 2005; Pérez-Lombard et al., 2008). Building energy consumption in China has increased more than 10% per annum for the past 20 years (Cai, 2009). The high and steady increase in demand for energy necessitate a thorough understanding of the major influencing factors to assist in developing effective approaches to reducing building energy consumption. Factors influencing building energy consumption can be divided into seven categories (Yu et al., 2011):
(1) Climate (e.g., outdoor air temperature, solar radiation, wind velocity, etc.); (2) Building-related characteristics (e.g., type, area, orientation, etc.);
(3) User-related characteristics, except for social and economic factors (e.g., user presence, etc.);
(4) Building services systems and operation (e.g., space cooling/heating, hot water supplying, etc.);
2
(6) Social and economic factors (e.g., degree of education, energy cost, etc.); and (7) Indoor environmental quality required.
These seven factors play an essential role in reducing energy consumption and should be clearly understood. However, there still are significant barriers that prevent researchers and architects from achieving the goal of completely understanding these factors. For example, researchers and architects often observe a large discrepancy between the designed/simulated and actual building energy consumption, and they are unable to give a clear explanation for this discrepancy. Another challenge is to clearly identify the effects of these influencing factors, especially occupant behavior, on building energy consumption. These barriers can lead to misunderstandings of how the influencing factors will affect building energy performance, and thus add difficulties to energy consumption reduction. Therefore, it is vital that these barriers are removed so that building energy performance can be improved efficiently.
To overcome these barriers, one effective method is to analyze measured building-related data and acquire relevant useful knowledge, considering that such data contains actual knowledge about these influencing factors. In general, building-related data includes (Yu et al., 2011):
(1) Climatic data (e.g., outdoor air temperature, outdoor relative humidity, etc.);
(2) Building operational data, mainly operational data of HVAC systems (e.g., supply air temperature, fresh air flow rates, etc.), IEQ data (e.g., indoor air temperature, human
3
thermal comfort, etc.), and energy data (e.g., monthly electricity consumption, end-use loads of household appliances, etc.); and
(3) Building physical parameters (e.g., floor area, window-to-wall-ratio, etc.);
Currently, vast amounts of building-related data have been collected and stored, since building automation systems (BAS) are extensively employed. Moreover, for an existing building, building-related data can be surveyed through different methods (e.g., analysis of design documentation, questionnaires, and interviews). This data contains abundant knowledge of building design, operation, and maintenance that can be extracted to help reduce building energy consumption. However, the data is rarely analyzed and translated into useful knowledge, mainly due to its complexity (especially large volumes and poor quality) and a lack of effective data analysis techniques. Consequently, this motivated this study with the purpose of establishing a data analysis process and a systematic data analysis framework, to deal with the challenges caused by the complexity of measured building-related data. Note that the data analysis process refers to a series of sequential steps in analyzing measured building-related data. The data analysis framework mainly includes different data analysis algorithms, from which a set of efficient data analysis methodologies can be developed. Both the process and the framework are aimed at successfully mining hidden and useful knowledge from measured building-related data in order to improve building energy performance.
4
1.2 Problem Statement
Various data analysis techniques, especially traditional statistical analysis and building simulation, have been widely used in building-related studies. One main goal is to analyze the complex interactions between building energy consumption and its influencing factors, thereby improving building energy performance. However, considering the increased size of building historical databases and the diversity of the influencing factors, these commonly-used data analysis methods are insufficient to take full advantage of measured building-related data to account for the interactions and help improve performance. In particular, a number of problems of building energy performance improvement remain significant barriers to researchers and architects; and these problems are difficult to completely solve by using these commonly-used data analysis methods. Four fundamental problems can be listed as follows:
(1) How can we develop reliable building energy–demand models that are interpretable and that can be easily used by people without advanced mathematical knowledge? (2) How can we investigate building occupant behavior and quantitatively identify its
effect on building energy consumption without including the impact of other influencing factors such as weather conditions?
(3) How can we examine all the associations and correlations among building operational data (e.g., various operational parameters of HVAC systems), and acquire useful knowledge from them to better understand building operation and
5
reduce energy consumption?
(4) How can we identify energy-related occupant behavior that needs to be modified for energy conservation, and how can we make recommendations for behavior modification?
Clearly, in order to take advantage of measured building-related data and address these problems, it is necessary to propose more effective data analysis techniques and extract relevant useful knowledge from the data. Furthermore, it is highly desirable to provide an avenue for standardizing the process of data analysis within the building engineering domain. Researchers and architects will greatly benefit from a standardized process that enables them to efficiently analyze measured building-related data and obtain useful knowledge about improving building energy performance. Accordingly, a data analysis process and a systematic data analysis framework need to be established based on the proposed data analysis techniques.
1.3 Proposed Data Analysis Techniques
In this research, data mining is proposed as a primary tool to analyze measured building-related data. Data mining techniques excel at automatically analyzing huge amounts of data for useful information and fit well with the purpose of this research.
In the past decade, different definitions of data mining have been given by various researchers. For example, Hand et al. (2001) define data mining as “the analysis of large observational data sets to find unsuspected relationships and to summarize the data in
6
novel ways so that data owners can fully understand and make use of the data.” As defined by Cabena et al. (1998), data mining is “an interdisciplinary field bringing together techniques from machine learning, pattern recognition, statistics, databases, and visualization to address the issue of information extraction from large databases.” Based on these statements, it can be concluded that data mining is essentially a combination of multi-disciplinary approaches. It is often used to extract hidden but useful patterns from a large volume of data and to transform the data into knowledge that could benefit further work. Data mining has been successfully applied in many scientific, medical, and application domains (e.g., banking, bioinformatics, new materials identification, fraud detection, and telecommunications). It was also identified by the MIT Technology Review
(MIT Technology Review, 2001) as one of the ten emerging technologies that may change the world. In this study, three widely accepted and implemented data mining techniques were employed: data classification, clustering analysis, and association rule mining. Each of these techniques will be further discussed in the following chapters.
1.4 Purpose and Objectives
The purpose of this research is to construct a data analysis process and a systematic data mining framework within the building engineering domain and then validate them. The proposed process and framework can help to analyze measured building-related data and discover useful knowledge for evaluating and improving building energy performance. The process describes knowledge extraction from measured data step by step. As one
7
major step in the process, the framework helps to develop different data analysis methodologies based on selected data mining techniques and algorithms. These methodologies can be applied to deal with various ranges of problems within the building engineering domain. To demonstrate the applicability of the proposed process and framework, measured data from selected buildings is collected and analyzed; a set of data analysis methodologies are developed to address the four fundamental problems outlined in Section 1.2.
The main objectives of this thesis are:
(1) To develop a data analysis methodology that establishes reliable building energy-demand models that are interpretable and that can be easily used by people without training in advanced mathematics and statistics;
(2) To develop data analysis methodologies for studying building occupant behavior, such as quantitatively identifying the effect of occupant behavior on building energy consumption, and identifying the occupant behavior that can be modified to save energy; and
(3) To develop a data analysis methodology that examines all the associations and correlations among building operational data, and extracts useful knowledge from them to better understand system operation and reduce energy consumption.
1.5 Organization of the Thesis
8
statements, the proposed data analysis techniques, and the purpose/objectives of this research.
Chapter 2 reviews existing data analysis methods for extracting useful knowledge from measured building-related data and the application of three data mining techniques within the domain of building engineering. Also, the literature review of the data analysis methods for addressing the four abovementioned problems is conducted.
Chapter 3 introduces the proposed data analysis process and framework, as well as the three data mining techniques. Then, collected data for the case studies in this research is described.
In Chapter 4, the application of a basic data mining technique (i.e., data classification) to establish building energy-demand models is presented and discussed.
In Chapter 5, the development of a methodology for examining the influences of occupant behavior on building energy consumption is reported. The method is based on a basic data mining technique: cluster analysis.
In Chapter 6, a methodology for examining all the associations and correlations between building operational data is proposed for discovering useful knowledge about energy conservation. The method is based on a basic data mining technique (association rule mining).
In Chapter 7, a methodology is developed for identifying the occupant behavior that needs to be modified in existing residential buildings. The method is based on the three
9
data mining techniques: data classification, cluster analysis, and association rule mining. Chapter 8 concludes the thesis and proposes future work.
10
2.
LITERATURE REVIEW
This chapter evaluates the data analysis methods for extracting useful knowledge from building-related data and reviews the applications in the domain of building engineering of the three main data mining techniques: data classification, clustering analysis, and association rule mining. The methods used by previous researchers who attempted to solve the four problems outlined in Chapter 1 are then summarized and assessed.
2.1 Data Analysis Methods for Improving Building Energy Performance
MacDonald and Wasserman (1989) summarized five general categories of data analysis methods employed for evaluating and improving building energy performance based on measured building-related data as follows:(1) Annual total energy use and energy use intensity (EUI) comparison, (2) Linear regression and component models,
(3) Multiple linear regression models,
(4) Building simulation programs (also termed microdynamic modeling), and (5) Dynamic thermal performance models (also termed macrodynamic modeling).
In the first analysis method, both annual total energy use and the EUI are typical energy performance indicators. Accordingly, the method can be categorized as the typical
11
indicators method, given that other indicators (e.g., coefficient of performance) may also be used.
The second and third methods relate to regression analysis, a statistical technique. Hence, they are merged into the same category for simplicity and categorized as the statistical analysis method, given that other statistical techniques such as correlation analysis) may also be used. Similarly, the fourth and fifth methods can be merged and categorized as the building simulation method.
Consequently, the five categories are merged into three to better describe the data analysis methods for extracting useful knowledge from measured building-related data: (1) Typical indicators,
(2) Statistical analysis, and (3) Building simulation.
In the following section, each method is reviewed and evaluated.
2.1.1 Typical Indicators Method
Typical indicators, such as annual total energy use and the EUI, are a simple method of analyzing measured building-related data and evaluating building energy performance.
Annual total energy use refers to the building energy consumption in one year. The EUI is a measure of energy efficiency and is calculated as the ratio of annual total energy use to an total floor area. These two indicators were mainly utilized to survey building energy-use
12
patterns and investigate the impact of the influencing factors of building energy consumption (Deng and Burnett, 2000; AboulNaga and Elsheshtawy, 2001; Deng 2003; Balaras et al., 2007; Chen et al., 2009; Filippín et al., 2009; Chung and Hui, 2009; Priyadarsini et al., 2009). Also, these indicators could be utilized to compare the building energy consumption before and after retrofitting, thereby evaluating the energy-saving potential of various energy-saving techniques and energy efficiency improvements (Santamouris et al., 1996; Balaras et al., 2002; Balaras et al., 2003). Other similar indicators, such as annual total heating/cooling energy consumption and annual total energy supply cost, were also utilized for data analysis. For example, Long and Zhou (2005) studied the influence of shading measures on building energy consumption using both
annual heating energy consumption and annual cooling energy consumption. Li et al. (2006) designed a distributed combined heating, cooling, and power generation system in Beijing, with thermal performance, economics, and environment factors being considered simultaneously based on annual total energy supply cost.
The major advantage of the typical indicators method is its simplicity. Moreover, the use of these typical indicators makes it possible to compare different designs. However, typical indicators alone are insufficient to analyze measured building-related data and evaluate building energy performance. Particularly, they cannot provide insights into building energy-use patterns.
13 2.1.2 Statistical Analysis Method
Statistical analysis techniques, particularly regression analysis (including both linear regression and non-linear regression), were extensively used within the building engineering domain. Regression analysis was utilized to identify the correlation between building energy consumption and its influencing factors (e.g., climate, occupancy patterns, HVAC system design and operation, and building physical parameters), and then to analyze overall building energy-use patterns and how these influencing factors affect energy consumption (Hammarsten, 1979; Monts, and Blissett, 1982; Gaunt, 1985; Zmeureanu and Fazio, 1991; Deng and Burnett, 2000; Yu and Chow, 2001; Deng 2003; Tonooka et al., 2006; De la Flor et al., 2006; Chung and Hui, 2009; Priyadarsini et al., 2009; Chen et al., 2009). An additional application of regression analysis was to predict building energy demand based on environmental data or building physical parameters (Sullivan and Nozaki, 1984; Sullivan et al., 1985; O’Neill et al., 1991; Lam et al., 1997; Dong et al., 2005; Chung and Hui, 2009). Also, regression analysis was used to predict other parameters, such as indoor air temperature and relative humidity (Givoni and Krüger, 2003; Krüger and Givoni, 2004; Freire et al., 2008), the overall heat transfer coefficient (the U-value) (Jiménez and Heras, 2005), and the energy consumption of different types of cooling plants (e.g., centrifugal chillers and ice storage systems (Kim and Kim 2007)). Additionally, some researchers compared building energy performance in different countries or cities by using statistical techniques. For example, Zhang (2004) compared
14
residential energy-use patterns in China with those in Japan, Canada, and the United States by using relationships between energy consumption and heating degree-days.
The strength of statistical techniques is their simplicity and widespread familiarity. However, most statistical techniques are utilized with the premise that data analysts, based on their expertise, “believe” that strong associations and correlations exist among two or more parameters. For example, researchers perform regression/correlation analysis between building energy consumption and outdoor air temperature because they “believe” that outdoor air temperature may have a significant influence on building energy consumption. Such analysis depends mainly on the prior expertise of analysts and adopted statistical techniques. As a result, useful knowledge could be lost, particularly indirect associations and correlations between data (e.g., parameters A and B do not have a direct impact on C, but they may have an indirect impact through parameters D and E) (Yu et al., 2011).
2.1.3 Building Simulation Method
Building simulation is another method widely employed to analyze measured building-related data. Various simulation programs, such as EnergyPlus (Crawley et al., 2001)and TRNSYS (Al-ajmi and Hanby, 2008), were commonly utilized when using this method. In some cases this method was used to conduct building energy consumption calculations in order to identify the correlations between building energy consumption and
15
different influencing factors (e.g., total building energy consumption and building relative compactness (Ourghi et al., 2007), heating/cooling loads and building control strategies (Eskin and Türkmen, 2008), and annual electricity consumption and the overall heat-transfer coefficient U (Lam, 2000)). In other cases, the energy-saving potential of various energy conservation techniques, such as green building design options (Pan et al., 2008), building-integrated photovoltaic (PV) technologies (Ordenes et al., 2007), and PV ventilated window systems (Chow et al, 2007), were evaluated using this method. Additionally, some researchers used simulation programs to model the energy consumption of various building services systems, and then compared the actual energy consumption with simulated results to evaluate the performance of those systems (Lazzarin et al., 2005; Zhou et al., 2008; Tian and Love, 2009; Li et al., 2010).
Building simulation allows for the prediction of building energy performance under various conditions. However, this method does not perform well in simulating energy performance for occupied buildings as compared to non-occupied buildings, due to a lack of sufficient knowledge about occupant behavior patterns, which are normally very complicated. Additionally, the application of building simulation programs is normally complicated and the learning process is time-consuming (Yu et al., 2011).
2.2 Application of the Three Data Mining Techniques in Building
Engineering
16
association rule mining—are proposed as primary methods for mining hidden and useful knowledge from measured building-related data. These techniques have been extensively applied in various fields such as industrial and medical studies (Delgado et al., 2001; Jiao and Zhang, 2005; Georgilakis et al., 2007; Pan et al., 2007; Hsu, 2009). However, their utilization within the domain of building engineering is still sparse. It should be mentioned that, due to the fact that several classification methods (e.g., ANN method, Genetic Algorithm, Rough Set approach, and Fuzzy Set approach) were less commonly used for data classification in commercial data mining systems, in this research these methods were not assigned to data classification (but were still included in the data mining system).
In particular, previous work seldom studied how to utilize these three data mining techniques to process building-related data and extract useful knowledge. With regard to the association rule mining technique, no literature was found, to the best of our knowledge. With regard to the data classification technique, Tso and Yau (2007) compared the accuracy of regression analysis, the ANN method, and the decision tree method (i.e., one typical data classification method) in predicting the average weekly electricity consumption for both summer and winter in Hong Kong. With regard to the cluster analysis technique, Santamouris et al. (2007) applied the technique to classify and rate the energy performance of school buildings. Based on the cluster analysis and Principal Component Analysis (PCA) techniques, Gaitani et al. (2010) proposed an
17
approach to rating the energy performance for space heating and evaluating potential energy savings in the school sector in Greece. Also, Lam et al. (2009) combined the cluster analysis and the PCA to identify climatic influences on chiller plant electricity consumption. Wu and Clements-Croome (2007)applied the cluster analysis technique to analyze indoor environmental data measured from wireless sensor networks which was heavily noisy. In their study, cluster analysis was used first to discover outliers and then to estimate the distribution of indoor temperature.
In summary, data mining, especially the three data mining techniques, is relatively a new concept/tool applicable to the building engineering domain. Hence, our study may bring a new inspiration for architects and researchers to find approaches to reducing building energy consumption and realizing the goal of ultra-low energy consumption in buildings. Furthermore, if a process and a systematic framework of data mining application can be established, they will greatly benefit building practice and future analysis.
2.3 Building Energy Prediction Models
In recent years, different models have been developed to predict building energy demand. Generally, these models can be divided into two main categories: regression modelsand ANN models.
Regression models
Regression models correlate building energy demand with relevant variables such as climatic variables (e.g., outdoor/indoor temperature and relative humidity) and physical
18
variables (e.g., wall type, building geometry, and window-to-wall-ratio) (Sullivan and Nozaki, 1984; Sullivan and Nozaki, 1985; O’Neill et al., 1991; Lam et al., 1997; Westergren et al., 1999; Dong et al., 2005; Caldera et al., 2008; Chung and Hui, 2009).For example, Catalina et al. (2008) used regression models to predict the monthly heating demand for single-family residential buildings in temperate climates (16 major cities in France). Ghiaus (2006)used a regression technique to study whether the heating losses and the outdoor temperature have the same distribution, and then developed a regression model for predicting the heat losses.
The main advantage of regression models lies in their computational simplicity. However, this method has a severe limitation: building operational data (e.g., operational data of HVAC systems) is usually recorded at short time intervals, which can be considered instantaneous. As a result, various random disturbances that do not usually follow a normal (Gaussian) distribution, such as occupancy, ventilation rates, and solar gains, can add bias and noise to the data, reducing the correlation and prediction accuracy (Ghiaus, 2006).
ANN models
Previous studies showed that ANN models have also been widely applied to correlate building energy demand with climatic/physical variables (Kreider and Wang, 1992; Anstett and Kreider, 1993; Kawashima, 1994; Stevenson, 1994; Kreider et al., 1995; Andersson et al., 1996; Kreider and Wang, 1997; Aydinalp et al., 2002; Yang et al., 2005; Dong et al., 2005; Ekici and Aksoy, 2009; Li et al., 2009). For example, Olofsson et al. (2001)
19
investigated the potential of a neural network to predict the annual space heating demand of a building, based on the measured average daily outdoor and indoor temperatures and space heating demand for a limited time period. Also, PCA was applied to the measured data for choosing model parameters. The results showed that an ANN was able to produce good predictions except for certain periods when the space heating demand was very low.
The most important advantage of ANN models, over other models, is the ability to provide predictions even for a multivariable mixed-integer problem, which involves both integers (e.g., binary values) and continuous variables (Yao et al., 2006). However, the major limitation of this method is that the network is considered a black-box model—a relationship between the individual influencing factor and output cannot be observed directly.
In summary, a review of the two main energy demand modeling methods was conducted. These two modeling methods have been successfully applied to predict building energy demand. However, regression models involve complicated equations and ANN models operate like a “black box”; therefore, the models developed using these methods are not understandable and interpretable especially for common users without advanced mathematical knowledge. This makes it difficult for these methods to be used as common predictive tools. In order to overcome such limitations, decision tree–based predictive models based on a typical data mining technique (i.e., data classification) are proposed. Generally, the establishment of decision tree–based models does not consider
20
the correlation among input parameters. Also, decision tree–based models use an interpretable tree structure to provide insights into the relationship between various influencing factors and output. The decision tree method will be introduced in more detail in Chapter 3.
2.4 The Effects of Occupant Behavior on Building Energy Consumption
The identification of major determinants of building energy consumption, together with a thorough understanding of the impacts of the identified determinants on energy consumption patterns, could assist in achieving the goal of improving building energy performance and reducing greenhouse gas emissions due to the building energy consumption. As mentioned previously, factors influencing the total building energy consumption can be divided into seven categories:(1) Climate. (2) Building-related characteristics. (3) User-related characteristics, except for social and economic factors. (4) Building services systems and operation. (5) Building occupants’ behavior and activities. (6) Social and economic factors. (7) Indoor environmental quality required.
Among these seven factors, social and economic factors will partly determine occupants’ attitudes toward energy consumption, and building occupants will embody such impact in their daily activities and behavior, thereby influencing building energy consumption. At the same time, indoor environment quality could be regarded as being basically decided by the occupants, thereby influencing building energy consumption. In
21
essence, these two categories of factors which represent occupants’ influences affect building energy consumption indirectly. Therefore, their influences on building energy consumption are already contained within the effects of occupant behavior, and there is no need to take them into consideration when identifying the effects of influencing factors.
The separate and combined influences of the first four factors on building energy consumption can be identified via simulation. With a variety of parameter settings, current simulation software is robust in respect to simulating different situations based upon these four factors. However, it is difficult to completely identify the influences of occupant behavior and activities through simulation due to users’ behavior diversity and complexity; current simulation tools can only imitate behavior patterns in a rigid way. In recent years several models have been established to integrate the influence of building occupant behavior into building simulation programs (Reinhart, 2004; Bourgeois, 2005; Rijal et al., 2007; Hoes et al., 2009). However, these models focus only on typical activities such as the control of sun-shading devices, while realistic building user-behavior patterns are more complicated.
A number of studies (Nakagami, 1996; Lopes et al., 2005; Yu et al., 2010) suggest that, to estimate the effects of user behavior, one possible approach is to extract corresponding useful information from measured building-related data. Generally, the previous studies on the effects of occupant behavior can be divided into two categories. The first category focuses on the effects of building user presence on building energy consumption. For
22
example, Emery and Kippenhan (2006) reported a survey on the effects of occupant presence on home energy usage in four nearly identical houses. The four houses were divided into two pairs, and the building envelope of one pair was constructed with improved thermal resistance. One of each pair of houses was left unoccupied, while the other was occupied. Researchers compared the first heating season’s (1987–88) total energy consumption of the occupied and unoccupied houses (i.e., the sum of heating, lighting, and appliances). They found that the presence of occupants increased the total energy consumption of both occupied houses, and the house with the improved building envelope had a smaller increase.
The second category of studies focuses on the effects of actions occupants took to influence energy consumption. For example, Ouyang and Hokao (2009) investigated energy-saving potential by improving user behavior in 124 households in China. These houses were divided into two groups: one group was educated to promote energy-conscious behavior and put corresponding energy-saving measures into effect in July 2008, while the other group was not informed. Comparisons were made between monthly household electricity uses in July 2007 and July 2008 for both groups. Researchers found that the effective promotion of energy-conscious behavior could reduce household electricity consumption by more than 10%.
Evidently, comparative analyses on measured data were conducted in these studies to identify the effects of user behavior. However, the limitations of this method are
23
significant.
First, apart from user behavior, the other four influencing factors also simultaneously contribute to the variation in building energy consumption, while this method is unable to adequately remove the effects of those four factors and identify the influences of occupant behavior. Although in these studies some measures were implemented to remove the impact of those factors, such as by using nearly identical housing characteristics and by taking energy data in other years with similar climatic conditions as a reference, the effects of these measures are questionable since even a slight difference in some building parameters (e.g., heat loss coefficient) and weather parameters (e.g., annual average outdoor air temperature) would result in remarkable fluctuations in the building energy consumption.
Second, in building databases, buildings are usually described by a mixture of variable types such as numerical variable, categorical variable (e.g., residential building types divided into detached and apartment), and ordinal variable (e.g., buildings rated as platinum, gold, or silver). Such data of mixed variable types is difficult to process by statistical methods that are normally utilized in comparative analyses. This also adds the difficulty of distinguishing between building-related effects and user-related effects.
Third, with regard to comparative analyses, buildings are usually classified into different groups to simplify research. Such classification is commonly based on building-related parameters such as floor area. For example, if building floor area ranges
24
from 100 m2 to 400 m2, it can be classified as small, medium, and large corresponding to the intervals [100, 200), [200, 300), and [300, 400], respectively. The partitioning of building-related parameters is normally decided by considerations of convenience and intuition. Why should 200 m2 and 300 m2 be the interval between each group? Hence, a more rational classification method is required for grouping buildings.
Moreover, buildings are commonly represented by various typical parameters at the same time, such as building age and floor area. These parameters may be divided into different levels for simplicity, such as low and high. In order to perform a comprehensive investigation, the sample size (i.e., number of buildings) necessary for research should be determined by the combination of different levels of all parameters. For example, suppose seven typical parameters are selected for representation and each are stratified into 3 levels (e.g., small, medium, and large). Combinatorial theory shows that at least 37 = 2187 buildings should be investigated for comparison, which may be impractical.
In summary, it is difficult to identify the effects of occupant behavior on building energy consumption, since the influence of other energy use determinants cannot be removed. In this research, we propose one of the typical data mining techniques, clustering analysis, for examining the individual effects of occupant behavior. Clustering is an unsupervised learning algorithm. Its goal is to identify a set of previously undefined clusters among data by using special mathematical techniques based on the similarity of the data features. This technique will be introduced in more detail in Chapter 3.
25
2.5 Discovering Associations and Correlations among Measured Data
Building-related data may have a direct/indirect influence on each other, considering that they are closely related to the same buildings. Specifically, there may be strong associations (i.e., connections or relationships) and correlations between them. Both these associations and correlations should be examined to understand building operation, determine rules of conserving energy, and develop appropriate strategies to design buildings.A number of studies have been conducted to identify associations and correlations between measured building-related data. Researchers utilized statistical analysis techniques, particularly regression analysis, and focused mainly on the relationships between building energy consumption and its influencing factors, such as building physical parameters (Yu and Chow, 2001; Deng, 2003; Yu et al., 2010), occupancy patterns (Priyadarsini et al., 2009; Yu et al., 2011), building operation and management (Chung and Hui, 2009), social and economic factors (Tonooka et al., 2006), indoor air quality requirements (Chen et al., 2010), and weather conditions (De la Flor et al., 2006). However, few researchers examined associations and correlations between building operational data, especially operational data of HVAC systems, to better understand building operation in order to improve building performance. This is mainly due to the complexity of such data and a lack of effective data analysis techniques. Note that the energy consumption of HVAC systems can account for a large portion of total building
26
energy consumption (Pérez-Lombard et al., 2011).
The main data analysis methods used to discover associations and correlations among measured data within the building engineering domain (i.e., statistical analysis techniques) were reviewed in Section 2.1.2. The limitation of these techniques was also addressed. Moreover, many parameters are usually monitored and huge amounts of operational data are collected on HVAC systems. Consequently, it is difficult, and often infeasible, for data analysts to conduct statistical analyses, correlation analyses for example, on every combination of parameters in order to discover all of the associations and correlations that are crucial for achieving optimum building performance.
In this research, we propose one of the most widely applied techniques in data mining (i.e., association rule mining) for discovering all the useful and important associations and correlations between building operational data. This technique will be introduced in more detail in Chapter 3.
2.6 Approaches to Modifying Occupant Behavior in Residential
Buildings
Recently there has been mounting interest in studying occupant behavior in buildings and in developing methodologies for identifying the corresponding energy-saving potential. As reviewed in Section 2.4, Ouyang and Hokao (2009) investigated the energy-saving potential by improving user behavior in 124 households in China. Al-Mumin et al. (2003) simulated occupant behavior improvement (i.e., occupant behavior before and after
27
modification) and the corresponding annual electricity consumption reduction by using the energy simulation program ENERWIN. They first collected data and information on occupancy patterns and operation schedules of electrical appliances in 30 selected residences in Kuwait. This data and information were then used in ENERWIN to replace the default value. A house was then selected as a case study, and the simulation results showed that the annual electricity consumption in this house was increased by 21%. The results also indicated that the ENERWIN’s default parameters (i.e., parameters taken from the software manual) are probably more appropriate for the Western lifestyle. Moreover, it was found that a 39% reduction in energy consumption can be achieved by improving occupant behavior such as turning off lights when rooms are empty and setting the air conditioner thermostat to a higher temperature (but still within the comfort level).
Two approaches (i.e., energy-saving education and building simulation) were used to modify occupant behavior in residential buildings and identify the corresponding energy-saving potential. These approaches can help to modify occupant behavior and have an immediate effect on the building energy consumption reduction. However, both approaches have certain limitations (Yu et al., 2011).
Regarding the energy-saving education approach, commonly detailed energy-saving measures and tips on the efficient use of various household appliances should be provided for occupants. Considering that a family normally has a number of appliances, and that each appliance may have various tips (e.g., for refrigerators: reduce the number of door
28
open times and its duration, keep coils and filters clean, position it away from heat sources, etc.), there could be a large number of energy-saving measures and tips for an individual family. For example, one family may have 30 household appliances, with each appliance having an average of 8 energy-saving tips. Accordingly, the occupants need to follow and implement 240 tips, which is impractical. Although a booklet of these tips can be prepared for building occupants, it is very difficult for occupants to remember them all distinctly and implement them for a long time in practice. Furthermore, occupants may not fully understand and have confidence in these tips’ effectiveness because they only provide qualitative information. In addition, some energy-saving opportunities can only be initiated by building occupants. For example, when occupants realize they have consumed too much energy on both computers and TVs, they can avoid using both devices simultaneously when they can really only focus on one of them, or make a conscious effort to reduce usage time. Therefore, instead of simply providing occupants with a number of general energy-saving recommendations, it is more rational and efficient to help them modify their behavior in two steps. First, it is necessary to identify the behavior that needs to be modified. This can be achieved by analyzing measured building-related data. Second, feasible recommendations to mitigate the identified behavior can be presented with the goal of reducing energy consumption in the home.
With regard to the building simulation approach, current simulation tools can only imitate some typical activities in a rigid way, such as the control of sun-shading devices,
29
while realistic building occupant behavior patterns are more complicated.
In summary, a methodology is needed for evaluating occupant behavior in existing residential buildings and for helping occupants modify their activities efficiently through analyzing measured building-related data. In this research, a methodology is proposed based on the three data mining techniques: clustering analysis, data classification, and association rule mining.
30
3.
DATA MINING PROCESS AND FRAMEWORK FOR
KNOWLEDGE DISCOVERY
In this chapter, a data analysis process and a systematic data mining framework aimed at mining hidden and useful knowledge from measured building-related data are proposed. Three data mining techniques are introduced: data classification, cluster analysis, and association rule mining. Finally, measured building-related data collected for the case studies in this research is described.
3.1 Proposed Data Analysis Process
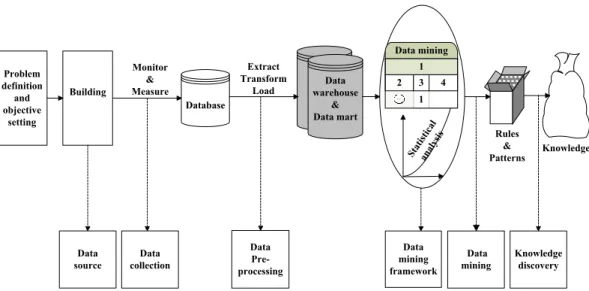
The adopted data analysis process is depicted in Figure 3-1.
Building Database Data warehouse & Data mart Rules & Patterns Knowledge 1 椭圆 2 3 4 1 Data mining Data mining framework Stat istic al anal ysis Data source Data collection Data Pre-processing Data mining Knowledge discovery Problem definition and objective setting Monitor & Measure Extract Transform Load
Figure 3-1 Process for data analysis within the building engineering domain
31
(1) Problem definition and objective setting;
(2) Data source selection: select buildings available to collect measured building-related data;
(3) Data collection: collect building-related data through building automation systems, field survey, etc., and then construct a database;
(4) Data preprocessing/preparation: detect and remove outliers and noise, handle missing values, deal with inconsistencies and complexity through data transformation and integration, etc.;
(5) Data warehouses (DWs) or data marts construction: construct DWs or data marts so as to provide on-line analytical processing. The gray block in Figure 3-1 denotes that the step was unnecessary in this study. First, the measured building-related data were collected and processed while on-line analytical processing was not necessary. Second, the database is relatively small and there is no need to build a high-dimensional DW; (6) Data mining and model construction: perform data mining based on the proposed data mining framework. In particular, three data mining techniques are utilized: data classification, cluster analysis, and association rule mining. Traditional statistical analysis is also employed as a supplementary tool, such as the verification of data mining results; (7) Results analysis and evaluation: identify the most useful rules and patterns from the data mining results;
32
expertise and obtained rules/patterns.
3.2 Proposed Data Mining Framework
Figure 3-2 shows the data mining framework proposed in this study. The framework is composed of measured building-related data, selected data mining techniques and algorithms, and output of useful knowledge about building energy performance evaluation and improvement.
In this framework, three data mining techniques are employed as a primary tool. Note that each data mining technique can be achieved by different algorithms. For example, data classification can be conducted by using the decision/regression tree algorithm; cluster analysis can be conducted by using the K-Means/K-Modes algorithm; association rule mining can be conducted by using the Apriori/FP-growth algorithm. Furthermore, different data mining techniques can be combined to mine building-related data, such as the cluster analysis and data classification (e.g. clustering-then-classification, see Chapter 7), the cluster analysis and association rule mining (e.g. association rule clustering system and frequent pattern-based clustering analysis). For demonstration purposes, some algorithms (e.g. decision tree, K-means clustering, and FP-tree) were used in this study to address the four problems outlined in Chapter 1. An overview of these data mining algorithms is presented in the following sections. The reader can refer to the data mining textbooks (Cios, et al., 2007; Rokach and Maimon, 2008; Cao et al., 2009) for more detailed descriptions and mathematic formula of the algorithms.
33
Based on the proposed process and framework, architects and researchers could analyze measured building-related data efficiently and extract useful hidden knowledge which could help to account for interactions between building energy consumption and its influencing factors. Note that a clear and thorough understanding of such interactions could provide essential guidance in presenting energy-saving opportunities.
3.3 Data Mining Techniques
This section first present basic terms and concepts in relation to data mining, and then introduces the three data mining techniques, as well as the data mining algorithms employed in this study. Useful terminologies are:
Dataset, Attribute, and Instance: a dataset is a set of data items. It is roughly equivalent to a two-dimensional (i.e. column and row) spreadsheet or database table, as shown in Figure 3-3. Each database table consists of a set of attributes (usually in different columns or fields) and stores a large set of instances (usually in rows or records). Consider an HVAC system with 100 monitored parameters. Each parameter can be considered an attribute, and a record of all these parameters in a specific time point can be considered an instance.
34
Collected data Data mining techniques used as a primary tool
Data mining application within the building engineering domain
Building performance evaluation & improvement components
Building energy demand modeling Identification of effects of occupant behavior on building energy consumption
Provide low/no cost operational strategies and
achieve efficient building operation Identification and improvement of occupant behavior that needs to be modified Statistical significance, Correlation analysis, Confidence level, etc.
Traditional statistical analysis used as a supplementary tool
Data mining algorithms Cluster analysis
Merging and clustering measured building-related data Building operational data Building physical parameters Climatic data User-related parameters Mining all the associations and
correlations among data Decision/regression trees for
building energy demand prediction
Data classification Association rule mining
Apriori FP-growth Decision tree Regression tree Association rule clustering system (ARCS) Frequent pattern-based clustering analysis Clustering-then -classification K-Means & K-Modes