MODEL-BASED DECISION SUPPORT FOR SEPSIS
ENDOTYPES
by
Li Ang Zhang
BS, Chemical Engineering and Biomedical Engineering,
Carnegie Mellon University, 2012
Submitted to the Graduate Faculty of
the Swanson School of Engineering in partial fulfillment
of the requirements for the degree of
Doctor of Philosophy
University of Pittsburgh
2017
UNIVERSITY OF PITTSBURGH SWANSON SCHOOL OF ENGINEERING
This dissertation was presented by
Li Ang Zhang
It was defended on August 25th 2017 and approved by
Robert S. Parker Ph.D., Professor, Department of Chemical and Petroleum Engineering Ipsita Banerjee, Ph.D., Associate Professor, Department of Chemical and Petroleum
Engineering
Gilles Clermont, M.D., Professor, Department of Critical Care Medicine David Swigon, Ph.D., Associate Professor, Department of Mathematics
Dissertation Director: Robert S. Parker Ph.D., Professor, Department of Chemical and Petroleum Engineering
Copyright cby Li Ang Zhang 2017
MODEL-BASED DECISION SUPPORT FOR SEPSIS ENDOTYPES
Li Ang Zhang, PhD University of Pittsburgh, 2017
Sepsis is a high mortality syndrome characterized by organ dysfunction due to a severe and dysregulated acute inflammatory response to infection. Research into therapies for this syn-drome has historically ended in failure, which has largely been attributed to the elevated levels of subject heterogeneity. What may have been previously attributed to variability in sepsis may be due to mechanistic differences between patients. Endotypes are distinct sub-types of disease, where underlying causes such as mechanistic or pathway related differences manifest into phenotypes of disease.
The lack of mechanistic understanding of immune mediator dynamics and the responses they trigger necessitates a mathematical modeling approach to analyze its complexities. A transfer function model is proposed to describe and cluster the dynamics of key inflamma-tory mediators. Five sepsis endotypes were discovered and revealed motifs of overwhelming inflammation, various levels of immunosuppression, sustained inflammation, and immunod-eficiency. An accurate clinical tool was proposed to classify subjects into endotypes using six-hour trajectories of clinical data.
A physiological ordinary differential equation model of sepsis is proposed that charac-terizes the interactions of inflammatory signaling molecules, neutrophils, and macrophages across the bone, blood, and tissue compartments of the body. This model used to gener-ate individual subject fits against human sepsis data. Population-level parameter analysis implicated macrophage cell death and cytokine half- dynamics in endotype-level differences. Several proof-of-concept statistical models were introduced to demonstrate that it is possible to estimate the pre-hospital time of sepsis subjects and to quantify their
sepsis-induced systemic tissue damage. A nearest-neighbor-based method was verified against animal and human data and revealed that identifying infection time-zero of sepsis patients can be quickly estimated with high accuracy using commonly measured clinical features. A logistic regression ensemble model demonstrated revealed early organ dysfunction were significant contributors to systemic damage and mortality. Knowledge of time-zero and systemic damage levels, in combination with an endotype classifier, provides clinicians with a clear depiction of where a subject is located on their sepsis trajectory. Such a decision support system enables therapy timing, early organ support, and targeted therapies to guide personalized treatment and shift patients towards better outcomes in sepsis.
Keywords: mathematical modeling, sepsis, cytokines, ordinary differential equations, ma-chine learning, statistical analysis.
TABLE OF CONTENTS
PREFACE . . . xv
1.0 INTRODUCTION . . . 1
1.1 Background and Significance . . . 1
1.2 Problems with Current Approaches in Sepsis Therapy . . . 4
1.3 Decision Support Systems . . . 6
1.4 Dissertation Overview . . . 6
2.0 HIERARCHICAL CLUSTERING APPROACH TO IDENTIFY SEP-SIS ENDOPHENOTYPES. . . 9 2.1 Methods. . . 11 2.1.1 Heatmap . . . 14 2.1.2 Statistical Analysis . . . 15 2.2 Results . . . 15 2.2.1 High-Risk Endophenotypes . . . 20 2.2.2 Low-Risk Endophenotypes . . . 21
2.2.3 Similarity between Endophenotype . . . 22
2.3 Discussion . . . 23
2.3.1 Study Limitations . . . 26
2.3.2 Application into Temporal qSOFA Trajectories. . . 26
2.3.3 Summary . . . 28
3.0 MIXTURE MODELING APPROACH TO IDENTIFY SEPSIS EN-DOTYPES . . . 29
3.1.1 Systems Analysis and Mixture Modeling . . . 34
3.2 Results . . . 38
3.2.1 Statistical Analysis of Endotypes . . . 42
3.3 Discussion . . . 43
3.3.1 Study Limitations and Potential Improvements . . . 47
3.3.2 Bedside Endotype Classification Tool . . . 50
3.3.3 Clinical Implications . . . 51
3.3.4 Summary . . . 52
4.0 MECHANISTIC DIFFERENCES BETWEEN ENDOTYPES . . . 54
4.1 Methods. . . 55
4.1.1 Model Formulation and Simulation . . . 56
4.1.1.1 Initiation of Inflammation and the Cytokine Storm . . . 58
4.1.1.2 Cytokine Diffusion and their Roles . . . 59
4.1.1.3 Neutrophil Dynamics . . . 61
4.1.1.4 Pathogen Dynamics . . . 65
4.1.1.5 Macrophage Dynamics . . . 65
4.1.2 Model Post-hoc Analysis . . . 67
4.2 Results . . . 69
4.3 Discussion . . . 75
4.3.1 Study Limitations . . . 80
4.4 Summary . . . 80
5.0 IDENTIFICATION OF TRUE SEPSIS TIME-ZERO AND QUANTI-FYING SEPSIS-INDUCED DAMAGE . . . 82
5.1 Pre-hospital Time Identification . . . 82
5.1.1 Methods . . . 83
5.1.1.1 One-Nearest-Neighbor . . . 84
5.1.1.2 In Silico Experiments and Validations . . . 88
5.1.2 Results . . . 89
5.1.2.1 Feasibility Experiments . . . 91
5.1.3 Discussion . . . 95
5.1.3.1 Study Limitations . . . 96
5.1.4 Translation into GLUE Grant Human Trauma Subjects . . . 97
5.1.5 Summary . . . 99
5.2 Systemic Damage Models . . . 99
5.2.1 Methods . . . 100
5.2.2 Results . . . 103
5.2.2.1 Damage Trajectories . . . 103
5.2.3 Discussion . . . 108
5.2.4 Summary . . . 110
6.0 RELEVANT MODELING TOOLS . . . 111
6.1 Boolean-LP, a Network Pathway Optimizer . . . 111
6.1.1 MILP Formulation of Network Optimizer Problem . . . 113
6.1.2 Detailed Formulation Example . . . 115
6.1.3 Applications in Age-related Immune Pathways . . . 116
6.2 APT-MCMC, a C++/Python implementation of Markov Chain Monte Carlo for Parameter Identification . . . 116
6.2.1 Methods . . . 123
6.2.1.1 APT-MCMC Package . . . 123
6.2.1.2 APT-MCMC Performance Evaluation . . . 127
6.2.2 Results . . . 133
6.2.2.1 Benchmarks. . . 133
6.2.2.2 Hyperparameters . . . 134
6.2.2.3 Van de Vusse Reaction Scheme . . . 139
6.2.2.4 Bioreactor. . . 142
6.2.2.5 Limitations . . . 142
6.2.3 Summary . . . 143
7.0 SUMMARY AND FUTURE WORK . . . 144
7.1 Contributions . . . 145
7.1.2 Mechanistic Ordinary Differential Equation Model of Sepsis. . . 146
7.1.3 Quantifying Pre-hospital Time and Systemic Damage . . . 146
7.1.4 Efficient MCMC Sampling Software for Parameter-Fitting . . . 147
7.2 Future Work . . . 148
7.2.1 Predicting Organ Failure . . . 148
7.2.2 Early Endotype Classifier . . . 148
7.2.3 Improving Neutrophil Dynamics with Damage . . . 149
7.2.4 Estimator of Pre-hospital Time . . . 150
7.2.5 Optimization of Therapy and Damage . . . 151
7.2.6 Updates to APT-MCMC . . . 152
7.3 Improving Sepsis Clinical Outcomes with Mathematical Models . . . 152
APPENDIX A. DETAILED RESULTS FOR NEAREST-NEIGHBOR PRE-HOSPITAL TIME ESTIMATION TOOL . . . 154
APPENDIX B. DETAILED BENCHMARK FUNCTIONS USED TO VAL-IDATE APT-MCMC . . . 158 B.0.1 Ackley . . . 158 B.0.2 Adjiman . . . 160 B.0.3 Alpine . . . 161 B.0.4 Bard . . . 162 B.0.5 Beale . . . 163 B.0.6 Bird . . . 164 B.0.7 Bohachevsky . . . 165 B.0.8 Booth . . . 166 B.0.9 Bukin . . . 167 B.0.10 Corana . . . 168 B.0.11 Damavandi . . . 169 B.0.12 Devilliers-Glasser . . . 170 B.0.13 Eggholder . . . 171 B.0.14 Griewank . . . 172 BIBLIOGRAPHY . . . 173
LIST OF TABLES
1.1 Overview of Select Sepsis Therapeutic Agents and Their Efficacy in Animal
Models and in Human Trials. . . 4
2.1 Comparison of convenience cohort for hierarchical clustering against the rest of ProCESS database . . . 12
2.2 Comparison of endophenotypes identified via hierarchical clustering . . . 19
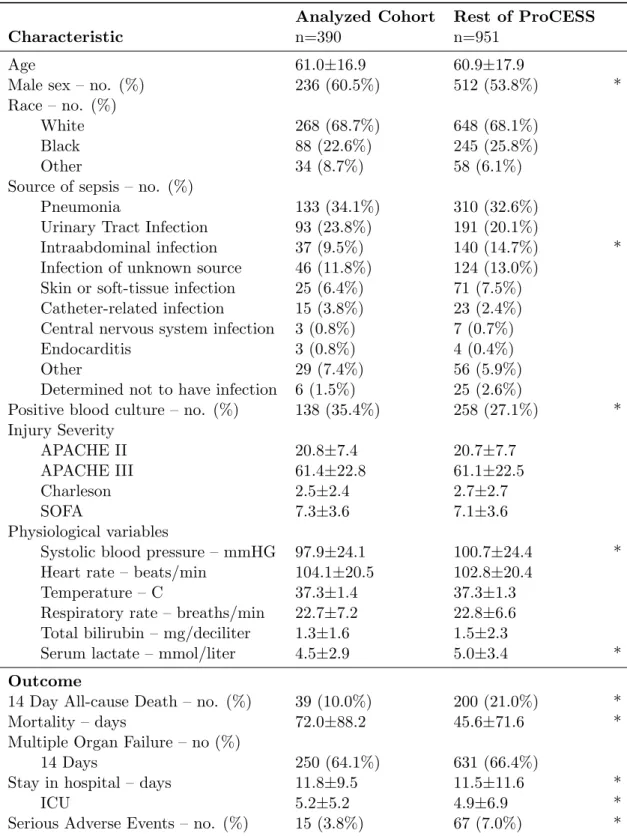
3.1 Comparison of convenience cohort for mixture model against the rest of Pro-CESS database . . . 33
3.2 Summary of the Five Identified Endotypes . . . 40
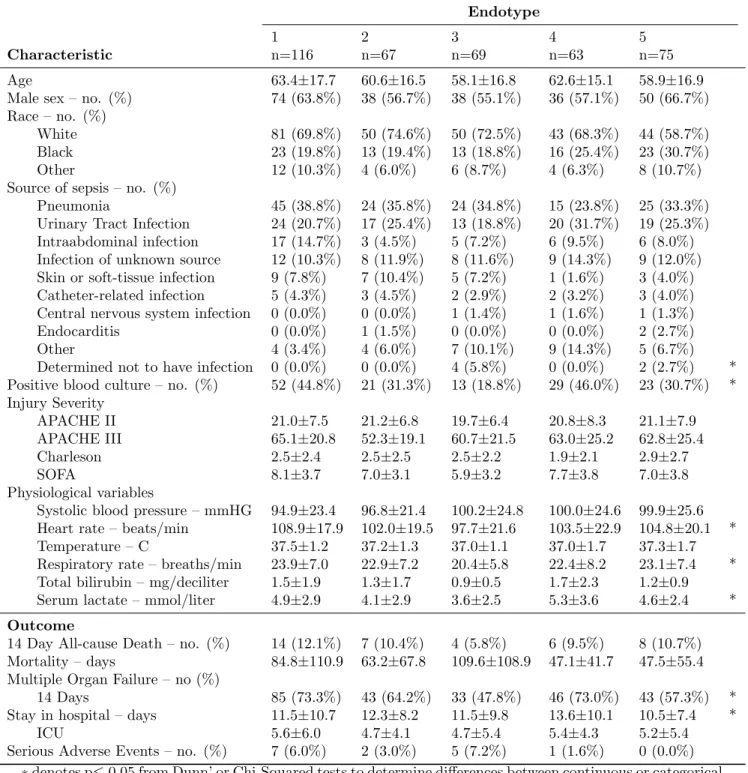
3.3 Comparison of baseline characteristics and outcomes between each endotype 41
3.4 Contingency table comparing endotype memberships between Chapters 2 and 3 44
5.1 Dictionary of biomarker acronyms . . . 85
5.2 Time-of-infection estimation accuracy over varying right censor values (tem-poral durations) . . . 90
5.3 Multiple biomarker prediction accuracy . . . 91
5.4 Prediction accuracy of longitudinal vital signs With a single blood biomarker 93
5.5 Prediction accuracy of longitudinal vitals With different diagnostic blood panels 94
5.6 Acronym dictionary of biomarkers for damage results . . . 104
6.1 Overview of the Markov Chain Monte Carlo nomenclature used. . . 124
6.2 Simulation settings for benchmark tests . . . 129
6.3 Overview of APT-MCMC Performance on several benchmark functions . . . 133
6.4 Comparison of computing resources used by APT-MCMC and Python package
A1 Time-of-infection estimation accuracy over varying right censor values (tem-poral durations for all biomarkers tested) . . . 155
A2 Prediction accuracy of longitudinal vital signs with a single blood biomarker on porcine peritonitis experiment . . . 156
A3 Prediction accuracy of longitudinal vital signs with a single blood biomarker on porcine LPS experiment . . . 157
LIST OF FIGURES
1.1 Simplified schematic of the inflammatory response . . . 3
2.1 Heatmap of clustered baseline biomarkers in 493 patients with 6 identified subclusters . . . 16
2.2 Heatmap of 6-hour biomarkers in 493 patients with 6 identified subclusters . 17
2.3 Heatmap of 24-hour biomarkers in 493 patients with 6 identified subclusters . 18
2.4 Multivariate energy-distances between endophenotypes A-F and their time points. . . 23
2.5 Clustered Trajectories of qSOFA scores in patients with suspected infection. Shades of red indicate the severity of qSOFA scores and gray indicates missing measurements. Patients with low baseline qSOFA scores (qSOFA=0,1, sur-vivors) were more likely to remain low over 48 hours than nonsurvivors. Two patients with a baseline qSOFA score of 3 survived. . . 27
3.1 Schematic of clustering challenge associated with endotype identification . . . 32
3.2 Schematic of a mass-spring-damper system serving as a physical analog to the inflammatory response . . . 35
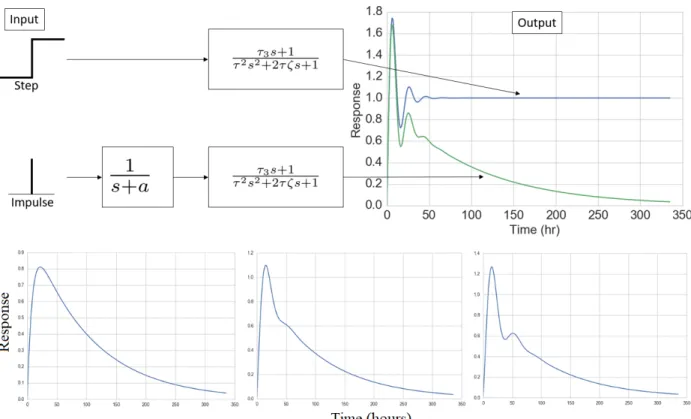
3.3 Sample unit step responses of the three transfer functions used . . . 36
3.4 Results from the cluster identification process (5 sepsis subtypes) . . . 39
3.5 Omnibus testing (Dunn’s test) on 6-hour biomarker trajectories from each endotype . . . 43
3.6 Heatmap illustrating clinical biomarker progression over each endotype . . . 47
3.7 Machine Learning Derived regions of mortality based on IL-6 and IL-10 values at 72-hours . . . 48
3.8 Schematic of impulse-response behaviors to explore in order to address current
methodological weaknesses . . . 49
4.1 Diagram illustrating the sepsis ODE model . . . 68
4.2 Sample fit for endotype 1, which was characterized by overwhelming inflam-mation. . . 70
4.3 Sample fit for endotype 2, which was characterized by a protracted anti-inflammatory response. . . 71
4.4 Sample fit for endotype 3, which was characterized by immunosuppression. . 72
4.5 Sample fit for endotype 4, which was characterized by sustained inflammation. 73 4.6 Sample fit for endotype 5, which was characterized by a quick and short in-flammatory response. . . 74
4.7 Distribution of significant parameters among endotypes . . . 76
4.8 Joint distribution plot of significant macrophage parameters. . . 78
4.9 Joint distribution plot of significant cytokine decay parameters . . . 79
5.1 Schematic demonstrating data preparation process for testing of the pre-hospital time estimation tool . . . 86
5.2 Schematic demonstrating the method of the pre-hospital time estimation tool 87 5.3 Histogram of pre-hospital times in the Glue Grant database . . . 98
5.4 Predictors (and their frequency) used to generate damage curves . . . 105
5.5 Predictors (and their frequency) used to generate damage curves in a missed measurement scenario . . . 106
5.6 Systemic tissue damage trajectories for baboons using easy to measure biomark-ers . . . 107
5.7 Systemic tissue damage trajectories for baboons using sparse biomarkers . . . 108
6.1 MCMC results from exploring a highly correlated probability function . . . . 118
6.2 Effects of varying temperatures on the Boltzmann distribution . . . 121
6.3 Schematic of generating an APT-MCMC simulations. . . 126
6.4 Visualizations for the benchmarks tested . . . 128
6.5 100 repeated simulations were used to test the effects of the nensemble hyper-parameter by using the dimension-scalable Ackley benchmark function . . . . 136
6.6 Effects of the nchains hyperparameter . . . 137
6.7 Effects of the nsteps hyperparameter . . . 138
6.8 Effects of the step size hyperparameter . . . 139
6.9 Parameter histogram for the Van de Vusse reaction . . . 140
6.10 Data and best parameter fit for the Van de Vusse reaction scheme system . . 140
6.11 Parameter histogram for the bioreactor fitting problem . . . 141
PREFACE
I begin by thanking my family for supporting me through this Ph.D. journey. I left my home to pursue higher education in Pittsburgh and somehow ended up staying there for 9 years. I would like to thank my grandfather for introducing me to the clinical world and for inspiring me to help others. My mom and dad deserve more than my thanks for their mentorship, advice, and assistance throughout the years. Thank you for pushing me to do grad school. I promise I will call more often.
Next, I want to thank Annie for putting up with me for many, many years. Somehow, life keeps putting us in a long-distance relationship, but we persevered. You have been a great best friend, sous chef, roommate, travel companion, and life partner. I truly apologize that I had to propose to the Ph.D. committee first.
Matt, thank you for being my “brofessor” and teaching me the secrets to getting swole. I enjoyed shredding powder, brewing Lyapunov, fishing for catfish, and driving the Autobahn with you. Michelle, I enjoyed hanging out with you and discussing our love for dogs and bourbon. Thank you for being my best friend in Pittsburgh (Matt lost that privilege when he decided to graduate first). Ari, thank you for the board game nights and long discussions about MCMC. Tim, thank you for introducing me to Python, ArchOS, and other tangents that effectively distracted me from my research problems. Flo, thank you for being the first to use APT-MCMC in its C++ form. I also enjoyed our lengthy conversations about politics and how we want to improve the world. Megan, I hope that someday we get to run together. I am still searching for a marathon buddy after my last one bailed on me. Christy, thank you for being a good friend, hosting events at your place, and teaching me how to brew. Evan, Monica, and Matt 2.0, it has been great working with you in the lab and I envision great things from all of you in the future.
Bob, thank you for letting me into your lab (on the second try), for tempering my ego, and for tolerating my antics. I appreciate the freedom that you gave me over the years on my research and the unfettered access to your servers. Finally, it was a joy to learn from you and your ideas (that I always think will not work) has been invaluable. I will always enjoy discussing Advanced Applied Bioreactors with you. Gilles, thank you for your guidance in an impressive array of fields. In one meeting with you, I can learn about a clinical topic and then learn about machine learning. Ipsita, thank you for being my mentor since my CMU days and for enduring my early mistakes in the lab. David, it has been a pleasure working with you in MODS and your insights have saved me on many occasions.
I apologize for the people whom I missed who have helped me on this journey. Grad school has helped me grow in many ways and I am eager to make my mark in the world. I believe that in our lifetime, a major, positive shift towards personalized medicine is coming. It is my sincere hope that this work serves as a stepping stone towards that goal.
Li Ang Zhang
张黎昂
August 2017, Pittsburgh, Pennsylvania
1.0 INTRODUCTION
1.1 BACKGROUND AND SIGNIFICANCE
Each year, sepsis afflicts millions worldwide with extensive morbidity and mortality [1]. This syndrome predominately affects opposite sides of the age spectrum: the pediatric and the elderly, where the incidence and mortality rates increase for each [2]. As such, mortality exceeds 40% for the 85 and older age group [2]. Treatment of sepsis has proven to be a challenge because of the fast-changing dynamics, multiple trajectories, and outcomes of the syndrome [3, 4]. Clinical features of sepsis are highly variable and are dependent on the infection site, type of infection, patient demographics, coexisting illnesses, organ dysfunction, and time since sepsis onset [5]. In the past year, sepsis was redefined for the third time, out-dating several diagnosis criteria, such as the Systemic Inflammatory Response Syndrome and the Logistic Organ Dysfunction System. The prevalence of multiple criteria is indicative of the current debate and disagreement among medical professionals [6]. As a result, there is currently no gold standard with which to diagnose sepsis [7].
Advancements in sepsis therapeutics can be generalized as stagnant, where within the past 30 years, the majority of clinical trials for pharmacological interventions in sepsis showed either no effect or a negative effect on mortality [5, 8]. The most promising sepsis therapy, activated protein-c, was briefly approved by the Food and Drug Administration (FDA) following a successful trial in 2001. However, by 2011, a follow-up study revealed that this therapy was ineffective at decreasing mortality and thus the FDA subsequently removed it from the market [1]. To date, there is currently no FDA-approved drug that replaced activated protein-C to treat sepsis [7].
The various pathways to failure as well as the fact that sepsis is often coupled with many comorbidities result in high inter- and intra-patient variabilities of the syndrome. This has led to difficulties in defining, diagnosing, and treating sepsis[7].
Sepsis is a severe acute physiological response that results from the systemic effects of a dysregulated acute inflammatory response to infection and is characterized by organ dysfunction [7]. Acute inflammation represents the first line of defense against infection. First, the body mobilizes immune mediators [3]. These mediators enable the body to mount an antimicrobial response to remove the source of infection, but in doing so damages healthy cells during the process. During severe infections and/or severe damage, overwhelming inflammation may occur [9]. This leads to the systemic inflammation syndrome known as sepsis. Once triggered, three outcomes are possible [3]. The first (i) is the healthy outcome, where the body is able to remove the infection source and inflammatory pathways are properly deactivated. The second (ii) is immunosuppression or immunodeficiency, which can lead to recurrent infection or uncontrolled growth of the invading pathogens [3]. The third case (iii), aseptic sepsis, is persistent inflammation where the dysregulation causes sustained inflammation even after the infection source has been dealt with [3].
During an acute inflammatory response, there are three phases: initiation, the inflam-mation response, and resolution. Embedded in almost all tissue, resident macrophages are responsible for the recognizing nearby pathogens and initiating the inflammatory response by producing a variety of inflammatory mediators including chemokines, cytokines, and va-soactive agents [10]. Important cytokines such as Tumor Necrosis Factor-α (TNF-α) and Interleukin-6 (IL-6) recruit neutrophils towards the site of infection by effecting change on the cell membrane, causing neutrophils to physically roll along endothelial walls [11]. The Interleukin-8 (IL-8) chemokine stops the rolling and allows neutrophils to extravasate through endothelial walls without erythrocyte leakage [10,11]. Neutrophils migrate through the tissue and, upon reaching the infection site, become activated and release toxic sub-stances to eliminate the pathogen. Most of these subsub-stances are reactive oxygen species. During this stage, M1 (pro-inflammatory monocyte-derived) macrophages are simultane-ously recruited to the infection site via similar cytokine and chemokine interactions in order to aid the elimination effort and to produce additional mediators to sustain inflammation
[12,13]. Upon removing the pathogen, macrophages shift production from pro-inflammatory mediators to anti-inflammatory mediators and begin the resolution phase [10,13]. IL-6 tran-sitions its effect from a neutrophil recruiter to a monocyte recruiter [14]. During this stage, recruited monocytes exhibit an anti-inflammatory phenotype and may differentiate into M2 macrophages [13]. M2 macrophages become more prevalent in tissue and are responsible for producing Interleukin-10 (IL-10), a master anti-inflammatory cytokine [13, 15]. Addition-ally, macrophages remove dead tissue and promote repair [10,12]. Finally, the inflammatory cascade is turned off due to the presence of IL-10 and by the lack of IL-6 and TNF-α produc-ing M1 macrophages. This healthy scenario represents case (i). This process is illustrated by the simplified diagram shown in Figure 1.1. The healthy scenario, case (i), occurs when pathogens are fully eliminated and the anti-inflammatory compartment successfully resolves the inflammatory compartment.
Figure 1.1: Simplified schematic of the inflammatory response. Pathogens invading the host triggers an inflammatory response. This response eliminates pathogens, but causes unavoidable collateral damage to healthy tissue, thereby causing damage. This damage further initiates inflammation. Inflammation also triggers an anti-inflammatory response. The anti-inflammatory response inhibits the inflammatory response. Adapted from Reynolds, et al, 2006 [4].
Sepsis may result when one or more aspects of acute inflammatory response become dysregulated. This often occurs due to high pathogen load or within the immunocompro-mised elderly. During the neutrophil-dominant stage, high levels of neutrophil activity may trigger the aseptic sepsis case (iii). The substances released by neutrophils are highly toxic and cause unavoidable collateral damage to nearby tissue [10]. This damage triggers further inflammation and leads to a persistent inflammatory response, which in turn causes more
tis-Table 1.1: Overview of Select Sepsis Therapeutic Agents and Their Efficacy in Animal Models and in Human Trials.
Therapeutic Agent Mortality Benefit
Name Description Positive None or Negative
IL1-RA IL-1 receptor antagonist Mouse[16], Baboon[17] Human[18] MPSS Glucocorticoid Baboon[19] Human [20] Lenercept TNF-α receptor antagonist Baboon[21] Human [22] CDP571 anti-TNF-α antibody Baboon[23] Human [24] BN 5021 PAF antagonist Mouse [25] Human [26] BB-882 PAF receptor antagonist Mouse [27] Human [28] TCV-309 PAF antagonist Mouse [29] Human [30] TAK-242 TLR-4 inhibitor Mouse [31] Human [32] Tifacogin Preventing coagulation Mouse [33], Baboon [34] Human [35]
(IL1-RA: Interleukin-1 receptor antagonist, MPSS: Methylprednisolone sodium succinate, TNF-α: Tumor necrosis factor alpha, PAF: Platelet activating factor, TLR-4: Toll-like receptor 4)
sue damage. This cycle persists even if the pathogen is fully eliminated. Organ dysfunction and failure, prolonged ICU stays, metabolic abnormalities, and/or death are common con-sequences of this case [7]. Another dysregulation occurs if the anti-inflammatory pathway is triggered prior to the full elimination of pathogens, triggering case (ii). A high inflammatory response may trigger a similarly high anti-inflammatory response too early. In this scenario, the host immune response is unable to mount a sufficient attack on the pathogen and the host may succumb to the infection.
1.2 PROBLEMS WITH CURRENT APPROACHES IN SEPSIS THERAPY
Given the complexities of the inflammatory pathways, much of sepsis research and exper-iments are derived from animal models. Promising therapies in animal models have often failed in human trials due to a lack of efficacy or due to safety concerns [36, 37]. Table
1.1 outlines several promising sepsis therapeutic agents over the years that demonstrated significant mortality benefits in animal trials but not human trials. The historical lack of
successful clinical trials has resulted in pharmaceutical companies referring to sepsis as a “graveyard” [38]. The sheer amount of inter- and intra-patient variability in septic humans contribute to this translational disconnect. For example, this disconnect may result from patient differences in pre-existing disease burden or the timing of applied therapeutics [39–
42]. Animal models typically use identical animals with uniform levels of inflammation (low genetic variability and controlled induction of sepsis) and controlled therapy timing (applied exactlyxhours after experimentally induced sepsis). Applying this level of control in human trials is currently infeasible because of the inability of clinicians to quantify such variability for each human patient.
Mechanistic understanding of sepsis may hold the answers behind sepsis heterogeneity and differences in inflammatory pathways. The mechanistic differences in inflammatory path-ways can result from immunosenescence, age-related differences in immunity [43]. Analysis of genomic data from human sepsis subjects suggests that certain populations are predis-posed to sepsis due to mechanistic implications of certain gene mutations [44]. Furthermore, a fixed-effect analysis of this data, a statistical approach to identify confounding effects on these gene mutations, revealed that age, ethnicity, and comorbidities may be important fac-tors. These findings lend evidence to the idea that sepsis heterogeneity can be attributed to pathological mechanistic differences between certain populations.
Given the long historical failure of sepsis therapies and the issues with patient variability, the preconception of a “one-size-fits-all” therapy may be inappropriate [41, 45]. Post-hoc analyses of several past human trials suggest several cohorts of sepsis patients may have benefited from the experimental therapies (despite the overall conclusion of no mortality benefit across trial subjects) [18, 46]. A targeted therapeutic approach to sepsis may be a promising outlook for treatment. Targeted therapeutics can be developed by understand-ing and use the disease subtypes to formulate a therapy. This has been shown to be an effective approach in the treatment of asthma. Asthmatic research using disease subtypes to develop targeted therapies have been successful, which lends support to the hypothesis that a singular therapy for sepsis is inappropriate [47, 48]. An “endotype” is a disease sub-type characterized by pathological and mechanistic differences. Sepsis subsub-type identification has immense potential to improve clinical outcomes (such as lowering mortality or lowering
multiple organ failure rates), which is why it is surprising that there is a lack of existing literature on the topic. The existence of subtypes in sepsis has been hypothesized over the years, but few have tried to identify and characterize them [45, 49, 50].
1.3 DECISION SUPPORT SYSTEMS
To address the clinical challenges with sepsis, mathematical model-based decision support may provide the solution. Mathematics and in silico studies in sepsis have offered descrip-tive models that can aid clinicians in understanding the ongoing dynamics of sepsis and ascertain the effects of potential treatments [3, 4, 51–55]. Some of these studies have an-alyzed parameter-based outcome bifurcations, revealing that mechanistic differences in the parameter space may lead to death or survival states [3, 4]. However, few models in exist-ing literature have been calibrated against human sepsis data, limitexist-ing the translatability of its results to the clinic. The goal of this dissertation is to use mathematical models, calibrated on human sepsis data, to produce insights into how and why sepsis endotypes manifest and to provide clinicians with the appropriate quantitative tools to deal with the sepsis heterogeneity.
1.4 DISSERTATION OVERVIEW
The focus of this dissertation is to identify, characterize, and analyze the subtypes of adult sepsis. The underlying hypothesis is that providing clinicians with the ability to classify patients into sepsis subtypes will improve sepsis therapy and improve clinical outcomes. Endotype-driven approaches may address major components of the translational disconnect between animal models and human trials. Identifying sepsis endotypes may capture the root cause of much of the variability associated with the syndrome. Analysis of specific subtypes can identify how mechanistic differences cause the dysregulations in Section 1.1. Knowledge
of such mechanistic differences can enable the discovery of new pharmaceutical targets for therapy or reveal cohorts that benefit from specific treatments.
The secondary focus of this dissertation is the creation of translatable clinical tools to support clinicians in their decision-making process during the treatment of sepsis patients. These tools aim to provide early sepsis subtype classification and enable therapy timing and were designed with (i) low measurement burden (relatively easy to measure biomarkers) and (ii) low temporal burden (short sequential measurements only).
The dissertation is organized as follows. Chapter 2 identifies clusters of sepsis patients with similar clinical features using a statistical approach. Hierarchical clustering revealed that inflammatory mediators predominately drove the formation of the clusters and that they are associated with sepsis-related mortality and organ dysfunction.
Chapter 3 studies how the dynamics of cytokines, the aforementioned inflammatory mediators, reveal distinct patterns. These behaviors were characterized by five distinct groups. This work was extended as a proposed clinical tool, which quickly classified a subject’s endotype within 6 hours of clinical presentation.
Chapter 4 focuses on the importance of cytokines and their dynamical relationship to endotyping in sepsis. Cytokines are responsible for recruiting white blood cells, which ulti-mately carry out the relevant antimicrobial actions during acute inflammation. To analyze the discovered endotypes in the broader context of sepsis, a tissue and blood compartmental mechanistic ordinary differential equation model was developed to capture both white blood cell and cytokine dynamics. This model was used to generate endotype-specific fits, which was used to analyze endotype pathology.
Chapter 5 describes exploratory models that address other aspects of sepsis variability that can improve the translatability of animal research to humans. To address the tight experimental controls with regards to therapy timing and controlled injury levels seen in animal research, machine-learning approaches were taken to identify sepsis time zero in patients and to quantify global tissue damage during sepsis. With the knowledge of disease time zero and systemic damage, a clinician can be provided with a grasp of where a septic patient is located along an endotype’s disease trajectory. This combined knowledge can be
used to finely select suitable patients for clinical trials and may offer improvements to the status quo of care.
Chapter 6 describes several notable mathematical tools developed for this project. A network optimization tool is first introduced as a method to detect inflammatory pathways in data. This tool identifies the best boolean rule network that best describes a dataset to aid in the analysis of immune pathways and model structure design. A parameter fitting toolkit, APT-MCMC, is then introduced as an efficient Monte Carlo method to fit such models. APT-MCMC contains features for advanced fitting scenarios pertaining to mathematical models in medicine, including fitting initial conditions, handling of infusions, and fitting left-censored data.
Chapter 7 provides perspective on the contributions this dissertation makes in the field of sepsis. Short and long-term future improvements are proposed, with the ultimate goal envisioned as a simple to use bedside tool to enable clinicians to personalize treatment for each septic patient under their care.
2.0 HIERARCHICAL CLUSTERING APPROACH TO IDENTIFY SEPSIS ENDOPHENOTYPES
Clinical features of sepsis vary greatly among patients and are dependent on pathogen fac-tors, host facfac-tors, time elapsed between onset of infection and clinical presentation, and interventions [5]. Failure to understand the vital interplay between these factors has con-tributed to many failed sepsis clinical trials in the past few decades, and there is a clinical need to revisit the current approach to sepsis research [8,56, 57]. Sepsis research may ben-efit by borrowing a promising technique from another disease area that may be the key to capturing physiologic variability: the study of disease endotypes.
Asthma research has demonstrated success in applying clinical endotypes for the purposes of clinical diagnosis and classification, predictions, and therapy development [47]. Endotypes are disease subtypes that are caused by pathobiological differences and are often expressed through phenotypic variability [48]. Several severe asthma endotypes and their indicative biomarkers have been identified, enabling the research and development of targeted thera-peutics [48]. For instance, glucocorticoids are the gold standard for asthma treatment, but their efficacy varies, sometimes to the point of no benefit, among asthma endotypes [47]. Furthermore, asthma endotypes are being used to guide clinical study design [47]. Consider-ation of endotypes in sepsis, which dispels the notion of a single therapeutic approach, may lead to better targeted and more effective treatment [45].
The use of endotypes in sepsis may reveal key underlying pathobiological differences between different host responses to sepsis and may address much of the clinical variability observed in septic patients. In the field of asthma, researchers have demonstrated that endo-types can be derived from clusters of phenoendo-types despite differences in clinical presentations and disease severity [47].
Several groups have previously identified sepsis clusters with differing mortality rates [49, 50]. Fjell, et al., used an unsupervised clustering approach to segregate patients using cytokines and other signaling molecules [49]. They identified three groups of varying cy-tokine magnitudes. The highest cycy-tokine group was associated with elevated mortality and morbidity such as renal failure and coagulopathy. Knox, et al., used a self-organizing map approach to identify four clusters with differing clinical outcomes [50]. This approach trained a map of nodes to represent a dimensionally-reduced version of a clinical data set (with vari-ables such as temperature, white blood cell count, etc.). The identified node clusters were re-colored to visually demonstrate differences between clusters in sepsis-related organ failure assessment (SOFA) scores and sepsis severity [58].
The ideal endotype classification system for sepsis would involve a combination of a few highly informative signaling molecules (cytokines) and intuitive clinical biomarkers, such as vital signs, to be practical in a clinical setting. The work presented by Fjell, et al., utilizes only signaling molecules, many of which are rarely collected in an ICU. The work by Knox, et al., takes a dimension reduction approach which renders it difficult to interpret the clinical features of each endophenotype.
The underlying hypothesis for this work was sepsis endotypes were identifiable and sep-arable via clinical and diagnostic biomarkers in a multi-dimensional manner. Because endo-types are generally explained by genetic differences (or some other underlying mechanistic distinction), the stratified groups in this work are better described as endophenotypes. The hierarchical dendrogram clustering and heatmap approach from Fjell, et al. was adapted for use with a rich and longitudinal human sepsis data set. This approach allowed the visualiza-tion of defining features of each endophenotype that would be lost in a dimension-reducvisualiza-tion approach. Finally, an important end goal was to establish endophenotypes with distinct clinical features, including 14-day all-cause mortality and risk of multiple organ failure.
2.1 METHODS
A retrospective analysis of the Protocol-Based Care for Early Septic Shock (ProCESS) trial was conducted [59]. This trial was propelled by the seminal 2001 journal article by Rivers, et al., which demonstrated mortality benefits from early goal-directed therapy (EGDT) in sepsis [60]. EGDT involves monitoring hemodynamics using a central venous catheter and controlling arterial pressures and hematocrit to within pre-set therapeutic zones via fluids and vasopressors [60]. The ProCESS trial encompassed 31 emergency departments in the United states and enrolled 1341 subjects into one of three treatment arms to compare the clinical outcomes of EGDT, protocol-based care (combination of EGDT and standard care), and standard care. The primary clinical outcome was 60-day in-hospital mortality. At the conclusion of the study in 2014, the ProCESS investigators determined that there were no mortality differences among any of the three treatment arms. Furthermore, a retrospective analysis of all EGDT studies (including ProCESS) in 2015 concluded that EGDT had no effect on mortality outcomes in sepsis patients [61].
In light of this result, the ProCESS trial amassed a rich data set from its subjects. Longitudinal and high fidelity clinical data were collected for many of the 1341 subjects. This data was retrospectively analyzed for this chapter. 84 biomarkers were measured temporally. The variance among different biomarkers varied in scale and those with high variance were selected for analysis. Biomarkers were converted to the z-score (zero-mean and one standard deviation). The biomarkers were sorted by the range in z-scores (highest range to lowest range to represent the amount of variance within a biomarker). The top 50% of biomarkers were selected for inclusion in the heatmap analysis.
An availability analysis at baseline, as defined by trial enrollment, was performed on the remaining 42 biomarkers. To improve biomarker availability, missing baseline values were substituted by a measurement within 3 hours of time-zero, when necessary. This yielded a convenience cohort of 493 patients with the following biomarkers fully measured at baseline: glucose, platelet count, systolic and diastolic blood pressure, urine output, temperature, heart rate, Tumor Necrosis Factor-alpha (TNF), Interleukin-10 10), Interleukin-6 (IL-6), lactate, blood urea nitrogen, creatinine, white blood cell count, respiratory rate, and
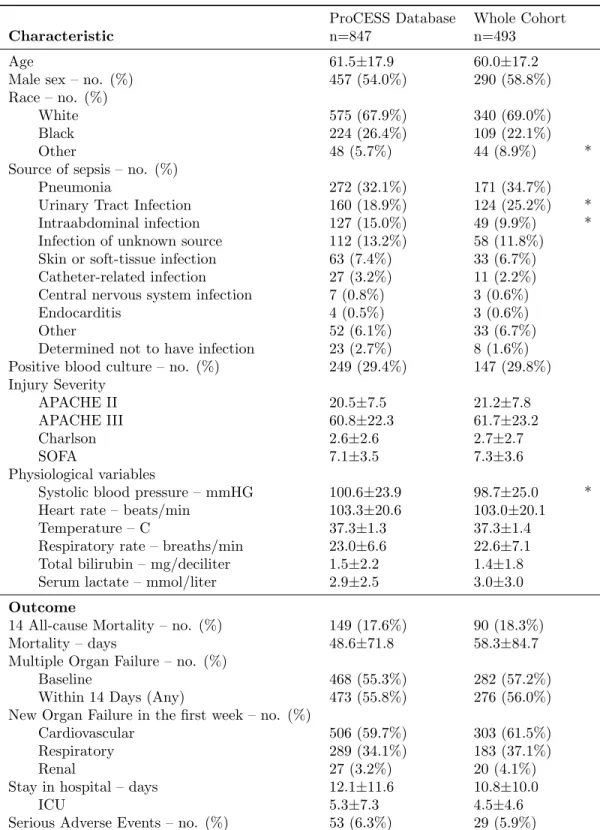
Table 2.1: Comparison of convenience cohort for hierarchical clustering against the rest of ProCESS database.
ProCESS Database Whole Cohort
Characteristic n=847 n=493
Age 61.5±17.9 60.0±17.2
Male sex – no. (%) 457 (54.0%) 290 (58.8%)
Race – no. (%)
White 575 (67.9%) 340 (69.0%)
Black 224 (26.4%) 109 (22.1%)
Other 48 (5.7%) 44 (8.9%) *
Source of sepsis – no. (%)
Pneumonia 272 (32.1%) 171 (34.7%)
Urinary Tract Infection 160 (18.9%) 124 (25.2%) *
Intraabdominal infection 127 (15.0%) 49 (9.9%) *
Infection of unknown source 112 (13.2%) 58 (11.8%) Skin or soft-tissue infection 63 (7.4%) 33 (6.7%)
Catheter-related infection 27 (3.2%) 11 (2.2%)
Central nervous system infection 7 (0.8%) 3 (0.6%)
Endocarditis 4 (0.5%) 3 (0.6%)
Other 52 (6.1%) 33 (6.7%)
Determined not to have infection 23 (2.7%) 8 (1.6%) Positive blood culture – no. (%) 249 (29.4%) 147 (29.8%) Injury Severity APACHE II 20.5±7.5 21.2±7.8 APACHE III 60.8±22.3 61.7±23.2 Charlson 2.6±2.6 2.7±2.7 SOFA 7.1±3.5 7.3±3.6 Physiological variables
Systolic blood pressure – mmHG 100.6±23.9 98.7±25.0 *
Heart rate – beats/min 103.3±20.6 103.0±20.1
Temperature – C 37.3±1.3 37.3±1.4
Respiratory rate – breaths/min 23.0±6.6 22.6±7.1 Total bilirubin – mg/deciliter 1.5±2.2 1.4±1.8
Serum lactate – mmol/liter 2.9±2.5 3.0±3.0
Outcome
14 All-cause Mortality – no. (%) 149 (17.6%) 90 (18.3%)
Mortality – days 48.6±71.8 58.3±84.7
Multiple Organ Failure – no. (%)
Baseline 468 (55.3%) 282 (57.2%)
Within 14 Days (Any) 473 (55.8%) 276 (56.0%)
New Organ Failure in the first week – no. (%)
Cardiovascular 506 (59.7%) 303 (61.5%)
Respiratory 289 (34.1%) 183 (37.1%)
Renal 27 (3.2%) 20 (4.1%)
Stay in hospital – days 12.1±11.6 10.8±10.0
ICU 5.3±7.3 4.5±4.6
Serious Adverse Events – no. (%) 53 (6.3%) 29 (5.9%)
∗denotes p≤0.05 from Dunn’ or Chi-Squared tests to determine differences between continuous or categorical variables, respectively.
potassium. This convenience cohort was compared against the rest of the ProCESS subjects and the statistical results are presented in Table 2.1. Very few cohort characteristics or clinical outcomes were statistically different, indicating that this convenience cohort was representative of the ProCESS patients as a whole.
Missing baseline biomarkers were imputed in order to increase the number of analyz-able biomarkers within the convenience cohort. Biomarkers with less than 5% missing at baseline were included after imputation using the predictive mean matching program from the mice package in R. Imputed biomarkers were sodium, chloride, hemoglobin,
thrombin-antithrombin (TAT) complex, D-Dimer, and calcium. Finally, bilirubin, with 18% missing baseline values, was imputed using a linear model, where other baseline biomarkers served as predictors (see Equation 2.1).
Xbilirubin(0) =β0+
N
X
i=1
βiXi(0) (2.1)
Fitting the β coefficients were performed via the linear regression function from the Scipy package in Python. The result was a complete dataset consisting of 493 subjects and 18 biomarkers at baseline. In order to analyze changes within this cohort over time, 6 and 24-hour post-trial enrollment data were considered as well. Missing measurements at these time points were imputed using a last measured value carried forward approach. Data values for patients that died by 6 or 24 hours were not imputed and were left as black columns within the heatmaps.
The final step of data processing was to normalize the data. The natural log of the data was taken to prevent biomarkers from exhibiting large ranges (such as cytokine mea-surements). An empirical cumulative distribution function (eCDF) was calculated for each biomarker across the entire convenience cohort using measurement values at 0, 6, 24, and 72 hours. Measurements at 72 hours were included to provide more data points for the eCDF but were not used to generate heatmaps due to the excessive amounts of missing measure-ments. Each biomarker was evaluated against their respective eCDF to obtain a normalized value between 0 and 1. This normalized value was linearly transformed to boundaries of [-10, 10]. A value of zero (corresponding to white on a heatmap) represents the population median for a biomarker. An important note is that a value of zero makes no indication
of a “healthy” state. Given the large number of biomarkers included for analysis and the severely ill cohort, no consideration was performed to account for each biomarker’s crite-ria for healthy levels. This normalization scheme step ensured comparability of biomarkers among endophenotypes and time points.
2.1.1 Heatmap
Identifying patterns of distinct septic responses is nontrivial and necessitates unsupervised clustering because there is no currently accepted classification of sepsis in clinical practice. Hierarchical clustering was selected as the clustering algorithm because clusters merges can be visualized intuitively via a dendrogram tree. Hierarchical clustering and subsequent heat map visualization were performed using the heatmap3 package in R. Clustering options
was set to Euclidean distance and to the complete linkage function for bottom-up clustering. Clustering was performed on the baseline dataset with both biomarker and patient clustering enabled. Endophenotype identification was performed by analyzing the resulting heatmap and dendrogram. Biomarker differences in the heatmap, the heights of the patient-level dendrogram tree, and clinical intuition informed the creation of similar groups within the heatmap. Hourly visualizations of patient data at 6 and 24 hours were performed with the heatmap technique and ordered using the hierarchical clustering results of the baseline dataset to preserve the identified endophenotype groups.
Clinical outcomes were defined by 14-day all-cause mortality and 14-day multiple organ failure rates within each endotype. Unlike the clinical outcome in the ProCESS database (60-day in-hospital mortality), 14-day all-cause mortality isolated mortality likely due to the septic shock rather than downstream complications of sepsis, which is consistent with previous literature [62]. Furthermore, sepsis severity definitions were rendered obsolete by the 2016 redefinition of sepsis and multiple organ failure rates served as a proxy for sepsis severity for each endotype [7]. SOFA values were calculated for each of the 493 patients using the appropriate values at baseline and then on days 1 through 14 using daily maximum or minimum values. A distinction was made between baseline MOF and 14-day MOF in order to distinguish patients that were sick upon clinical presentation (with baseline MOF) or
patients who worsened (no baseline MOF, but developed within 14-days). Baseline MOF was defined by baseline SOFA ≥ 2. 14-day MOF was defined by any daily SOFA ≥ 2.
2.1.2 Statistical Analysis
Kruskal-Wallis and Chi-squared tests were performed on continuous and discrete variables, respectively, test for statistically significant differences in variables among each endophe-notype (p< 0.05). Patient characteristics such as infection source, demographics, injury severity, and baseline physiological variables were analyzed. Outcomes such as mortality, multiple organ failure, and hospital length of stay were also evaluated. Significance testing was used to identify comorbidity differences between each endophenotype.
Further statistical testing was performed to test if any generated endophenotype was a time-shift of another (for example, is group A at hour 0 the same as group B at hour 6?). Pair-wise testing was performed between each time point of each endophenotype. The energy-distance test statistic was chosen due to its ability to compare two multivariate dis-tributions and generate a distance between them [63]. This statistic was used to generate a multivariate distribution of clinical biomarkers (generated on raw values prior to log and CDF transformation) for each endophenotype at each time point. Using these distributions, the energy-distance algorithm tested for any statistical differences between each time point of each endotype. The R package energy was used for these computations. To account for
dependency issues arising from multiple comparisons, permutation testing (10,000 replicates for each pair-wise test, significance at p<0.05) was conducted.
2.2 RESULTS
Figure 2.1 shows the results of the clustering algorithm and the groups are visualized via heatmap. White (zero in the normalized scale) represented the population median for a biomarker. Red and blue colors indicate biomarker levels relative to the population; dark red indicated that a patient’s biomarker was elevated with respect to the population
me-Figure 2.1: Heatmap of clustered baseline biomarkers in 493 patients with 6 identified subclusters. Biomarkers are individually normalized to be between -10 and 10, with 0 (white) representing the biomarker median. Dendrograms illustrate the clustering performed on biomarkers (left) and on patients (top). Subgroups were identified by analyzing the patient dendrogram. Group A is characterized by high cytokinemia, high lactate, and elevated mortality and multiple organ failure rates. Group B is characterized by medium cytokinemia and lower lactate. Group C is characterized by elevated blood pressure and low mortality rates. Group D is characterized by low cytokinemia and low mortality rates. Group E is characterized by a low IL-6 response and low values of creatinine and BUN, which is indicative of renal health. Group F is characterized by high IL-10 and TNF responses along with elevated creatinine and BUN, which is indicative of poor renal health. (BUN = blood urea nitrogen, IL-# = Interleukin-#, TNF = Tumor Necrosis Factor-α)
Figure 2.2: Heatmap of 6-hour biomarkers in 493 patients with 6 identified subclusters. Hierarchical clustering was not performed. Cluster ordering and Groups A-F were preserved from Figure 2.1. This heatmap demonstrates the progression of the 493 patients since baseline. Generally, there are improvements in all groups. Patients with elevated cytokinemia begin to taper down (return toward baseline). Blood pressure and urine output generally increased. Those with elevated temperatures at baseline tended to abate by 6 hours.
dian and dark blue indicated reduced levels. The analysis of the dendrogram yielded six endophenotypes, labeled A-F. Figures 2.2 and 2.3 demonstrate patient progression over the next 6 and 24 hours, respectively, with patient ordering preserved (using the ordering
in-Figure 2.3: Heatmap of 24-hour biomarkers in 493 patients with 6 identified subclusters. Hierar-chical clustering was not performed. Cluster ordering and Groups A-F were preserved from Figure 2.1. This heatmap demonstrates the progression of the 493 patients since baseline. There are more white biomarkers in this heatmap than in Figures2.1and2.2, indicating a tendency of biomarkers to move away from their extremes. Abatement of cytokinemia is demonstrated in Group A, but the majority of patient IL-6 and IL-10 levels were still in the red, which portend worse prognoses. Group D continues to have a low cytokine response.
formed from baseline clustering). Table 2.2 shows the patient characteristics and outcome differences between each endophenotype, including significant differences in mortality, organ failure events, and the length of ICU stay.
Table 2.2: Comparison of endophenotypes identified via hierarchical clustering.
Endophenotype
A B C D E F
Characteristic n=158 n=64 n=30 n=46 n=78 n=117 Age 61.2±17.2 58.6±16.4 57.8±18.7 61.5±15.6 58.7±16.1 59.8±18.2 Male sex – no. (%) 100 (63.3%) 32 (50.0%) 15 (50.0%) 24 (52.2%) 48 (61.5%) 71 (60.7%) Race – no. (%)
White 107 (67.7%) 47 (73.4%) 15 (50.0%) 31 (67.4%) 52 (66.7%) 88 (75.2%) Black 38 (24.1%) 9 (14.1%) 13 (43.3%) 10 (21.7%) 21 (26.9%) 18 (15.4%) * Other 13 (8.2%) 8 (12.5%) 2 (6.7%) 5 (10.9%) 5 (6.4%) 11 (9.4%) Source of sepsis – no. (%)
Pneumonia 56 (35.4%) 23 (35.9%) 11 (36.7%) 14 (30.4%) 32 (41.0%) 35 (29.9%) Urinary Tract Infection 42 (26.6%) 17 (26.6%) 6 (20.0%) 11 (23.9%) 14 (17.9%) 34 (29.1%) Intraabdominal infection 15 (9.5%) 8 (12.5%) 1 (3.3%) 4 (8.7%) 12 (15.4%) 9 (7.7%) Infection of unknown source 17 (10.8%) 6 (9.4%) 5 (16.7%) 2 (4.3%) 5 (6.4%) 23 (19.7%) * Skin or soft-tissue infection 8 (5.1%) 3 (4.7%) 2 (6.7%) 5 (10.9%) 11 (14.1%) 4 (3.4%) * Catheter-related infection 5 (3.2%) 1 (1.6%) 0 (0.0%) 2 (4.3%) 0 (0.0%) 3 (2.6%) Central nervous system infection 1 (0.6%) 0 (0.0%) 0 (0.0%) 1 (2.2%) 0 (0.0%) 1 (0.9%) Endocarditis 1 (0.6%) 2 (3.1%) 0 (0.0%) 0 (0.0%) 0 (0.0%) 0 (0.0%) Other 13 (8.2%) 3 (4.7%) 2 (6.7%) 7 (15.2%) 3 (3.8%) 5 (4.3%) Determined not to have infection 0 (0.0%) 1 (1.6%) 3 (10.0%) 0 (0.0%) 1 (1.3%) 3 (2.6%) * Positive blood culture – no. (%) 75 (47.5%) 20 (31.2%) 1 (3.3%) 8 (17.4%) 18 (23.1%) 25 (21.4%) * Injury Severity APACHE II 23.1±8.0 21.6±8.0 20.0±8.6 18.7±6.2 17.9±7.1 21.8±7.3 APACHE III 63.4±23.5 67.8±22.0 57.4±21.8 57.4±19.9 56.1±23.8 62.5±23.1 Charlson 2.9±2.8 3.0±2.7 2.7±2.7 2.4±2.2 2.5±2.3 2.8±2.9 SOFA 8.9±3.7 7.9±3.9 5.5±3.3 5.5±2.8 6.0±2.6 6.8±3.2 * CNS 0.8±1.2 0.8±1.2 1.3±1.4 0.5±1.1 0.7±1.2 0.9±1.3 Cardiac 2.5±1.6 2.6±1.5 0.9±1.4 1.8±1.4 2.1±1.6 1.8±1.5 * Coagulation 1.0±1.2 0.9±1.1 0.1±0.2 0.2±0.7 0.4±0.9 0.2±0.7 * Liver 0.8±1.0 0.8±1.1 0.4±0.8 0.2±0.5 0.5±0.9 0.3±0.7 * Renal 1.7±1.2 1.2±1.3 0.9±1.2 1.4±1.5 0.5±0.7 1.7±1.2 * Respiratory 2.1±1.2 1.6±1.1 1.9±1.0 1.4±1.0 1.7±1.0 1.8±1.1 * Physiological variables
Systolic blood pressure – mmHG 95.6±25.2 90.8±13.0 134.7±28.3 97.1±28.3 97.2±22.1 99.4±21.3 * Heart rate – beats/min 110.2±17.9 93.7±19.7 108.9±18.5 95.5±21.5 102.2±18.1 100.3±20.2 * Temperature – C 37.8±1.4 36.4±1.4 37.4±1.0 36.9±1.1 37.8±1.2 36.7±1.2 * Respiratory rate – breaths/min 24.7±7.9 21.4±5.9 21.2±7.9 18.4±5.3 21.9±4.3 22.7±7.4 * Total bilirubin – mg/deciliter 1.8±2.0 2.5±3.3 0.8±0.3 1.2±1.2 1.0±0.7 1.0±1.1 * Serum lactate – mmol/liter 4.0±3.2 3.8±4.6 2.5±2.2 1.5±1.2 2.3±1.9 2.9±2.6 *
Outcome
14 Day All-cause Mortality – no.(%) 41 (25.9%) 13 (20.3%) 1 (3.3%) 3 (6.5%) 7 (9.0%) 25 (21.4%) * Mortality – days 35.9±67.9 62.4±76.9 78.0±73.1 116.4±103.8 84.8±110.9 56.1±82.8 * Multiple Organ Failure – no. (%)
Baseline 120 (75.9%) 36 (56.2%) 13 (43.3%) 15 (32.6%) 32 (41.0%) 66 (56.4%) * Within 14 Days (Any) 119 (75.3%) 40 (62.5%) 12 (40.0%) 16 (34.8%) 29 (37.2%) 60 (51.3%) * New Organ Failure in the first week – no. (%)
Cardiovascular 118 (74.7%) 43 (67.2%) 9 (30.0%) 23 (50.0%) 42 (53.8%) 68 (58.1%) * Respiratory 77 (48.7%) 23 (35.9%) 12 (40.0%) 9 (19.6%) 14 (17.9%) 48 (41.0%) * Renal 14 (8.9%) 1 (1.6%) 0 (0.0%) 0 (0.0%) 0 (0.0%) 5 (4.3%) * Stay in hospital – days 11.2±11.9 10.4±7.7 11.4±9.4 8.3±4.3 10.3±9.0 11.5±10.5
ICU 5.3±5.4 4.5±3.2 3.8±5.0 2.9±2.8 3.3±3.2 4.9±5.1 * Serious Adverse Events – no. (%) 19 (12.0%) 1 (1.6%) 0 (0.0%) 0 (0.0%) 2 (2.6%) 7 (6.0%)
∗denotes p≤0.05 from Dunn’ or Chi-Squared tests to determine differences between continuous or categorical variables, respectively.
2.2.1 High-Risk Endophenotypes
Endophenotypes A, B, and F were at high risk of cardiovascular, respiratory, and renal failure. 14-day mortality was > 20% and 60-day mortality was > 30%. Together, these endophenotypes represent 339 of 493 patients analyzed. Endophenotype A was highly dis-tinctive due to the presence of elevated cytokines (Interleukin-6, Tumor Necrosis Factor-α, and Interleukin-10) across all patients. D-Dimer, TAT-complex, lactate, and bilirubin were elevated as well, indicating coagulation, tissue perfusion, and hepatic issues. This group had the highest incidence of MOF (both baseline and within 14-days) and 14-day mortality. Table 2.2 shows that this group also had the highest incidence of positive blood cultures, 28 and 60-day mortality, cardiovascular, respiratory, and renal failure, and number of serious adverse events. This endophenotype also had the largest number of early deaths for any endophenotype (out of 158 patients, 2 died within 6 hours and 11 died within 24 hours). Patients with elevated creatinine and blood urea nitrogen (BUN), which is indicative of renal deficiency or failure, were at particularly high risk, with 4 deaths prior to 24 hours. Patients with elevated diastolic and systolic blood pressure at baseline had lower rates of MOF and mortality. Overall, patients in this group demonstrated a severe and sustained systemic inflammatory response to infection. At baseline, a typical patient had high cytokinemia and multiple biomarkers indicating the beginning of multiple organ system failure. This endophenotype was most likely descriptive of early-stage sepsis patients.
Endophenotype F patients demonstrated low baseline cytokinemia, high white blood cell counts, platelet counts, and elevated potassium levels. In addition, TAT complex decreased in most patients within 24 hours. Despite the apparently protective profile of these clin-ical biomarkers, this endophenotype had the second highest levels of MOF and mortality. Defining feature were high levels of creatinine, BUN, and lactate. Temperature, heart rate, hemoglobin, respiratory rate, white blood cell count, platelet count, and potassium tended to drop among patients. Two patients died within 24 hours. Table 2.2 showed that this group had the highest incidence of infection from an unknown source. Furthermore, this group was at high risk of cardiovascular and respiratory failure. Overall, biomarker pro-gressions indicate that this group was most likely succumbing to infection during late-stage
sepsis. A possible mechanism could relate to the emergence of an immunosuppressed profile, as indicated by an elevated IL-10 and decreased IL-6 among most patients. Furthermore, most endophenotypes did not exhibit clear or consistent trends in white blood cell counts (WBC), while group F patients uniformly exhibited elevated levels at baseline that depleted over a 24-hour period.
A portion of Endophenotype B patients presented with baseline cytokinemia, but cy-tokine magnitudes and clinical outcomes were more favorable than that of A or F. Glucose and systolic blood pressure were uniformly decreased in this group. Half of the patients exhibited elevated lactate, creatinine, and BUN (Figure2.1, group B, left, highest branch of the vertical dendrogram), while half did not (Figure 2.1, group B, right, highest branch of the vertical dendrogram). There were no significant biomarker changes over 24 hours except for decreasing IL-6. Table 2.2 showed that this group had the second highest incidences of positive blood culture and second highest 60-day all-cause mortality. Additionally, this group had the highest levels of baseline APACHE III severity of illness score and Charl-son burden of chronic illness score [64, 65]. This suggests that this group of patients may have been enrolled later in the course of illness, possibly after peak cytokine levels had been reached [66]. This endophenotype launched a (relatively) appropriate inflammatory response to infection. However, the late complications of sepsis, rather than the initial insult, were responsible for the high mortality.
2.2.2 Low-Risk Endophenotypes
Endophenotypes C, D, and E demonstrated lower rates of MOF and mortality. These groups were characterized by low to no cytokinemia and low lactate. Furthermore, the 154 patients from these groups presented with low injury severity scores and low SOFA scores.
Endophenotype C contained patients exhibiting elevated baseline heart rates, hemoglobin, platelet count, lactate, and diastolic and systolic blood pressures. This group was not af-flicted with cytokinemia: despite varying levels of TNF and IL-10, IL-6 was uniformly low among this cohort. Except for blood pressure, biomarkers had decreasing trends within 24 hours. While only 1 of 30 patients died within 14-days, Table 1 revealed elevated rates of
res-piratory failure and 60-day mortality. This suggested that deaths within this endophenotype were caused by later complications rather than the initial sepsis insult.
Endophenotype D contained patients with low or nonexistent baseline cytokinemia, low lactate values, and elevated platelet counts. This group had the lowest risk of MOF and 14-day mortality. Table 1 showed that this group had the lowest 60-day mortality as well, indicating fewer late-stage complications.
Endophenotype E contained patients with elevated temperatures, and low creatinine and BUN values. Few patients had baseline cytokinemia. This group had slightly higher rates of MOF and mortality than endophenotypes C and D. One patient died within 6 hours and another died within 24 hours. Over time, IL-6 decreased faster than IL-10. This group appeared to have a normal inflammatory response and baseline biomarkers were not indicative of any organ deficiency.
2.2.3 Similarity between Endophenotype
Figure2.4illustrates the results of the multivariate distance matrix to compare the similarity between each endophenotype and their time points. Many of the 0-vs-6 hour comparisons and the 0-vs-24 hour comparisons yielded significant differences, which further support the notion that the identified endophenotypes were not mere time-shifts of one another. Endophenotype A at 0 and 6 hours were significantly different from most other endophenotypes and time points. Furthermore, none of the pair-wise comparisons yielded low dissimilarity statistics between any test (no dark colors). The darkest region occurs within the 24-vs-24 hour comparisons, indicating that there were some similarities among endophenotypes at 24 hours. This demonstrated that patients that segregate into different baseline endophenotypes may progress to similar clinical states after a period, but their baseline clinical values and time-series progression may still play a larger role in determining outcomes.
Interestingly, endophenotypes A and F had similar 14-day mortalities, demonstrating that distinct baseline profiles and sepsis trajectories may have similar risks of death. The largest notable difference between these endophenotypes was the level of cytokinemia present at baseline. Furthermore, white blood cell counts within endophenotype F were uniformly
Figure 2.4: Multivariate energy-distances between endophenotypes A-F and their time points. The distances are displayed in a heatmap where darker colors represent similar groups and lighter colors represent differing groups. Most group-vs-group comparisons do not reveal any similarities. Some similarities are present between different groups at time 24 hours. Cells with an asterisk indicate that the null hypothesis (of equal multivariate distributions, p <0.05) is rejected.
elevated at baseline and decreased over time, while patients within endophenotype A split (half were elevated and half decreased at baseline) and remained unchanged over time.
2.3 DISCUSSION
Despite improving understanding of sepsis pathology, one of the critical issues afflicting sepsis therapies and research is high inter-patient variability and the need for better patient stratifi-cation. The goal of this study was to explore clinical values to identify the types of subgroups that may exist in clinical sepsis populations. Outside of differing clinical outcomes, there were clear differences between each endotype presented in Figure 2.1. Most notable were the differences in cytokinemia and lactate. However, endotype F demonstrated that even
low baseline cytokinemia may lead to high mortality and MOF and that biomarker progres-sion over time is worthy of additional study. This exploratory work supports the notion of endotype-specific therapies. Heat map clustering of patient cytokines and other laboratory and clinical features is a promising method to group patients into distinct endotypes. Avail-ability of additional domains of data would enhance the richness of their description, offer further segregation of endotypes, and potentially offer insight as to underlying mechanisms. Classification of these endotypes can act as a basis for more precise therapies even at the rather coarse level of the description presented. The high-risk endophenotypes A, B, and F are distinctive enough to warrant specific treatment or therapy options. Immunosuppression drugs would likely be harmful to the slightly immunosuppressed patients in endophenotype F, but could be beneficial for the high cytokinemia patients in endophenotype A. Knowledge of sepsis endotypes has the clear potential to shift the current paradigm of research and trial design towards better outcomes. For example, clinical trials can benefit from better patient characterization at enrollment, to better match intervention and presumed pathophysiology, or later, to interpret subgroup benefit of such interventions.
The identified groups in this work were dubbed endophenotypes due to their discovery using observable clinical biomarkers (phenotypes). However, these biomarkers were hypoth-esized to be clinical manifestations of distinct underlying pathophysiological differences (en-dotypes). Along the spectrum between endotypes and phenotypes, the identified groups fall somewhere in the middle. The visualization of clinical data as heatmaps revealed areas of similarity and dissimilarity between groups, which indicated that clinical biomarkers alone cannot fully explain the endotypes present in sepsis. The ability to discriminate the under-lying endotype from the clinical phenotype with good accuracy is a strength of the current approach. Clinical decisions are based on what clinicians can readily observe and measure, and many of the markers characterizing endotypes, even at the coarse level we present, are not readily available in a timely fashion. This issue will presumably be amplified as endo-type enriching work proceeds. Thus, there is a trade-off between extensive knowledge of endotypes with their implied underlying biology, and the pragmatic decisions clinicians are facing when treating sepsis. Thus, endotype characterization allowing precise therapies to
be applied in a timely fashion is key to the translational relevance of detailed endotyping work.
In previous reports on sepsis clustering, Kellum, et al., studied cytokine (IL-6 and IL-10) longitudinal profiles in the GenIMS cohort of patients admitted with community-acquired pneumonia. These authors identified cytokine-based clusters with different outcomes. Specif-ically, high cytokinemia trajectories in IL-6 and IL-10 corresponded to a higher overall bur-den of inflammation and mortality, which corroborates our findings with endophenotype A. Fjell, et al., analyzes signaling molecules and cytokines using a similar hierarchical clustering method, but their biomarkers were pre-selected and did not include any clinical biomark-ers [49]. Our approach using a non-biased feature selection (based on standard deviations and subject to data availability) demonstrated biomarker progressions over time within each endophenotype. Knox, et al., used similar clinical variables, but underwent a dimension reduction technique, rendering it difficult to interpret the resulting clusters in a clinically meaningful way [50]. The resulting clusters had to be recolored to present one variable at a time, while the approach we took presented all clinical information in a multivariate way.
It has been demonstrated that the baseline time point in human sepsis data may not be meaningful due to the variability associated with each patient’s pre-hospital time, but this time could be recovered using clinical measurements [41]. Thus, the biomarker simi-larity within each endophenotype suggests that the pre-hospital time (or true sepsis time zero) for grouped subjects appears to be close, and patients are at similar points along the endotype-specific sepsis trajectory. A dissimilarity test indicated that each heatmap was not similar enough to be grouped together at any time point or cluster. The implication is that classifying a patient into an endotype may be sufficient to estimate his or her pre-hospital time (true sepsis time zero) and may be a one-step procedure for tailoring a suitable therapy. Comorbidities played an influential role in each endophenotype. High-risk endopheno-types A and F had the highest rates of renal failure as a comorbidity. Diabetes was most prevalent in endophenotype F and lowest in B and E. Endophenotype B had the largest population of AIDS patients (10%), which partially explains why B also had the largest population of immune-compromised patients. Endophenotypes E had the highest incidence of unknown infection source, which may suggest that these patients may not have received
appropriate or timely antibiotic coverage. The lowest 14-day mortality groups, endopheno-type C and D, were predominately characterized by the hypertension comorbidity (70%+ within either cohort). This suggested that hypertension may be somewhat protective during the initial onset of sepsis.
2.3.1 Study Limitations
This work can be improved via validation using a larger dataset. Despite the small co-hort sizes used in this study, the ProCESS database is still one of the largest of its kind. A validation database would enable the exploration of other clinically interesting variables because many had to be eliminated for this work due to low sample sizes or rates within the ProCESS population. Furthermore, there is an element of subjectivity in the current approach. Determining the height to “cut” the dendrogram tree in Figure 1 affected the resulting groups, ranging from 2 groups at the top level to 493 groups at the bottom-most level. While endophenotype A was clearly distinct from the rest (largest height on den-drogram tree), the division of the remaining groups was based on cutting the denden-drogram to yield visually distinctive regions. As a result, segregating the data required a degree of human intervention. Despite the subjectivity, Table 2.2 revealed many differences between the endophenotypes discovered.
2.3.2 Application into Temporal qSOFA Trajectories
The hierarchical clustering approach outlined in Section 2.1 was extended to explore the predictive capability of sequential measurements of the quick Sequential Organ Failure As-sessment (qSOFA) score with respect to mortality. The qSOFA score was recommended by the recent sepsis redefinition (Sepsis-3) as a fast method of assessing a patient with suspected infection without the need of laboratory tests [7]. The qSOFA score consisted of measuring respiratory rate, systolic blood pressure, and the Glasgow Coma Score (GCS). Each clinical feature may contribute 0 or 1 to the overall qSOFA score for a total of 3 points (worst score). The manuscript for this work is pending co-author review (Kievlan, Zhang, et al.,
Evalu-Figure 2.5: Clustered Trajectories of qSOFA scores in patients with suspected infection. Shades of red indicate the severity of qSOFA scores and gray indicates missing measurements. Patients with low baseline qSOFA scores (qSOFA=0,1, survivors) were more likely to remain low over 48 hours than nonsurvivors. Two patients with a baseline qSOFA score of 3 survived.
ation of repeated qSOFA measurements among patients with suspected infection; awaiting submission to American Journal of Respiratory and Critical Care Medicine).