PERFORMANCE EVALUATION OF GAS-FIRED HEATING AND HOT-WATER BOILERS BASED ON PRINCIPAL COMPONENT ANALYSIS
W. Zhoua,b,, W. Liua,b, Y. Wanga,b, X. Lva,b
aChina Quality Supervising and Test Center for Gas Appliances, Tianjin, P.R. China. bUrban Gas & Heat Research Institute, North China Municipal Engineering Design &
Research Institute Co. Ltd, Tianjin, P.R. China.
ABSTRACT
With the increasing attention to environmental protection issues, the booming real estate market, and the gradual advancement of the coal to gas project, the gas-fired heating and hot-water boilers industry has ushered in a rapid growth in China. Hence, this study aims to evaluate the performance of boilers and rank them based on this evaluation indicator, to establish a new method for evaluating the performance of gas-fired combi-boilers. Here, eight variables related to combustion, heat exchange and exhaust flue gas have been selected for analysis whereby the variables are thermal efficiency, exhaust gas temperature, concentration of O2, CO, CO2 and NOx, number of burner blades and number of heat exchanger fins. In addition, 40 gas-fired combi-boilers which were selected randomly were tested according to the GB 25034-2010 standard for Gas-fired heating and hot water combi-boiler, and the test results were analyzed using the principal component analysis method. The analysis results indicated that the first four principal components are sufficient to explain the total variance of 91.653% of the original eight variables, the other factors that are abandoned has a weak effect and can be ignored. Therefore, it can be explained that the principal component extraction is feasible to analyze and evaluate the performance of the combi-boilers with the first four principal components. Based on the ratio of principal component contribution rate to cumulative contribution rate, a comprehensive evaluation model of principal components is obtained: F=0.457F1+0.226F2+0.180F3+0.137F4, the comprehensive evaluation index can be used for quantitative evaluation of the performance of gas-fired combi-boilers, and the principal component analysis can be used as a new method to evaluate the performance of gas-fired heating and hot water combi-boilers.
KEYWORDS: Gas-fired heating; hot water combi-boilers; performance evaluation;
principal component analysis; evaluation model
1.0 INTRODUCTION
With the increasing attention to environmental protection issues, the booming real estate
market, and the gradual advancement of the coal to gas project, the gas-fired heating and hot-water boilers industry has ushered in a rapid growth in China. Statistical data shows that the annual growth of gas-fired heating and hot-water boilers has reached 27% from 2009 to 2016.At present, the determination of whether the combi-boilers is qualified is mainly based on GB 25034-2010 "gas-fired heating and hot water combi-boilers" and GB 20665-2015 "Minimum allowable values of energy efficiency and energy efficiency grades for domestic gas instantaneous water heater and gas fired heating and hot water combi-boilers". However, under the premise of qualification, how to further distinguish the merits of the combi-boilers is worth exploring.
For the combustion and heat exchange of the boiler, Chen, Liang, Zheng, Zhou and Yao (2003) have studied the combustion performance of pulverized coal, a new concept of quasi-constant temperature combustion for pulverized coal has been proposed and the influence of co-firing pulverized coal and biomass gas on the combustion characteristics and combustion products has been explored. Martin and Boateng (2014) investigated the combustion performance of pyrolysis oil/ethanol blends in a residential-scale oil-fired boiler, and analyzed the exhaust gas for O2, CO2, CO, NOx and total hydrocarbon
concentration. Demayo, McDonnell and Samuelsen (2002) designed an active combustion control system to maximize the performance of natural-gas-fired industrial boiler burners, in which a feedback sensor array and a dual time-scale controller is designed, and a global performance peak that simultaneously minimizes emissions and maximizes system efficiency has been located by the controller.
Principal component analysis is a general name for a mathematical multivariate method which transforms a great number of related variables to a smaller set of unrelated variables called principal components. According to Abdi and Williams (2010), it is said that principal component analysis is the most popular multivariate statistical technology and has been applied to almost all scientific fields. principal component analysis is used to analyze observation data tables that containing multiple variables, which are usually interrelated.The purpose of principal component analysis is to find useful information in the data table and express it as a new set of variables that are linear combinations of previous variables and are called principal components. Observations (points of data) can be projected onto these new components when they have been constructed (Rose, 2013; Jolliffe, 1986, 2011; Wold, Esbensen & Geladi,1987).
Kouadri, Zelmat and Albarbar (2008) used the linear regression partial least square method to predict the output variables of the RA1G boiler while Arachchige, Nair, Mohsin, Halstensen and Melaaen (2013) analyzed multivariate data for identification of important parameters on re-boiler duty in a post combustion chemical absorption process by using principal component analysis, and partial least squares regression models. Metal insulator silicon carbide field-effect transistor sensors, metal-oxide sensors, and a linear Lambda sensor in an electronic nose was used to measure on-line in hot flue gases from a boiler, principal component analysis was used as the data evaluation method and different operating modes for the boiler have been identified in the data set (Uneus, et al.,
2005). Principal component analysis was used to find the best calibration settings for simultaneous spectroscopic determination of several gasoline properties and has been successfully applied in the process monitoring system for power plant boilers (Honorato, Neto & Pimentel 2008). Tian, Liu and Niu (2009) studied the problem on how to select sample data in principal component analysis model building and found that stronger fluctuant sample data should be selected to build better principal component analysis model. The performance and emissions of a municipal solid waste fueled industrial boiler by performing a system identification analysis has been investigated by using principle component analysis and partial least squares regression modeling (Hassling & Flink 2017). An efficient NOx emission model has been established based on the principle component analysis and support vector regression and has been compared with a traditional artificial neural network and support vector regression, the result indicated that the predictive accuracy of the principle component analysis and support vector regression model is considerably greater than that of the artificial neural network and support vector regression models (Tan, Zhang, Xia, Fang & Chen, 2016). Dunia, Qin, Edgar and Mcavoy (2010) presented the use of principal component analysis for sensor fault identification via reconstruction, and the principal component model has captured measurement correlations and reconstructs each variable by using iterative substitution and optimization, and the transient behavior of number of sensor faults in various types of residuals is analyzed. Principal component analysis has been applied to tube temperature data for plugging detection and identification, contribution analysis and the characteristics of plugged tube temperatures were employed to identify plugged tubes, the experiment results showed that the proposed method can successfully detect and identify plugged tubes (Yu, Yoo, Jang, Park & Kim, 2017).
Therefore, in this study, the performance of gas-fired heating and hot water combi-boilers is analyzed with the principal component analysis method, in which an evaluation model and a comprehensive evaluation indicator is established. The aim here is to evaluate the performance of boilers and rank them based on this evaluation indicator, to establish a new method for evaluating the performance of gas-fired combi-boilers.
2.0 TEST AND METHOD
2.1 Test sample
A total of 40 gas-fired heating and hot water combi-boilers were used in this test, and the combi-boilers used were selected with different brands and heat input randomly.
2.2 Test method
The operation of the gas-fired boiler is that the gas is injected through the burner nozzle and ignited by the pulsed arc, a large amount of heat can be released during the combustion process, and the water flowing through the heat exchanger will be heated by
absorbing the heat that released from the combustion, so that the cold water can be heated to hot water for the users to use, finally the combustion products are discharged through the exhaust pipe. It can be known that combustion, heat exchange and exhaust flue gas are the most important three stages of performance evaluation of combi-boilers, the quality of combustion mainly depends on the appropriate ratio of air to gas, and the heat exchange is mainly reflected by thermal efficiency, the exhaust flue gas also reflects the quality of combustion and heat exchange and mainly reflected in the concentration of combustion products and the exhaust gas temperature. Therefore, the performance evaluation of the combi-boilers can be performed with thermal efficiency, combustion products, exhaust gas temperature, the number of burner blades and the number of heat exchanger fins.
1) Thermal efficiency test
The boiler is installed on the insulated test rig, and the measurement of the efficiency may begin once the boiler, with the control thermostat put out of action, is at thermal equilibrium and the return and flow temperatures are constant. The hot water is passed into a vessel placed on scales (suitably tared before the test) and at the same time measurement of the gas rate (reading the meter) is started. Reading of the water return and flow temperatures are taken periodically so as to obtain a sufficiency accurate average. Mass m1 of water is collected during the 10 min of the test. A further 10 min wait is
required in order to evaluate the evaporation corresponding to the test period. Mass m2 is
obtained. m1 - m2 = m3, the quantity of which note has to be taken in order to increase mt
by the value corresponding to the evaporation, whence the corrected water mass m = m1
+ m3. The quantity of heat transferred by the boiler to the water collected in the vessel is
proportional to the corrected mass m and to the difference between temperature t1 at the
cold water inlet and t2 at the boiler outlet. The useful thermal efficiency is determined by
using an expression given in Equation (1):
2 1 p 3 r (10) 4.186 ( ) 100 10 u i m t t D V H = − + (1) Where
ηu is the useful thermal efficiency in percent;
m is the corrected quantity of water expressed in kg;
t1 is the temperature at the cold water inlet at 60±1 in ℃;
Vr(10) is the gas consumption in m3 measured during the test corrected to 15℃, 1013.25
mbar;
Hi is the net calorific value of the gas used, in megajoule per cubic meter (MJ/m3) at 15℃,
1013.25 mbar, dry gas;
Dp is the heat loss from the test rig corresponding to the mean water flow temperature,
expressed in kilojoules (kJ), taking into account the heat loss from the circulation pump.
2) Sampling of combustion products
The sample of the combustion products is taken in the plane perpendicular to the direction of flow of the combustion products, and a distance L from the extreme end of the combustion products duct is equal to the internal diameter of the combustion products evacuation duct, the distance is generally 60mm.
3) The number of burner blades and the number of fins of the heat exchanger are determined with manual enumeration as the combustion chamber is opened.
3.0 PRINCIPAL COMPONENT ANALYSIS AND EVALUATION MODEL
3.1 Mathematical model of principal component analysis
As there are n samples and each sample contain p variables that can be expressed as x1, x2, …, xp, an n×p order data matrix is formed, as given in Equation (2), as follow:
11 1 1 p ij n p n np x x x x x = = [ ] X (2)
Principal component analysis is the process of construction of one or more new variables that can contain the raw variable information to the greatest extent possible. The new variable is a linear combination of the original variables and the variables are not related to each other.Assuming x1, x2, …, xp are the original variables, F1, F2, …, Fm (m≤p) are
comprehensive new variables, so a linear combination of new variables and original variables is conducted, and the formulas are given in Equation (3) as follow:
1 11 1 21 2 1 2 12 1 22 2 2 1 1 2 2 p p p p m m m pm p F a x a x a x F a x a x a x F a x a x a x = + + + = + + + = + + + (3) Where
Fi and Fj (i≠j, i,j=1,2,3,…,m) are independent of each other;
F1 is the variable which has the largest variance in all linear combinations of x1, x2, …, xp;
F2 is the variable which has the largest variance in all linear combinations of x1, x2, …, xp
that is uncorrelated to F1;
Fp is the variable which has the largest variance in all linear combinations of x1, x2, …, xp
that is uncorrelated to F1, F2, …, Fm (m≤p);
The comprehensive new variables F1, F2, …, Fm determined according to the above
analysis are sequentially the first, second, ..., mth principal components of the original variables x1, x2, …, xp.
3.2 Principal component analysis method
3.2.1 Data standardization
To eliminate the effects of different magnitudes and dimensions, the raw data is first normalized so that the average and the variance of each variable is 0 and 1. Data standardization can be processed according to Equations (4) to (6) as follow:
ij j ij j x x Z s − = i=1, 2, …, n; j=1, 2, …, p (4) Where 1 n ij i j x x n = =
(5)(
)
2 1 1 n ij j i j x x s n = − = −
(6)3.2.2 Correlation coefficient matrix calculation
The standardized data is obtained with the raw data normalized, and then the correlation coefficient matrix R= rij is calculated. The correlation coefficient matrix can be expressed as in Equation (7): 11 1 1 p ij n p n np r r r r r = = [ ] R (7) Where
rij is the correlation coefficient between the original variable xi and the original variable xj, and can be calculated by using Equation (8):
(
)
(
)
(
)
(
)
1 2 2 1 1 n ki i kj j k ij n n ki i kj j k k x x x x r x x x x = = = − − = − −
(8)3.2.3 Eigenvalue and eigenvector calculation of matrix R
Let 1 − =0 R I 2 − =0 R I …… (9) p − =0 R I
Equation (9) is solved and p non-negative eigenvalues 1, 2, ,Pare obtained.In fact,
1, 2, , P
and the greater the variance, the greater the contribution to the principal component.
3.2.4 Principal component determination
The variance contribution rate of the principal component Fi is given by Equation (10) as
follows: 1 ( 1, 2, , ) i i p k k e i p = = =
(10) Then the cumulative contribution rate of the principal components F1, F2, …, Fm can becalculated with the formula given in Equation (11):
1 1 1 ( 1, 2, , ) k k k i i p i k i e i p = = = =
=
(11) The principal components are arranged according to the size of the eigenvalues, and m (m<p) principal components are generally taken in practical applications, and ensure that the cumulative contribution rate is 85% or more, the expression in Equation (11) is considered as follows: 1 1 1 k k k i i p i k i e = = = =
≥85% (11) 3.3 Evaluation modelBased on the analysis, the variance contribution coefficients of different eigenvalues are taking as weighting coefficients, and the scores of each sample are calculated by the comprehensive evaluation Equations (12) and (13), and then the combustion performance of each gas-fired heating and hot water combi-boilers is evaluated, as follow:-
1 1+ 2 2+ + k k
1 i i k i i = =
i=1,2,…,k; (13)4.0 RESULTS AND ANALYSIS
The selected 40 samples were tested according to the test method in Section 2.2 and the test results of nominal heat input, measured heat input, thermal efficiency, exhaust gas temperature, combustion products, number of burner blade and number of heat exchanger fin of each sample were recorded.
According to the sample information and test results, the principal component analysis matrix is established using an expression shown in Equation (14) as follow:
1 2 8
= x x, , ,x
X (14)
Where: x1 is the thermal efficiency, x2 is the exhaust gas temperature, x3 is the O2
concentration, x4 is the CO concentration, x5 is the CO2 concentration, x6 is the NOx
concentration, x7 is the number of burner blades, x8 is the number of heat exchanger fins.
4.1 Correlation analysis
The matrix has been normalized using Equations (2) to (5) and a standardized matrix is obtained, and the correlation between variables is analyzed with the data processing and analysis software SPSS (Zhang 2009; SPSS 2011).The correlation coefficient is shown in Table 1.
Table 1. Correlation matrix
Variables x1 x2 x3 x4 x5 x6 x7 x8 x1 1.000 -0.579 -0.612 -0.082 0.618 0.276 0.331 0.272 x2 -0.579 1.000 0.113 -0.072 -0.129 0.042 -0.079 -0.148 x3 -0.612 0.113 1.000 -0.145 -0.979 -.562 -0.337 -0.305 x4 -0.082 -0.072 -0.145 1.000 0.128 0.327 0.097 0.172 x5 0.618 -0.129 -0.979 0.128 1.000 0.573 0.311 0.277 x6 0.276 0.042 -0.562 0.327 0.573 1.000 -0.002 0.018 x7 0.331 -0.079 -0.337 0.097 0.311 -0.002 1.000 0.933 x8 0.272 -0.148 -0.305 0.172 0.277 0.018 0.933 1.000
According to the criterion of correlation, the closer the absolute value of the correlation coefficient is to 1, the stronger the correlation. It can be seen from Table 1 that there is a medium correlation between thermal efficiency and exhaust temperature, O2 and CO2,
and the correlation coefficients are -0.579, -0.612 and 0.618, respectively. The correlations between O2 and CO2 is more significant, and the correlation coefficients is
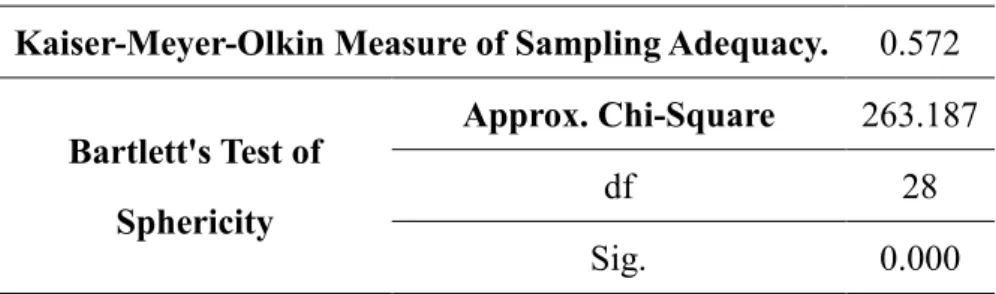
-0.979, as well the number of burner blade and number of heat exchanger fin, the correlation coefficients is 0.933. It can be known that there is a certain correlation between the eight independent variables, and some of the correlations are high. Therefore, it is reasonable to extract the principal component common factor for principal component analysis from the eight independent variables. Table 2 is KMO and Bartlett's Test, the KMO measure of sampling adequacy is to compare the correlation coefficient and the partial correlation coefficient of the tested variables to test whether the independent variables are suitable for factor analysis.According to the KMO metric given by Kaiser, the factor analysis can be performed if the KMO value is above 0.5, and the output of this analysis is 0.572, so the selected variable is suitable for factor analysis.The Bartlett's test of sphericity has completed the independence test between the variables by converting to the χ2 test. According to the analysis output, Bartlett's sphericity test statistic is 263.187,
and the Sig. is 0.00, which is significantly less than the significance level of 0.005, so the null hypothesis of the Bartlett’s sphericity test is rejected, indicating that the correlation coefficient matrix is significantly different from the identity matrix, and the selected variable can be performed with factor analysis.
Table 3 is the commonalities between the principal component factor and each independent variable.The table shows that the eigenvalues of the independent variables have been extracted with the principal component analysis method, and the normalized variables have a variance of 1. The number of principal component factors must be less than the original variables with the commonality of the variables is obtained by factor analysis, so the commonalities must be less than 1. From extraction it can be seen that the principal component factors have a generalization degree of 0.75 or more for each variable, indicating that each of the original variables can be well summarized by the principal component factor.
Table 2. KMO and Bartlett's Test
Kaiser-Meyer-Olkin Measure of Sampling Adequacy. 0.572
Bartlett's Test of Sphericity
Approx. Chi-Square 263.187
df 28
Table 3. Communalities
Variables Initial Extraction
x1 1.000 0.881 x2 1.000 0.949 x3 1.000 0.932 x4 1.000 0.947 x5 1.000 0.936 x6 1.000 0.762 x7 1.000 0.967 x8 1.000 0.958
4.2 Principal component determination
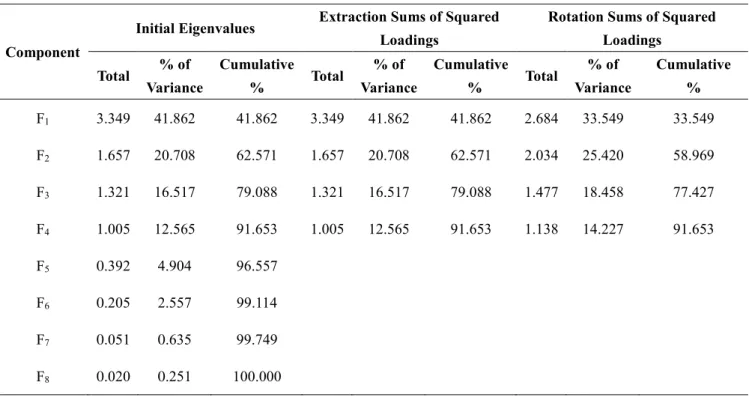
The eigenvalues and cumulative contribution of the matrix X are obtained, as shown in Table 4. Similarly, the results of principal component extraction are also shown in the table, and the importance of the principal component is arranged from top to bottom from large to small.
Table 4. Total Variance Explained
Component
Initial Eigenvalues Extraction Sums of Squared
Loadings
Rotation Sums of Squared Loadings Total % of Variance Cumulative % Total % of Variance Cumulative % Total % of Variance Cumulative % F1 3.349 41.862 41.862 3.349 41.862 41.862 2.684 33.549 33.549 F2 1.657 20.708 62.571 1.657 20.708 62.571 2.034 25.420 58.969 F3 1.321 16.517 79.088 1.321 16.517 79.088 1.477 18.458 77.427 F4 1.005 12.565 91.653 1.005 12.565 91.653 1.138 14.227 91.653 F5 0.392 4.904 96.557 F6 0.205 2.557 99.114 F7 0.051 0.635 99.749 F8 0.020 0.251 100.000
According to the principle of selection of principal components, the eigenvalues of the first four components are all greater than 1, λ1=3.349, λ2=1.657, λ3=1.321, λ4=1.005,
respectively. From Table 4, it is apparent that the cumulative contribution of the first four components exceeds 90%, that is, the first four principal components are sufficient to
explain the total variance of 91.653% of the original variables. The other factors that are abandoned provided the total variance of the original variables less than 10%, which has a weak effect and can be ignored. Therefore, it can be explained that the principal component extraction is ideal, and it is feasible to analyze and evaluate the combustion performance of the gas heating furnace with the first four principal components.As can be seen from the table that the eigenvalues and contribution of the principal component after rotation have changed, but the cumulative contribution has not changed, so the commonality of the original variables is not affected.
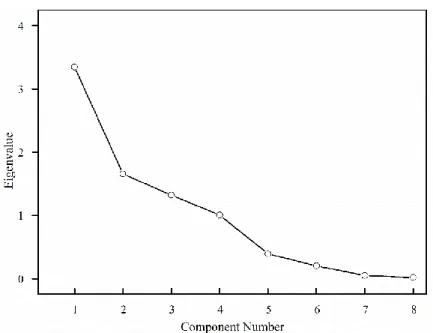
Figure 1 is the scree plot of main component factor. The abscissa is the number of components, and the ordinate is the eigenvalue of the component. The figure shows that the amplitude of variation of eigenvalues varies greatly in the first 4 ~ 5 component factors and tends to be stable after fifth factor, which indicates that it is reasonable to extract four common factors as the main components, which can summarize most of the information.
Figure1. Scree plot of component factor
4.3 Factor loading analysis
The statistical significance of the factor loading is the correlation coefficient between the ith variable and the jth principal component, that is, the weight (specific gravity) of x(i)
depending on F(j), and the loading of the ith variable on the jth principal component, which
reflects the relative importance of the ith variable on the jth principal component. The
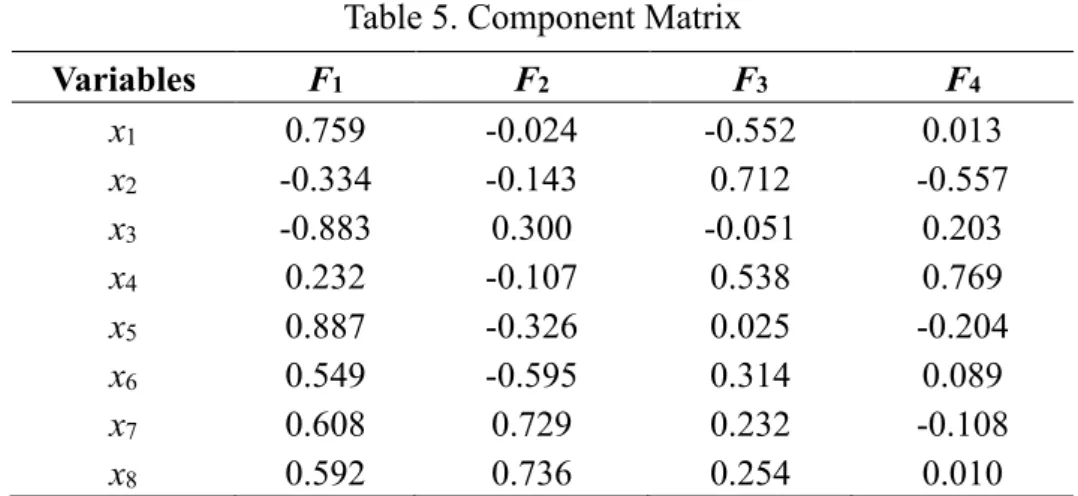
Table 5. Component Matrix Variables F1 F2 F3 F4 x1 0.759 -0.024 -0.552 0.013 x2 -0.334 -0.143 0.712 -0.557 x3 -0.883 0.300 -0.051 0.203 x4 0.232 -0.107 0.538 0.769 x5 0.887 -0.326 0.025 -0.204 x6 0.549 -0.595 0.314 0.089 x7 0.608 0.729 0.232 -0.108 x8 0.592 0.736 0.254 0.010
It can be seen from Tables 4 and 5 that the variables thermal efficiency, O2 concentration
and CO2 concentration have a greater loading on the first principal component F1, and the
corresponding loading are 0.759, -0.883 and 0.887, respectively, and the contribution of the first principal component to the comprehensive evaluation index is reached 41.862%. The variables that have a largest loading to the second principal component F2 are the
number of burner blades and the number of heat exchanger fins, the corresponding loading are 0.729 and 0.736, respectively, and the contribution to the comprehensive evaluation index is close to 20%; For the third principal component F3, the exhaust gas
temperature has the biggest loading 0.712, and the contribution evaluation rate is about 17%; The CO concentration has the most contribution on the third principal component F4, the loading is 0.769 and the contribution is 12.6%. Comparing the loading and
contribution of different variables in each principal component, it is known that the most important variables that evaluating the performance of the gas-fired heating and hot water combi-boilers are thermal efficiency and CO2 concentration in the exhaust gas.
With principal component analysis, the component plot has been obtained according to the loading of different variables in each principal component, and the importance of each variable in the principal component can be visually seen from the plotinFigure 2.
Figure 2. Component Plot
4.4 Evaluation model
Based on the component matrix in Table 5, the main model of principal component analysis can be obtained. The equation of the principal component model can be achieved with the loading matrix data is divided by the square root of the four principal component eigenvalues obtained in Table 4.
1 1 2 3 4 5 6 7 8 2 1 2 3 4 5 6 7 8 3 1 2 3 4 5 6 7 8 0.415 0.182 0.483 0.127 0.485 0.332 0.324 0.300 0.019 0.111 0.233 0.083 0.253 0.566 0.572 0.462 0.480 0.620 0.044 0.468 0.022 0.202 0.221 0.273 F X X X X X X X X F X X X X X X X X F X X X X X X X X = − − + + + + + = − − + − − + + − = − + − + + + + + 4 0.013 1 0.556 2 0.203 3 0.767 4 0.204 5 0.108 6 0.009 7 0.089 8 F = X − X + X + X − X − X + X + X
According to Equations (12) and (13), the ratio of the contribution corresponding to the principal component to the cumulative contribution of the principal component is used as the weight for the calculation of comprehensive evaluation model of principal component can be expressed as in Equation (14) as follows:
1 2 3 4 3.349 +1.657 +1.321 +1.005 3.349+1.657+1.321+1.005 F F F F F= =0.457F1+0.226F2+0.180F3+0.137F4 (14)
Based on the comprehensive evaluation model, the scores of the performance of each gas-fired heating and hot water combi-boilers were calculated, and the performance was evaluated.
5.0 CONCLUSION
To evaluate the combustion performance of gas-fired heating and hot water combi-boilers, a test with 40 combi-boilers has been carried out, and the test data of combustion, heat exchange and exhaust flue gas have been analyzed with the principal component analysis method. The following conclusions can be drawn:
1) The cumulative contribution of the first 4 principal components obtained by the principal component analysis method is 91.653%, which can basically represent the vast majority of the information of the eight original variables. The results show that the analysis and evaluation of the combustion performance of the gas-fired combi-boilers with the first 4 principal components is feasible.
2) Comparing the loading and contribution rate of different variables in each principal component, it is known that the most important indexes that evaluating the combustion performance of the gas-fired heating and hot water combi-boilers are thermal efficiency and CO2 concentration in the exhaust gas.
3) According to the ratio of principal component contribution rate to principal component cumulative contribution rate, a comprehensive evaluation model of principal components is obtained: F=0.457F1+0.226F2+0.180F3+0.137F4.
The comprehensive evaluation index obtained by principal component analysis can be used for quantitative evaluation of the combustion performance of gas-fired combi-boilers. Therefore, the principal component analysis can be used as a new method to evaluate the combustion performance of gas-fired heating and hot water combi-boilers.
ACKNOWLEDGEMENT
This research is funded by the Tianjin Science and Technology Project under grant number 16YFZCGX00230.
REFERENCES
Abdi, H., Williams, L.J. (2010). Principal component analysis. Wiley Interdisciplinary Reviews Computational Statistics, 2 (4): 433-459.
Arachchige, USPR., Nair, J.U., Mohsin, M., Halstensen, M., Melaaen, M.C. (2013). Multivariate data analysis for identification of important parameters on re-boiler duty in a post combustion chemical absorption process. European Journal of Scientific Research, 95 (2): 289-302.
Chen, D., Liang, L., Zheng, C., Zhou, H., Yao, B. (2003). Quasi-constant temperature combustion for improving the overall performance of a coal-fired boiler. Combustion and Flame, 134(1): 81-92.
Demayo, T.N., Mcdonell, V.G., Samuelsen, G.S. (2002). Robust active control of combustion stability and emissions performance in a fuel-staged natural-gas-fired industrial burner. Proceedings of the Combustion Institute, 29 (1): 131-138.
Dunia, R., Qin, S.J., Edgar, T.F., Mcavoy, T.J. (2010). Identification of faulty sensors using principal component analysis. Aiche Journal, 42 (10): 2797-2812.
Hassling, A., Flink, S. (2017). System identification of a waste-fired CFB boiler: using principal component analysis (PCA) and partial least squares regression modeling (PLS-R). Mälardalen University.
Honorato, F.A., Neto, B.B., Pimentel, M.F. (2008). Using principal component analysis to find the best calibration settings for simultaneous spectroscopic determination of several gasoline properties. Fuel, 87 (17): 3706-3709.
Jolliffe, I, T. (1986). Principal component analysis. Springer, 14 (27): 231-246.
Jolliffe, I.T. (2011). Principal component analysis. Journal of Marketing Research, 87 (100): 513.
Kouadri, A., Zelmat, M., Albarbar, A. (2008). Prediction of boiler output variables through the PLS linear regression technique. International Arab Journal of Information Technology, 8(3): 260-264.
Martin, J.A, Boateng, AA. (2014). Combustion performance of pyrolysis oil/ethanol blends in a residential-scale oil-fired boiler. Fuel, 133(133): 34-44.
Rose, W. (2013). Principal component analysis. Georgia Institute of Technology, 87 (4): 218–225.
SPSS. (2011). IBM SPSS statistics for Windows, version 20.0. New York: IBM Corp.
Tan, P., Zhang, C., Xia, J., Fang, Q., Chen, G. (2016). NOx Emission Model for Coal-Fired Boilers Using Principle Component Analysis and Support Vector Regression.Journal of Chemical Engineering of Japan, 49 (2): 211-216.
Tian, Q., Liu, J.Z., Niu, Y.G. (2009). Data selection in principal component analysis for power plant boiler modeling. Proceedings of the CSEE, 29(8): 87-91.
Uneus, L., Artursson, T., Mattsson, M., Ljung, P., Wigren, R., Märtensson, P., Holmberg, M., Lundström, I., Spetz, A.L. (2005). Evaluation of on-line flue gas measurements by MISiCFET and metal-oxide sensors in boilers. IEEE Sensors Journal, 5(1): 75-81.
Wold, S., Esbensen, K., Geladi, P. (1987). Principal component analysis. Chemometrics & Intelligent Laboratory Systems, 2 (1): 37-52.
Yu, J., Yoo, J., Jang, J., Park, J.H., Kim, S. (2017). A Novel Plugged Tube Detection and Identification Approach for Final Super Heater in Thermal Power Plant Using Principal Component Analysis. Energy, 126: 404-418.