Procedia - Social and Behavioral Sciences 116 ( 2014 ) 1491 – 1496
1877-0428 © 2013 The Authors. Published by Elsevier Ltd. OpenaccessunderCCBY-NC-NDlicense. Selection and/or peer-review under responsibility of Academic World Education and Research Center. doi: 10.1016/j.sbspro.2014.01.422
ScienceDirect
5
thWorld Conference Educational Sciences -WCES 2013
Development of Value-Added Measure of Learning Achievement
for High School Students.
Jatuphum Ketchatturat
a*, Samphan Phanpruek
baKhon Kaen University, Khon Kaen 40002, Thailand
bThe National Institute of Educational Testing Service, Bangkok, 10400, Thailand
Abstract
The objectives of this research were to develop the method of value-added measure of learning achievement for high school students and to categorize the school groups by using the value-added score. The samples were 84 secondary schools in Khon Kaen province under the office of Secondary Educational Service Area. The student data consisted of Grade Point Average (GPAX), Ordinary National Education Tests (ONET) in five subjects including Thai language, Social Study, English language, Mathematics, and Sciences were used in academic year 2010 – 2011. The instrument of research consisted of data record form, survey form. The data were analyzed by descriptive statistics, equating method, regression analysis, value-added analysis, Pearson product correlation coefficient, confirmatory factor analysis. The research results as follow 1) Value added score is obtained as follow steps; (1) equate with the linear equating method the grade point average (GPAX) by O-NET scores of high school students (2) regress mean equated GPAX scores of students from year 2010 on mean equated GPAX scores of students from year 2011 (3) calculate the difference of the actual mean equated GPAX score and the “expected” mean equated GPAX from the regression. 2) The measurement model of value-added of learning achievement for high school students consisted 5 factors which fitted the empirical data (Chi-Square = 2.30, df = 5, p-value = 0.8058, RMSEA = 0.0000, RMR = 0.0002). School group categorized by using the percentile of value-added score classified 7 groups including, very poor (pr<10) poor (10≤pr<25) fair (25≤pr<50) very fair (50≤pr<75) good (75≤pr<90) very good (90≤pr<95) and excellent (pr≥95). The implementing of the value-added of learning achievement into practice were (1) to improve the quality of teaching and learning each subjects and (2) to evaluate the quality of schools. This method provided a clearer indication of the contribution a school makes to the progress of its students.
© 2013 The Authors.Published by Elsevier Ltd. All rights reserved.
Selection and peer review under the responsibility of Prof. Dr. Servet Bayram Keywords: Value-Added Measure, Learning Achievement, Linear Equating Method, High School Student
1.Introduction
Learning Achievementis the particular knowledge, skill or behaviour that a student is expected to exhibit after a period of study. Learning outcomes reflect a nation’s concern with the level of knowledge acquisition among its student population. Measuring learning outcomes provides information on what particular knowledge, skill or behaviour students have gained after instruction is completed. They are typically measured by administering assessments at sub-national, national, regional and international levels (World Bank, 2012)
Otherwise, on issue of learning achievement are different in each school cause different of test construction and grading problem. When we used Grade Point Average (GPAX) as learning achievement indicating the quality of schools and students, it would be an unfair to comparison. The office of Basic Education Commission in Thailand recognizes the necessity and importance of this issue, therefore they proposed the pilot research that conducted by Kanjanawasee, S. and et al (2009) developed the method of equating grade point average based learning outcome * Corresponding Author name: Jatuphum Ketchatturat Tel.: +6-689-478-6077
E-mail address: [email protected]
© 2013 The Authors. Published by Elsevier Ltd. OpenaccessunderCCBY-NC-NDlicense.
group by test score from O-NET of high school students. In order to the GPAX of students from different schools can be compared to an equal. This method of calibration is the process used to determine the relationship between test scores from different tests to measure the same attributes and test different times to score from one test to scale of the another test. The research concluded that comparison of methods of equating grade point average of four methods to include a regression analysis, linear method, Equipercentile method, and multilevel analysis. The linear method and Equipercentile method yield similar and consistent with the empirical data more than regression analysis and multi-level analysis. The research suggested that should lead the way to calibrate the linear method is used because the results are consistent with the empirical data and uncomplicated, operational convenience.
For reasons mentioned above, this study’s objectives are to provide school with information about (1) how much improvement their student’s essential skill have made year by year, and (2) whether that improvement is more or less than would be expected given the progress made by students at other schools.
Ultimately, information on value-added from learning outcomes assists countries in making informed decisions about interventions to improve educational quality and help policy makers monitor trends in the nature and quality of student learning over time. National, regional and international assessments allow for the benchmarking of student performance against corresponding standards. In the context of international development assistance, focus on learning outcomes increases stakeholder attention on deliverables and results, and may increase accountability based on performance.
2.The objective of research
1) To develop the method of Value-Added Measure of Learning Achievement for High School Students. 2) To categorize the school groups by using the value-added score.
3.Methodology
3.1 Population and Samples
The samples of this research include the secondary school in Khon Kaen province, Thailand under the office of Secondary Educational Service Area 25. The student data consisted of Grade Point Average (GPAX), Ordinary National Education Tests (ONET) in five subjects including Thai language, Social Study, English language, Mathematics, and Sciences were used in academic year 2010 – 2011.
3.2 Research Instrument
The student data was collected in database of the office of Secondary Educational Service Area 25. The researcher collected these data by record form and used survey form for school within this area. Three months for categorizing the data and prepare the data for analysis.
3.3 Statistics
The data were analyzed by descriptive statistics, linear equating method (Kolen, Michael J. and Brennan, Robert L., 1995), regression analysis, value-added analysis, Pearson product correlation coefficient, confirmatory factor analysis.
Value added score of school is obtained from the analysis steps as follow;
(1) equated with the linear equating method of the grade point average (GPAX) by O-NET scores of high school students as formula (Kanjanawasee and et al, 2009)
)
(
)
(
stj ONET GPAX ONET GPAX stjONET
SD
SD
ONET
SD
SD
GPAX
EQGPAX
=
−
+
Where EQGPAX is the equated the grade point average SD is standard deviation
(2) regress mean equated GPAX scores of students from year 2010 on mean equated GPAX scores of students from year 2011
(3) calculate the difference of the actual mean equated GPAX score and the “expected” mean equated GPAX from the regression. [The expected value is usually referred to as the “predicted” of “fitted” value from the regression line (Fitz-Gibbon, 1996; Klein et al, 2008; Thomas, 1998; Ketchatturat and et al, 2010)]
The construct validity testing for measurement model of value-added of learning achievement by confirmatory factor analysis using LISREL program version 8.72.
School group categorized by using the percentile of value-added score classified 7 groups including, very poor (pr<10) poor (10≤pr<25) fair (25≤pr<50) very fair (50≤pr<75) good (75≤pr<90) very good (90≤pr<95) and excellent (pr≥95).
4.The Results of Research
4.1 Descriptive statistics of GPAXand ONET year 2010 and 2011
Grade Point Average in year 2010 and 2011have quit similarity data. The maximum Grade Point Average was social study (Mean = 2.923 and3.002 respectivelyand SD = 0.296, 0.323 respectively) the minimum Grade Point Average was Mathematics (Mean = 2.394 and2.495 respectivelyand SD = 0.332, 0.378 respectively).
For the data distributionin year 2010 and 2011have quit different. For the data distribution in year 2010, Thai language social study and English language have negative skewness that means the score tend to high score. For the data distribution in year 2011, all subjects have positive skewness that means the score tend to low score.ONET in year 2010 and 2011have quit different data. For year 2010 the maximum score was social study (Mean = 42.903 SD = 2.759) the minimum score was Mathematics (Mean = 10.3912 SD = 2.066).
For year 2011 the maximum score was Thai language (Mean = 36.549 SD = 3.831) the minimum score was English language (Mean = 17.391 SD = 2.122).For the data distributionin year 2010 and 2011have similarity. All subjects have positive skewness that means the score tend to low score.4.2 Descriptive statistics of the equated with the linear method of the grade point average (GPAX) by
O-NET scores year 2010 and 2011
The linear equation which transformed the score of each subjects have quit different slope and constant.
Descriptive statistics of the equated with the linear method of the grade point average (GPAX) by O-NET scores yield the equated Grade Point Average year 2010 and 2011have quit similarity data. The maximum Grade Point Average was social study (Mean = 2.788 and2.899 respectivelyand SD = 0.201, 0.159 respectively) the minimum Grade Point Average was Mathematics (Mean = 2.307 and2.338 respectivelyand SD = 0.118, 0.136 respectively).For the data distributionsin year 2010 and 2011have similarity. All subjects have positive skewness that means the score tend to low score.As the statistics results show that the equated with the linear method of the grade point average (GPAX) have value lower than grade point average which no-equating.Table 1. Descriptive statistics of the equated with the linear method of the grade point average (GPAX) by O-NET scores year 2010 and 2011
variables N range minimum maximum mean SD variance Skewness Kurtosis
EQGPATH 2010 82 1.3888 2.0283 3.4171 2.5748 0.2410 0.0581 1.1237 2.6664 EQGPASO 2010 82 1.0968 2.3845 3.4813 2.7877 0.2007 0.0403 0.9385 2.4085 EQGPAEN 2010 82 1.0011 2.1479 3.1490 2.3440 0.1381 0.0191 3.7881 18.0306 EQGPAMA 2010 82 0.7717 2.1345 2.9062 2.3074 0.1179 0.0139 2.7239 10.3343 EQGPASC 2010 82 0.8900 2.1600 3.0500 2.3982 0.1534 0.0235 1.8742 5.2215 EQGPATH 2011 82 1.2858 2.3266 3.6124 2.7321 0.2285 0.0522 1.2928 3.3168 EQGPASO 2011 82 0.8899 2.6321 3.5220 2.8989 0.1591 0.0253 1.5936 4.3252 EQGPAEN 2011 82 1.0071 2.2128 3.2199 2.3998 0.1397 0.0195 3.8830 19.1015 EQGPAMA 2011 82 0.8725 2.0846 2.9571 2.3381 0.1357 0.0184 2.5931 10.0119 EQGPASC 2011 82 0.8500 2.1700 3.0200 2.4380 0.1482 0.0220 1.7023 4.6434
4.3. Value-added score of learning achievement for high school students
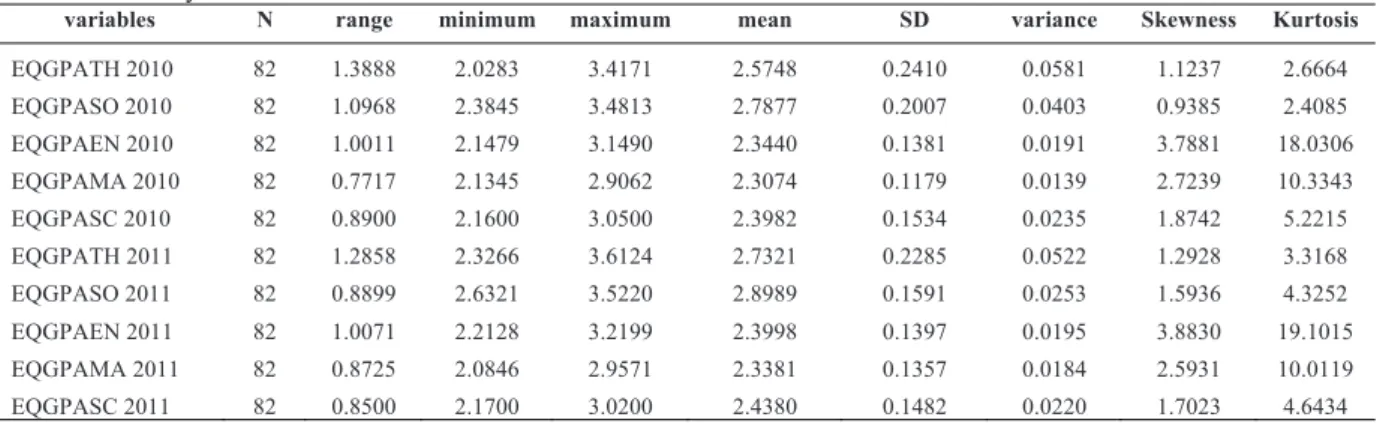
Descriptive statistics ofValue-added score of learning achievement for high school students yieldthe maximum score was Thai language (Mean = 0.0002 SE = 0.0162) the minimum score was English language (Mean = -0.0014 SD = 0.0065).
For the data distributions, all subjecthave normal distribution. The results of value added score for Thai language and Mathematics as figure 1.Table 2. Descriptive statistics ofValue-added score of learning achievement for high school students.
variables N range minimum maximum mean SE SD Skewness Kurtosis
VEQTH 82 0.7220 -0.4282 0.2938 0.0002 0.0162 0.1466 -0.6339 0.7651 VEQSO 82 0.5091 -0.2936 0.2155 -0.0005 0.0118 0.1071 -0.2735 0.0154
VEQEN 82 0.3795 -0.2199 0.1596 -0.0014 0.0065 0.0585 -0.3356 1.7050 VEQMA 82 0.3955 -0.2133 0.1822 0.0001 0.0081 0.0738 -0.1921 0.6431 VEQSC 82 0.5965 -0.2007 0.3958 -0.0009 0.0111 0.1010 0.6567 1.9532
Figure 1. Difference score of value-added score of 82 schools in Thai language and Mathematics.
Thai Language (SE=0.0162) Mathematics (SE=0.0081)
4.4 The measurement model of value-added of learning achievement for high school students
The developed measurement model consisted of 5 factors including value-added score of Thai language (VEQTH), Social Study (VEQSO), English language (VEQEN), Mathematics (VEQMA), and Sciences (VEQSC) which have correlations between 0.0991 – 0.6435 (Table 3). Confirmatory factor analysis used for construct validity testing for measurement model of value-added of learning achievement. The results show that the purpose model fitted the empirical data (Chi-Square = 2.30, df = 5, p-value = 0.8058, RMSEA = 0.0000, RMR = 0.0002) as figure 2.
Table 3. Pearson’s correlation matrix of value-added scores.
VEQTH VEQSO VEQEN VEQMA VEQSC
VEQTH 1.0000 VEQSO 0.5366** 1.0000 VEQEN 0.3427** 0.2045 1.0000 VEQMA 0.0991 0.1247 0.1572 1.0000 VEQSC 0.6435** 0.3942** 0.2548** 0.1526 1.0000 Mean 0.0002 -0.0005 -0.0014 0.0001 -0.0009 SD 0.1466 0.1071 0.0585 0.0738 0.1010 **p<.01
Figure 2. Measurement model of value-added of student’s learning achievement.
Chi-Square = 2.30, df = 5, p-value = 0.8058, RMSEA = 0.0000, RMR = 0.0002
1.00 VAM VEQTH 0.00 VEQSO 0.01 VEQEN 0.00 VEQMA 0.01 VEQSC 0.01 0.13 0.07 0.06 0.02 0.01
4.5 School group categorized by using the percentile of value-added score classified 7 groups including, very poor (pr<10) poor (10≤pr<25) fair (25≤pr<50) very fair (50≤pr<75) good (75≤pr<90) very good
(90≤pr<95) and excellent (pr≥95) as Table 4.
Table 4. N ofSchool group categorized by using the percentile of value-added score.
subject
N of school (%) and Percentile Rank of value-added score Very Poor )pr<10) (10≤≤Poor pr<25) Fair (25≤≤pr<50) Very Fair (50≤≤pr<75) Good (75≤≤pr<90) Very Good (90≤≤pr<95) Excellent (pr≥≥95) Thai language (VEQTH) (<-0.2106) 8 (9.8%) 12 (14.6%) (-0.2106 to -0.0779) 21 (25.6%) (-0.0778 to 0.0205) 21 (25.6%) (0.0206 to 0.0926) 12 (14.6%) (0.0927 to 0.1782) 4 (4.9%) (0.1783 to 0.2365) 4 (4.9%) (>0.2366) Social Study (VEQSO) (<-0.1439) 8 (9.8%) 12 (14.6%) (-0.1439 to -0.0614) 21 (25.6%) (-0.0613 to 0.0032) 21 (25.6%) (0.0033 to 0.0796) 12 (14.6%) (0.0797 to 0.1562) 4 (4.9%) (0.1563 to 0.1717) 4 (4.9%) (>0.1718) English language (VEQEN) (<-0.0711) 8 (9.8%) 12 (14.6%) (-0.0711 to -0.0410) 21 (25.6%) (-0.0409 to -0.0018) 21 (25.6%) (-0.0017 to 0.0357) 12 (14.6%) (0.0358 to 0.0712) 4 (4.9%) (0.0713 to 0.0956) 4 (4.9%) (>0.0957) Mathematics (VEQMA) (<0.0949) 8 (9.8%) 12 (14.6%) (-0.0949 to -0.0446) 21 (25.6%) (-0.0445 to 0.0092) 21 (25.6%) (0.0093 to 0.0409) 12 (14.6%) (0.0410 to 0.0949) 4 (4.9%) (0.0950 to 0.1273) 4 (4.9%) (>0.1274) Sciences (VEQSC) (<-0.1327) 8 (9.8%) 12 (14.6%) (-0.1327 to -0.0662) 21 (25.6%) (-0.0661 to 0.0077) 21 (25.6%) (-0.0078 to 0.0621) 12 (14.6%) (0.0622 to 0.1241) 4 (4.9%) (0.1242 to 0.1638) 4 (4.9%) (>0.1639) 5.Discussion
Researcher used the linear method for equating the GPAX by ONET because the result of the previous research (Kanjanawasee, S. and et al, 2009) indicated that the linear equating method is consistent with the empirical data and uncomplicated, operational convenience. Therefore, it should be equated the score before analysis the value-added.
The measurement model of value-added of learning achievement for high school students have 5 factors including value-added score of Thai language (VEQTH), Social Study(VEQSO), English language(VEQEN), Mathematics(VEQMA), and Sciences(VEQSC) according to the value of factor loading indicated that Thai language have the most important and Science, Social Study, English and Mathematics ,respectively. Therefore, there should be considered the first priority for GPAX of Thai language to determine the school value-added score. In addition, the measurement model of value-added of learning achievement fitted the empirical data that means it can be composite score of value-added model.
Value-added measure provides school leaders with rich diagnostic information, which they can use in many ways such as assigning personnel, allocating resources and identifying mentor teachers and coaches. Further, this approach can help the service area and school districts to design comprehensive accountability systems that can assess the impact that particular kinds of teaching, curriculum, and professional development have on academic achievement.
6. Suggestions
6.1 The office of Secondary Educational Service Areaable to bring the value-added score improving the quality of teaching and learning in each subject and to evaluate the quality of secondary schools within their area.
6.2 The office of Secondary Educational Service Area able to bring school group categorized by using the percentile of value-added score for selecting the need improvement school or excellent school.
6.3 This study used only a linear equating method. Therefore, there should study the efficiency of the other equating method.
Acknowledgements
This presented paper supported by 40th years Personnel Development Fund of Khon Kaen University, Thailand and The research fund of Faculty of Education, Khon Kaen University.
References
Kanjanawasee and et al. (2009). Development of the method of equating grade point average based learning outcome group by test score from O-NET of high school students. Journal of Social Science Research in Thailand. Paper selected in Meeting Conference 2009; p 50-70. Ketchatturat, J., Kanjanawasee, S., Suwanmonka, S. (2010). Development of Value-Added Model of Academic Achievement and
Self-Evaluation Checklist to Increase the Value of Education Provision Process. International Journal of Quality Assurance and Accreditation. Volume 2 (January – May 2010).
Klein, S., Freedman, D., Shavelson, R., & Bolus, R. (2008). Assessing school effectiveness.Evaluation Review, 32(6), 511-525. Kolen, Michael J. and Brennan, Robert L. (1995). Test Equating : Methods and Practices. Iowa : Springer-Verlag New York, Inc.
Thomas, S. (1998). Value-added measures of school effectiveness in the United Kingdom. Prospects, 28, 1, pp. 91–108 [Online]. Available from: www.springerlink.com/index /RMV18P0260010810.pdf[2008, September 12]
The World Bank. (2012). Learning Outcome. [Online]. Available from:http://web.worldbank.org/WBSITE/EXTERNAL/TOPICS/ EXTEDUCATION/0,,contentMDK:21911176~menuPK:5495844~pagePK:148956~piPK:216618~theSitePK:282386,00.html