Defence Science Journal, Vol 44, No I, January 1994, pp 53-60 @ 1994, DESIDOC
Cepstrum
Analysis -An
Advanced Technique
in Vibration
Analysis of Defects in Rotating Machinery
M. Sat yam, V. Sudhakara Rao and C.G.Devy
Naval Dockyard, Visakhapatnam-530014
ABSTRACT
Conventional frequency analysis in machinery vibration is not adequate to find out accurately defects in gears, bearings, and blades where sidebands and harmonics are present. Also such an approach is dependent on. the transmission path. On the other hand, cepstrum analysis accurately identifie.s harmonics and sideband families and is a better technique available for fault diagnosis in gears, bearings, and turbine blades of ships and submarines.
Cepstrum represents the global power content of a whole family of harmonics and sidebands when more than one family of sidebands are present at the same time. Also it i5 insensitive to the transmission path effects since source and transmisgion path effects are additive and can be separated in cepstrum.
The concept, underlying theory and the.measurement and analysis involved for using the technique are briefly outlined. Two cases were taken to demonstrate advantage of cepstrum technique over the spectrum analysis. An LP compressor was chosen to study the transmission path effects and a marine gearbox having two sets of sideband families was studied to diagnose the problematic sideband and its severity.
I. INTRODUCTION
All rotating machinery generate vibration, the analysis of which renders valuable information about the condition of machines. The old and conventional method of vibratory assessment is not adequate to predict the defects well in advance, whereas with the advent of FFT analysis and desk top computers, vibration signal analysis has become an extremely handy, early warning techniquel for predicting the onset of defects, giving adequate time tu plan and undertake preventive measures.
Spectrum analysis2 ha vibration analysis which a analysis. 'Cepstrum' is the a logarithmic scale". Thus, spectrum reducing each ha in the spectrutn to a sin
'rahmo':1ics' (it may be noted that CEPS is the inversion of SPEC in spectrum).
A conventional frequency analysis3 of a spectrum will have transmission path effects affecting the true source signature and also cannot pinpoint the defects accurately where the problem is associatep with more than one sideband and harmonic in case of gas turbines, steam turbines and gearboxes of on board ships and submarines. Trans: -lission path effects are additive and can be separated in cepstrum and also it gives ~n accurate detection of periodic structure in a spectrum associated with many harmonics and sidebands as a single component for each family of sidebands without any difficulty in interpreting the sideband structure like in spectrum.
2. THEORY
Initially, 'cepstrum' was defined as the 'power spectrum of the logarithmic power spectrum ,4. A
Received 27 July 1992
s some constraints in the re overcome in a cepstrum spectrum of a "spectrum on
it is a further analysis of the rmonic and sideband family gle component and a few
DEF SCI J, VOl 44, NO JANUARY 1994 y(t) x(t) I I I ~ I I 01 I I h(t) H(f) : . . X(f) y(f)
source transmission path combined signal I Y(f)12 = I X(f) 12 .I H(f) f
log Y = Jog X + log H
p-I { log Y } = p-I { log X} + p-I { Jog H }
Thus source and transmission path effects are additive in the cepstrum .
number of other terms, commonly found in the cepstrum literature are derived in an analogous way,
like cepstrum from spectrum, quefrency from
frequency, rahmonics from harmonics. However, the distinguishing feature of the Cepstrum is not just that it is a spectrum of a spectrum, but rather it is a spectrum of a 'Spectrum on logarithmic amplitude axis'. By comparison, it can be stated that its auto correlation is the inverse Fourier transform of the power spectrum without logarithmic con\iersion4.
There are two types of cepstra, viz. power cepstrum and complex cepstrum. The power cepstrum is defined as the 'inverse fourier transfor,m of the logarithmic power spectrum. This differs primarily from the original definition, in which, the result of the second Fourier transformation is not modified by obtaining the amplitude squared at each 'quefren~y'. Hence, it implies that the power cepstrum is reversible back to the
logarithmic cepstrum. The 'complex cepstrum'5
constitutes phase as well as logarithmic amplitude information at each frequency in the spectrum and hence it is reversible to a time signal.
Mathematically6,
3. VIBRATION MEASUREMENT AND ANAL YSIS
Vibration measurements were carried out on an LP Compressor at two different points on the same bearing (Fig. 1) to distinguish between Cepstrum and Spectrum with regard to transmission path effects. The location of measurement was,the coupling bearing between the
gearbox and rhe compressor. The RPM of the
compressor was 13,000, with a step-up gearbox dr,iven by an alternator of 1500 RPM. {Jog F xx(t) } . .1 {Jog Fx(f)} Power cepstrum, C (1) = p p Complex (!epstrum, Cc(1) =
p
POINT 1 .TOP OF BEARING POINT 2 -BASE OF BEARING
Auto correlation, Rxx(1) = pI { F xx(f) } . Where, ~x(1) is a power spectrum,
F (I) x is a frequency or amplitude of complex spectrum and p is an inverse Fourier transform. Also, ~x (I) = A2 (I)
and ~ = A (I) ej,l)t
log F xx(1) = 2 log A (I) Figure 1 Measurement location of the LP compressor (point I, top
or bearing; point 2, base or bearing).
To study sideband activity, a marine gearbox, installed on the test bed after refit, driven by a gas turbine was considered. The machine consists of two-stage reduction gear system with input from power turbine of RPM 4500 and with an output to propeller shaft of RPM 456. The output shaft is connected to a dynamometer. The measurement location was chosen over the intermediate shaft bearing and is shown in Fig.2.
Thus power cepstrum = complex cepstrum for spectra with zero phase.
Vibration signals generally represent a combination of source and transmission path effects. For example, internal forces in a machine which are the source of vibration act on a structure whose properties may be described by a frequency response function between the point of application and the point of measurement. The source and transmission path effects are involved in the time signals. These are multiplicative in the spectra and additive in the logarithmic spectra and the cepstra.
In both the cases the direction and the parameter of measurement7 were taken as radial and acceleration
SATYAM et aJ: CEPSTRUM ANALYSIS AN ADV ANCED TECHNIQUE
Scanning of recorded data showed the absence of
peaks at high frequencies and hence the analysis was
restricted to 2 kHz in the case .of the compressor and
up to 5 kHz-in the case of the gearbox. The following
equipment was used for data analysis. (i) vibration
analyser, (ii) IBM PCA T computer, and (iii) dot matrix
printer
The Cepstrum display shows the power spectrum
amplitude in dB on vertical axis with respect to the
quefrency in milliseconds on the horizontal axis,
GEAR BOX(j) HEASUREHENT POINT
Measurement location of Gearbox ( Measurement point).
Figure 2.
4. RESULTS AND DISCUSSIONS
Vibration levels are recorded at two points on the
bearing of the LP compressor. The recorded data was
analysed first using the 'spectrum mode' and then in
'cepstrum' to identify series of harmonics in the
spectrum. It is observed that 75 Hz harmonics are
present, which is the "1/3rd harmonic"
of the
compressor
rotation,
signifying
the
mechanical
looseness of the system. The cursor was positioned at
75 Hz and the cepstrum analysis was carried out for the
same points. The spectra in Figs. 3(a) & 4(a) taken at
respectively. The measurements were made in the
frequency range of 0-10 kHz.
.
The following instrumentation was used to carry out
the m~asurements.
a) Portable tape recorder
b) Accelerometer B&K Type 4366 with charge
sensitivity 4.75 pC/ms2, frequency range 1-10
kHz.
c) Charge amplifier
B&K
Type 2635 with
sensitivity up to 10 VlpC.
130
d.B acc
100
79.9
LP compressor: Point 1 : spectrum analysis.
DEF SCI J. VOL 44, NO JANUARY 1994
dB
0.00
Figure 3(b), LP compressor: Point I: cepstrum analysis.
O 1 the other hand, 75 Hz component is the only
singll. significant peak at both the points in the cepstra
which is from the source and shown in Figs. 3(b) &
4(b). This clearly shows the elimination of the
transmission path effects. Hence, it can be inferred that
'cepstrum' separates the transmission path effects from
those of the vibration source and gives 'tr\:e vibration
picture' irrespective of structural differences of ~
points 1 and 2 appear similar, but differ in details at most of the frequencies. A peak is present at 832 Hz at point 1 in the spectrum, which i~ not present at point 2. Similarly, the several peaks present at some, components in the spectrum at point 1 are not present in the spectrum at point 2. This signifies the impact of the transmission path differences between the two points even though the source of vibration is the same.
~ ; , ~
I~ 8: ~ I R"S LEUEL CURSOR FREQUDfCY
98.1 dB acc 72.98 Hz TOTAL RMS j '119. d.B ~cc
-I
!
~
1
I I--I :I 1 ~ dB acc ,.!-1-.
F-rJ;l ~Iff
~ 2.- k8.99
499.
899.
Hz1.28
k
1.69 k
Figure 4(3). LP compressor: Point 2 : spectrum analysis.
56
, , ,
I! ~ !
--1
~
f-SA TY AM et aJ: CEPSTRUM ANAL YSIS -AN ADVANCED TECHNIQUE
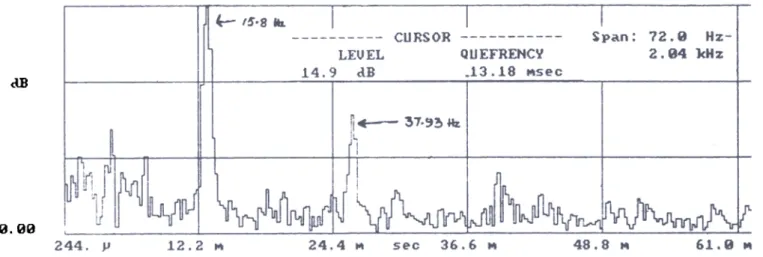
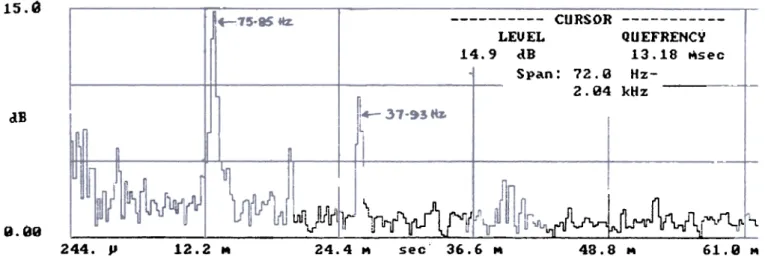
15.g
CURSOR
LEUEL
QUEFRENCY
14.9
dB
13.18
Msec
Span:
72.a
Hz-2.94
kHz
clB O" \lJfl ~lf~11r 1~11'1r1 i.r U'u f"I1fi r"'"1..r'lrl;I
244. V 12.2 M 24.4 M sec 6.6 M 48.8 M 61.9 M
I.
9.Q9
Figure 4(b), LP compressor: Point 2 : cepstrum analysis.
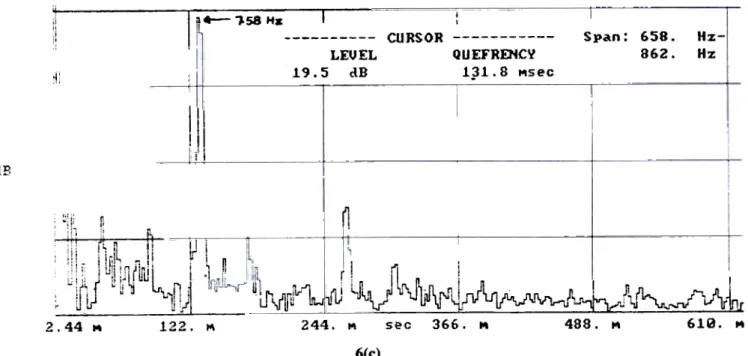
spectra which are not clear in the base band spectrum. But froni the observations of zoom spectra also it is not possible to conclude which sideband is severe. The corresponding cepstrum shows only one quefrency component at the output shaft frequency i.e. at 7.58 Hz and its rahmonic. The level of the quefrency at intermediate shaft frequency is very low since there are only limited number of sidebands. Mult~ple sidebands are observed at the output shaft frequency, while the total power content of the whole family of sidebands in the spectrum, appearing at intervals of 7.58 Hz, exists as a single component in the cepstrum analysis. It means
that cepstrum analysis accurately depicts the
problematic sideband by showing a single prominent component. This is due to the output shaft gear modul.ation caused -by the misalignment of the gear . Thus power cepstrum gives d~curate measure of sideband spacing including separation of different families and at the same time it is insensitive to the transmission path effects.
5. CONCLUSION
The study proves that the cepstrum ana'ysis technique in the field of machinery fault diagnosis, using vibration signatures is superior and accurate compared to the frequency analysis technique, where sideband activity and harmonics are present. Also, the method is insensitive, to a high degree, to phase differences in the original signal, and to the influence from the transmission path effects. Spectrum analysis is prone to errors because of the surrounding noise contamination of the recorded signal and transmission patn effects. The spectra taken at two points of a bearing are not
machine. To obtain a distinct peak in the cepstrum, a
reasonable number of members <?f the corresponding
harmonics or sideband family must be present, because,
cepstrum represents global power content of a whole
family
of
sidebands.
These uniformly
spaced
components must be adequately resolved in the
spectrum. For achieving this, it is often advantageous
to perform a cepstrum analysis on a spectrum obtained
by zo(Jm FFrB .The power cepstrum provides the ~bility
to detect a periodic signature in the spectrum at a single
location with well defined peak since it is the square of
all the significant amplitude periodic peaks put together
on a logarithmic scale.
Figure 5 shows the spectrum, zoomed spectrum
around the primary meshing (3280 Hz) and the
corresponding cepstrum analysis respectively at point 1
on a marine gear box (GB) of two stage reduction. This
GB was driven by a gas Turbine. The GB output was
connected to a dynamometer through the shaft in the
test bed. In the present case, there are no sufficient
number of sidebands around primary meshing as seen
from the zoomed spectra. Consequently, there are no
well defined rahmonics present in the cepstrum. From
this it can be inferred that there is no sufficient sideband
activity around the primary meshing. Hence, there are
no peaks representing the whole family of sidebands.
Figure 6 shows the spectrum, zoomed spectrum and
the corresponding cepstrum analysis for the same
gearbox at the same location. But, in this case, the
zooming is performed at the secondary meshing (760
Hz). Two types of sidebands; one at the intermediate
shaft frequency(23.2 Hz) and another at the output shaft
frequency (7.58 Hz) are observed from the zoomed
DEF SCI J. VOL 44. NO 1. JANUARY 1994 aB acc !I I. --I I -~-- CURSOR RMS LEVEL FREQUENCY 99.1 dB acc 3.289 kHz -
-+-3i..' Hz. : PQIMAay ~HING -~ !~ ~
~[
r
1111 --29.9
1.99 k
2.99. k
Hz 3.99 k 4.9Q k 5.99 k (a) CURSOR RMS LEVEL FREQUDfCY 98.3 a. ace 3.276 kHz -D acc ...3.77 k
2,'.7 k3.17 k
Hz 3.31 k 3.57 k2.77 k
(b) , " c1.B15.e
!n .., ", ,'1 ii 1 ]~ rL, JV...)Ltj.~ I u r~-{!Jl Ir'"uu~r~ ~ ~ fvlr t.r1l.-uRtf]rVIroJtJ!...J'liI1. 488. V 24.4 M 48.8 M sec 73.2 M 97.7 M 122. M Q.QQ (c)Figpre 5. Analyses on the gear box performed at the primary meshing (3280 H~): and (c) cepstrum analysis.
(a) spectrum analysis, (b) zoom spectrum analysis,
58
SATYAM et ai: CEPSTRUM ANALYSIS AN ADVANCED TECHNIQUE
in the cepstrum the severity of sideband or defect is indicated as a single component only. Cepstrum analysis makes it possible to precisely determine the problematic periodic peak-out of many periodic peaks and is thus a
, -, 5E.co..,oA..'ME5HIN(, ~~.
the same due to path difference, while the cepstra are
alike. The results of the gearbox spectrum are confusing
and it is difficult to identify the problem due to the
presence of more than one type of sidebands. Whereas
TOTAL RMS 118. dB acc i CURSOR ! RMS LEVEL FREQUENCY I 1114. dB acc 769.9 Hz
w
..~coI~
~:w
'fL1j
Ita 1'14.-
2-.
~.Hz
6..
a-.1.-
k
6(a)138.
N Z" u.t.~...,,; dB acc CURSOR RMS LEUI:L FREQUD4CY tl3. d.B ..cc 769.8 Hz ',, -TOTAL RMS II? d.B ACC1-.
11 fu1
Iiu
w '7.. .658.
698.
738.
Hz
778~
818.
858.
6(b)DEF SCI J. VOL 44. NO I. JANUARY 1994
Span:
658.
862.
Hz-Hz -I 11.- ,.58 Hz I CURSOR LEVEL QUEFRENCY 19.5 dB 1}1.8 MSeC .; , "0 IiI .J I ! I .:{Bn
;::!: ~ , i !-: Jt ~ r..i i r I ! ; , ! 'I! i i I.. I ::i"li~!ln1!: ;, , ' "1 w , '1( "'IL r~ I uu I I ; i, ' ; 'i: . "(
" c w;.i;. " ;, -,j ~ , :'1iJ ~ u .',..1: t c , I wI' , ; , , u ,1 .. U " l' 2.44 ~ 122. M I ,'1 : 1J ~~J l\Jt¥J!r.JW~J'LJ1 I J~~...",.,/~\{fl 366. M 488. M 619. M U ' "1
i 1'1: .li"jlt' U " ~U :!'..J s~c244. "'
6(c)Figure 6. Analyses on the gear box performed at the secondary mes..ing (76 Hz): (a) spectrum analysis, (b) zoom spe:ctrum analysis,
and (c) cepstrum analysis.
reliable diagnostic tool for defect identification. 3. Warring, R.H. Hand book of noise and vibration Further, it is an invaluable 1echnique for dete"ction and control,4th Edn. Trade and Technical Press Ltd; monitoring the developments of faults in gears, rolling Morden, Surrey, England, 1978, p. 386.
element bearings9, turbine blades, etc. where a fa~ily 4. Harris, Cyril M. & Crede, Charles E. Vibration
of harmonics and sidebands exist. measurement equipment and signal analyzers &
condition monitoring of machinery .In Shock and vibration handbook, edited by Harold, Crawford D & David, Fogarty E. Mc Graw-Hill Book Company, USA, 1988. pp. 13.43-13.45 and 16.16. 5. Lyon, R.H. & Ordubadi, A. Use of cepstra in acoustic signal analysis. ASMEJ. Mech Des, 1982, 104(2), 303-07.
6. Randall, R.B. Cepstrum analysis and gearbox fault diagnosis; Briiel & Kjaer application. note, Briiel & Kjaer Naerum Press, Denmark, 1973.pp. 4-5. 7. Randall, R. B. Cepstrum analysis. In Machine
health monitoring using vibration analysis. Canadian Acoustical Association, Vancou..;er , Canada, October 1983, pp. 1-15.
8. Volen, R.H. Technique and application of
mechanical signature analysis.S and V Digest,1979, 11(9), p. 12.
9. Courrech, J. New techniques for fault diagnostic in rolling element bearings. In Proceedings of the 4Oth meet of the mechanical failure preventive group, 16-18 April 1985. National Bereau of Standards, Gaithersburg, MD, 1985. pp. 16-20.
ACKNOWLEDGEMENTS
The authors wish to thank Cmde PK Chakravorty,
General Manager (Technical) Naval Dockyard,
Visakhapatnam as this paper received inspiration from his paper titled 'Signal Processing in Vibration Analysis
-Advanced Techniques', published in Defence
Science Journal July 1991 issue and, also for his constant encouragement in bringing out this paper. The authors wish to extend their gratitude to Dr RS Tripathi, DGM
(LAB), Naval Dockyard, Visakhapatnam for his
constant encouragement, interaction and supervision of the study. The paper could not have taken the present shape, but for the motivation provided by him.