arXiv:1712.01398v1 [astro-ph.GA] 4 Dec 2017
The connection between mass, environment and slow rotation in
simulated galaxies
Claudia del P. Lagos
1,2⋆, Joop Schaye
3, Yannick Bah´e
3, Jesse Van de Sande
4, Scott T.
Kay
5, David Barnes
5,6, Timothy A. Davis
7, Claudio Dalla Vecchia
8,91International Centre for Radio Astronomy Research (ICRAR), M468, University of Western Australia, 35 Stirling Hwy, Crawley, WA 6009, Australia. 2Australian Research Council Centre of Excellence for All-sky Astrophysics (CAASTRO), 44 Rosehill Street Redfern, NSW 2016, Australia.
3Leiden Observatory, Leiden University, PO Box 9513, NL-2300 RA Leiden, the Netherlands.
4Sydney Institute for Astronomy, School of Physics A28, The University of Sydney, NSW 2006, Australia.
5Jodrell Bank Centre for Astrophysics, School of Physics and Astronomy, The University of Manchester, Manchester M13 9PL, UK.
6Department of Physics, Kavli Institute for Astrophysics and Space Research, Massachusetts Institute of Technology, Cambridge, MA 02139, USA. 7Department of Physics and Astronomy, Cardiff University, Queens Buildings, The Parade, Cardiff CF24 3AA, United Kingdom.
8Instituto de Astrof´ısica de Canarias, C/V´ıa L´actea s/n, E-38205 La Laguna, Tenerife, Spain.
9Departamento de Astrof´ısica, Universidad de La Laguna, Av. del Astrof´ısico Francisco S´anchez s/n, E-38206 La Laguna, Tenerife, Spain.
9 November 2018
ABSTRACT
Recent observational results from integral field spectroscopic (IFS) surveys indicate that the fraction of galaxies that are slow rotators,FSR, depends primarily on stellar mass, with no
sig-nificant dependence on environment. We investigate these trends and the formation paths of slow rotators using theEAGLEandHYDRANGEAhydro-dynamical simulation suites.EAGLE consists of several cosmological boxes of volumes up to (100 Mpc)3
, while HYDRANGEA consists of24cosmological zoom-in simulations of galaxy clusters and their large scale envi-ronment. Together they provide a statistically significant sample in the stellar mass range of interest,109.5M⊙
−1012M⊙, of16,431galaxies. We construct IFS-like cubes and measure
stellar spin parameters,λR, and ellipticities, allowing us to classify galaxies into slow and fast
rotators as in observations. The simulated galaxies display a primary dependence ofFSRon
stellar mass, with a weak dependence on environment. At fixed stellar mass, satellite galaxies are more likely to be slow rotators than centrals. In addition,FSRshows a dependence on halo
mass at fixed stellar mass for central galaxies, while no such trend is seen for satellites. We find that≈70% of slow rotators atz= 0have experienced at least one merger with mass ratio >0.1, with dry major mergers being at least twice more common than minor and wet major mergers in this population. Individual dry mergers tend to decreaseλR, while wet mergers
mostly increase it. However,30% of slow rotators atz= 0have not experienced mergers, and those inhabit halos with median spins twice smaller than the halos hosting the rest of the slow rotators. Thus, although the formation paths of slow rotators can be varied, dry major mergers and/or halos with small spins dominate.
Key words: galaxies: formation galaxies: evolution galaxies: kinematics and dynamics
-galaxies: structure
1 INTRODUCTION
Integral field spectroscopy (IFS) is opening a new window for exploring galaxy formation and evolution. Many recent surveys, such as ATLAS3D (Cappellari et al. 2011), SAMI (Croom et al. 2012;Bryant et al. 2015), CALIFA (S´anchez et al. 2012), MAS-SIVE (Ma et al. 2014) and MaNGA (Bundy et al. 2015) are explor-ing how the resolved kinematics of the stars and ionised gas relate to global galaxy properties, such as stellar mass, colour, star for-mation rate (SFR) and environment, among others. The most rev-olutionizing aspect of these surveys is that due to their significant
⋆ E-mail: [email protected]
volumes, they are able to observe many hundreds to many thou-sands galaxies spanning a very wide dynamic range in mass and environment. This enables the galaxy population to be dissected into many properties, but most significantly into stellar and envi-ronment, which are thought to be primary drivers in the evolution of galaxies (e.g.Peng et al. 2010).
One of the most prominent early examples of the success of IFS surveys was the pioneering work of the SAURON (Bacon et al. 2001) and ATLAS3D(Cappellari et al. 2011) surveys, comprised of260early-type galaxies in total. These surveys showed that the stellar kinematics and distributions of stars are not strongly corre-lated in early-types, and thus that morphology is not necessarily a good indicator of the dynamics of galaxies (Krajnovi´c et al. 2013).
c
Based on these surveys, Emsellem et al.(2007, 2011) coined the termsslowandfastrotators, and proposed theλRparameter, which measures how rotationally or dispersion-dominated a galaxy is, as a new, improved scheme to classify galaxies. The most significant trend found by Emsellem et al. (2011) and extended recently to higher stellar masses byVeale et al.(2017b), is that the fraction of slow rotators increases steeply with stellar mass and towards denser environments, and that the vast majority of S0 galaxies are fast ro-tators.
Recent surveys spanning much larger volumes have been able to revisit this issue including the trends with environment.
Brough et al.(2017),Veale et al.(2017b) andGreene et al.(2017) using the SAMI, MASSIVE and MaNGA surveys, respectively, found that the fraction of slow rotators depends strongly on stellar mass, with a very weak or no dependence on environ-ment once stellar mass is controlled for (see Houghton et al. 2013; D’Eugenio et al. 2013 for earlier studies on cluster gions). They found that the original environmental dependence re-ported in ATLAS3D(Emsellem et al. 2011) was fully accounted for by massive galaxies preferentially living in denser environ-ments. Interestingly, the three surveys reached the same conclu-sion despite the very different environments and mass ranges studied. Brough et al. (2017) focused on cluster galaxies only, whileGreene et al.(2017) covered a much wider halo mass range,
Mhalo = <1012M⊙,1015M⊙
. Veale et al.(2017b) on the other hand make no environmental selection, but only study galaxies with stellar masses & 1011M
⊙. Note, however, that Greene et al.(2017) observed a weak trend for satellite galaxies to display a slightly higher frequency of slow rotation than centrals at fixed stellar mass, but this trend is not significant. Thus, the ques-tion of whether there is an environmental effect on the incidence of slow rotation or not, and in which regimes it is more likely to be significant, remains unanswered.
The early results from SAURON and ATLAS3Dprompted a wealth of simulations and theoretical work.Jesseit et al. (2009),
Bois et al.(2011) andNaab et al.(2014), based on simulations of modest numbers of galaxies, found that the formation paths of slow and fast rotators can be highly varied. Naab et al. (2014) showed that slow rotators could be formed as a result of wet major mergers, or by dry minor mergers. In the case of wet mergers, the remnant can be either a fast or a slow rotators, or even a disk (e.g.Springel 2000;Cox et al. 2006;Robertson et al. 2006; Johansson et al. 2009; Di Matteo et al. 2009;Peirani et al. 2010; Lotz et al. 2010; Naab et al. 2014; Moreno et al. 2015).
Sparre & Springel (2016), however, found that galaxy remnants of major mergers can easily evolve into star-forming disk galax-ies unless sufficiently strong feedback is present to prevent the disk regrowth. Similarly,Moster et al.(2011) concluded that even a dry merger remnant can become a fast rotator if the surrounding gaseous halo continues to cool down, fuelling the central galaxy and leading to disk regrowth.
Although valuable insight can be gained from the idealised and cosmological zoom-in simulations above, they struggle to shed light into the effect of environment and in having an unbiased rep-resentation of different formation pathways. The latter comes natu-rally from large, cosmological hydrodynamical simulations, which have the ability to simultaneously follow the evolution of tens of thousands of galaxies in a very wide range of environments. Re-cently, there has been a major breakthrough in the capability of cos-mological hydrodynamical simulations to produce realistic galaxy populations. This has been achieved thanks to improved subgrid models for unresolved feedback processes, the calibration of
sub-grid feedback parameters to match key observables, and the abil-ity to run large cosmological volumes with sub-kpc resolution. Ex-amples of these simulations includeEAGLE(Schaye et al. 2015), Illustris (Vogelsberger et al. 2014) and its successor Illustris-TNG (Pillepich et al. 2017), and Horizon-AGN (Dubois et al. 2014).
The simulations above reproduce, with various degrees of suc-cess, the morphological diversity of galaxies observed in the local Universe, the galaxy colour bimodality, the SFR-stellar mass re-lation, the stellar mass function and the cosmic SFR density evo-lution (e.g.Furlong et al. 2015b;Genel et al. 2014;Trayford et al. 2015,2016; Snyder et al. 2015; Dubois et al. 2016; Nelson et al. 2017). Recently,Penoyre et al.(2017) analysed the formation path of thousands of elliptical galaxies in Illustris and concluded that major mergers were the most important formation path of slow ro-tators. Surprisingly,Penoyre et al.(2017) found no significant dif-ference between the effect of dry vs. wet mergers on the spin of galaxies, in contradiction with the work ofNaab et al.(2014) on cosmological zooms.
In this paper we use theEAGLE and HYDRANGEA simula-tions with the aim of exploring how the frequency of slow rota-tors depend on mass and environment. EAGLEsimulated a box
of100(cMpc)3
, whileHYDRANGEAis a suite of24 cosmologi-cal zoom-in simulations of galaxy clusters and their environments (Bah´e et al. 2017), which is part of the larger Cluster-EAGLE project (Barnes et al. 2017). The latter consists of30galaxy clus-ters (6 more than HYDRANGEA). The advantage of using HY
-DRANGEAhere is that it resolves a larger Lagrangian region of 10 r200 for each cluster (as oppose to5 r200 in Cluster-EAGLE), allowing us to study groups around clusters. TogetherEAGLEand
HYDRANGEAspan the halo mass range1011M
⊙−1015.3M⊙and provide large statistics. Given this wide dynamic range, we expect our simulations to be able to reveal an environmental dependence of the fraction of slow rotators if any is present. Our aim is to con-nect these dependencies with the different formation paths of slow rotators and to disentangle nurture vs. nature in their formation.
EAGLE is an ideal testbed for our analysis, as it has been shown to reproduce the size-stellar mass relation (Furlong et al. 2015a) and the specific angular momentum-stellar mass relation (Lagos et al. 2017b;Swinbank et al. 2017) throughout time, both of which reflect the ablity of the simulation to reproduce structural and dynamical properties of galaxies. In addition, EAGLEreproduces very well the evolution of SFR properties of galaxies (Furlong et al. 2015b), colours (Trayford et al. 2015), the gas contents of galaxies (Bah´e et al. 2016;Lagos et al. 2015,2016;Crain et al. 2016), and produces both a blue cloud of predominantly disky galaxies, and a red sequence of mostly elliptical galaxies (Correa et al. 2017).
This paper is organised as follows. In§2we briefly describe theEAGLEsimulation suite and introduce the IFU-like cubes and the kinematic properties we measure in the simulated galaxies.§3
presents an analysis of the kinematic properties of simulated galax-ies atz = 0and the dependence on mass, environment and mor-phology. Here, we also present a thorough comparison with obser-vations. In§4we study the physical origin of slow rotators inEA
Table 1.Features of theEAGLERef-L100N1504 and Ref-L050N752 and simulations used in this paper. The rows list: (1) initial particle masses of gas and (2) dark matter, (3) comoving Plummer-equivalent gravitational softening length, and (4) maximum physical gravitational softening length. Units are indicated in each row.EAGLEadopts (3) as the softening length at
z>2.8, and (4) atz <2.8. These two simulations have volumes of side
L= 100and50 cMpc3, respectively.
Property Units Value
(1) gas particle mass [M⊙] 1.81×10⁶ (2) DM particle mass [M⊙] 9.7×10⁶
(3) Softening length [ckpc] 2.66
(4) max. gravitational softening [pkpc] 0.7
2 THE EAGLE SIMULATION
TheEAGLEsimulation suite1(described in detail bySchaye et al. 2015, hereafter S15, andCrain et al. 2015, hereafter C15) consists of a large number of cosmological hydrodynamic simulations with different resolutions, cosmological volumes and subgrid models, adopting the Planck Collaboration (2014) cosmological parame-ters. S15 introduced a reference model, within which the param-eters of the sub-grid models governing energy feedback from stars and accreting black holes (BHs) were calibrated to ensure a good match to thez = 0.1galaxy stellar mass function and the sizes of present-day disk galaxies.
In Table 1we summarise the parameters of the simulation used in this work, including the number of particles, volume, par-ticle masses, and spatial resolution. Throughout the text we use pkpc to denote proper kiloparsecs and cMpc to denote comoving megaparsecs. A major aspect of theEAGLEproject is the use of state-of-the-art sub-grid models that capture unresolved physics. The sub-grid physics modules adopted by EAGLEare: (i) radia-tive cooling and photoheating (Wiersma et al. 2009a), (ii) star for-mation (Schaye & Dalla Vecchia 2008), (iii) stellar evolution and chemical enrichment (Wiersma et al. 2009b), (iv) stellar feedback (Dalla Vecchia & Schaye 2012), and (v) black hole growth and ac-tive galactic nucleus (AGN) feedback (Rosas-Guevara et al. 2015). In addition, the fraction of atomic and molecular gas in a gas parti-cle is calculated in post-processing followingRahmati et al.(2013) andLagos et al.(2015).
TheEAGLEsimulations were performed using an extensively modified version of the parallelN-body smoothed particle hydro-dynamics (SPH) code GADGET-3 (Springel 2005). Among those modifications are updates to the SPH technique and time step-ping, which are collectively referred to as ‘ANARCHY’ (see
Schaller et al. 2015for an analysis of the impact of these changes on the properties of simulated galaxies compared to standard SPH). We use SUBFIND (Springel et al. 2001; Dolag et al. 2009) to identify self-bound overdensities of particles within halos (i.e. sub-structures). These substructures are the galaxies inEAGLE.
In addition to the EAGLE suite, we also analyse the HY
-DRANGEAsuite presented inBah´e et al. (2017). This suite con-sists of 24cosmological zoom-in simulations of galaxy clusters and their large scale environments in the halo mass rangeM200=
1 See http://eagle.strw.leidenuniv.nl and
http://www.eaglesim.org/for images, movies and data products.
A database with many of the galaxy properties in EAGLE is publicly available and described inMcAlpine et al.(2015).
1014
−1015.4M
⊙, withM200 denoting the total mass within a sphere of radiusr200, within which the average density equals200 times the critical density. These clusters were simulated with the sameEAGLE reference model, but with a higher temperature to which AGN heat nearby gas particles,∆TAGN, and a higher vis-cocity parameter,Cvisc, that controls the effect of angular mo-mentum on black hole gas accretion. The referenceEAGLEmodel adopted∆TAGN= 108.5KandCvisc = 2π, whileHYDRANGEA
adopted∆TAGN= 109KandCvisc= 2π×102(this model is re-ferred to as AGNdT9 in S15; see their Table3). TheHYDRANGEA
outputs were analysed with the same tools employed inEAGLE, and described above. In AppendixA2we compare the AGNdT9 and reference models on the same box, number of particles and initial conditions, and show that AGNdT9 tends to produce a very similar number of slow rotators at109.5M
⊙&Mstars&1011M⊙ compared to the referenceEAGLEmodel (≈9%).
Throughout the text we will refer to ‘central’ and ‘satellite’ galaxies, where the central corresponds to the galaxy hosted by the main subhalo of a Friends-of-Friends halo, while other subhalos within the group host satellite galaxies (Qu et al. 2017).Lagos et al.
(2017b) showed in a study of the specific angular momentum evo-lution of galaxies inEAGLE, that an appropriate stellar mass cut above which galaxies have angular momentum profiles converged isMstars > 5×10⁹M⊙. Thus, we adopt that threshold in this work (see AppendixA1for a convergence study).
2.1 Kinematic measurements
In this paper we measure ther-band luminosity-weighted line-of-sight velocity, velocity dispersion, stellar spin parameterλR, and ellipticity of all galaxies inEAGLEin the simulations presented in Table1and theHYDRANGEAclusters. We describe our procedure below.
We first construct the stellar kinematic maps for each galaxy by projecting them onto a2-dimensional plane. We use two ori-entations: an edge-on view, in which the stellar spin is oriented along they-axis of the image, and a random view, in which the line-of-sight is along thez-axis of the simulated box. We bin this 2-dimensional image onto pixels of widthw and construct ar -band luminosity-weighted velocity distribution for each bin, using the centre of potential of the galaxy as the rest frame. We adopted
w = 1.5 pkpc(approximately twice the softening length ofEA
-GLE; see Table1). In Appendix A3we show that the kinematic properties we are measuring here are converged to better than7%. We only see significant convergence issues if the bin is chosen to be close to the softening length of the simulation. The chosen bin of 1.5pkpc is very similar to the average spatial resolution of SAMI galaxies (1.6pkpc;van de Sande et al. 2017).
We fit a Gaussian to ther-band luminosity line-of-sight ve-locity distribution of each pixel, and define the rotational ity as the velocity at which the Gaussian peaks, and the veloc-ity dispersion as the square root of the variance. This procedure closely mimics the measurements performed in integral field spec-troscopic (IFS) surveys, such as ATLAS3D(Cappellari et al. 2011) and SAMI (van de Sande et al. 2017). The result of this proce-dure is shown in Fig. 1for4relatively massive galaxies in the Ref-L050N752 simulation,2star-forming and2passive, oriented edge-on. For this visualization we use the KINEMETRYpackage of Krajnovi´c et al. (2006), and for the colour scale of the rota-tional velocity maps we adopt the range [−Vmax, Vmax]. Here, Vmax is the maximum circular velocity expected for the stellar mass of the galaxy assuming the Tully-Fisher relation measured
by Dutton et al.(2011). The purpose of this colour scheme is to make slow rotation visually evident. In general, we find that at fixed stellar mass, passive galaxies tend to be rounder and more slowly rotating than star-forming galaxies. We will come back to this in §3.
We construct velocity and luminosity maps, such as those in Fig. 1, for all galaxies in the simulations of Table1 and in the
HYDRANGEAcluster suite atz = 0. From these maps we calcu-late ther-band luminosity-weighted rotational velocity,V, veloc-ity dispersion,σ, spin parameter,λR, and ellipticities,ǫ, at radii 0.5,1,1.5,2,×r50, withr50being the projected half-stellar mass radius. We first calculateǫas inCappellari et al.(2007),
ǫ= 1− r
a2
b2, (1)
where,
a2 = ¯x 2+ ¯y2
2 +
s
¯
x2−¯y2 2
2
+ ¯xy,
b2 = ¯x2+ ¯y2
2 −
s
¯
x2−¯y2 2
2
+ ¯xy, (2)
and,
¯
x2=
P
iLix2i
P
iLi
,¯y2=
P
iLiyi2
P
iLi
,xy¯ = P
iLixiyi
P
iLi
. (3)
Here,icorresponds to the pixels inside the aperture in which we wish to measureǫ,Li is the r-band luminosity contained in the
pixel,(xi, yi)are thexandypositions of the selected pixels. This
measurement ofǫis equivalent to diagonalizing the inertia tensor of the galaxy’s stellar surface density. We also calculate the position angle of the major axis of the galaxy (measured counter clockwise fromy= 0) as
θPA= atan
2 ¯xy
¯
x2−y¯2
. (4)
We then calculate ther-band luminosity-weightedV,σand
λRwithin ellipses of ellipticityǫand major axis0.5,1,1.5,2×r50. Note that the value of ellipticity depends on the adopted major axes. Examples of the values ofǫobtained via this method are shown in Fig.1.
We calculateV,σandλRas
σ2 = P
iLiσ
2
i
P
iLi
, (5)
V2 = P
iLiV
2
i
P
iLi
, (6)
λR =
P
iLiri|Vi|
P
iLiri
p
V2
i +σ2i
, (7)
whereViandσiare ther-band luminosity-weighted line-of-sight
mean and standard deviation velocities in the pixelicalculated as described above, andriis the distance from the centre of the galaxy
to the pixel (i.e. the circular radius). As inEmsellem et al.(2011), to measure these quantities withinr, we include only pixels en-closed by the ellipse of major axisr, ellipticityǫ(r)and position angleθPA(r).
IFS surveys typically compareǫandλRmeasured within the same aperture (typically an effective radius; e.g.Emsellem et al. 2011and van de Sande et al. 2017). We follow this and compare
λRandǫmeasured withinr50, and refer to these asλr50 andǫr50, respectively, unless otherwise stated.
2.2 Galaxy mergers
We use the merger trees available in the EAGLE database (McAlpine et al. 2015) to identify galaxy mergers. These merger trees were created using theD−Treesalgorithm of Jiang et al. (2014).Qu et al.(2017) described how this algorithm was adapted to work withEAGLEoutputs. Galaxies that went through merg-ers have more than one progenitor, and for our purpose, we track the most massive progenitors of merged galaxies, and compare the kinematic properties of those with that of the merger remnant. The trees stored in the public database ofEAGLEconnect29epochs. The time span between snapshots can range from≈ 0.3Gyr to ≈1Gyr.Lagos et al.(2017a) showed that these timescales are ap-propriate to study the effect of galaxy mergers on the specific an-gular momentum of galaxies, as mergers roughly take that time to settle.
We split mergers into major and minor mergers. The former are those with a stellar mass ratio between the secondary and the primary galaxy>0.3, while minor mergers have a mass ratio be-tween0.1and0.3. Lower mass ratios are classified as smooth ac-cretion (Crain et al. 2016). In addition, and followingLagos et al.
(2017a), we split mergers into gas-rich (wet) and gas-poor (dry) based on the neutral gas (atomic plus molecular) to stellar mass ratio of the merger:
Rgas,merger≡ Ms
neutral+M p neutral Ms
stars+M p stars
, (8)
whereMs
neutralandM p
neutralare the neutral gas masses of the sec-ondary and primary galaxies, respectively, whileMs
starsandM p stars are the corresponding stellar masses. Here we classify mergers with
Rgas,mergers 6 0.1as dry, and the complement as wet. For dry mergers, the averageRgas,mergeris≈0.02.
Masses are measured within an aperture of30pkpc. Neutral gas fractions of individual particles inEAGLEare calculated as in
Rahmati et al.(2013) andLagos et al.(2015).
3 KINEMATIC PROPERTIES OFEAGLEGALAXIES
We visually inspect the kinematic morphology of galaxies in the
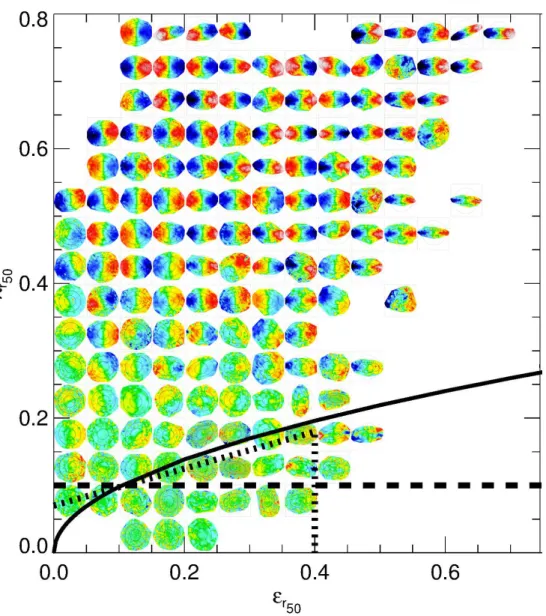
λr50-ǫplane, which has been proposed byEmsellem et al.(2007) as an effective way of distinguishing slow and fast rotators. Fig.2
shows the rotational velocity maps of randomly selected galaxies in bins ofλr50 andǫ. We construct the maps as in Fig. 1. Lines indicate different ways of defining slow rotators from the literature. There is an evident transition at aroundλr50 ≈ 0.2below which galaxies are very deficient in rotation, even out to3r50. IfEAGLE
-10 0 10 -10
0 10
log10(Lr/1040 erg s-1) -3.29 -2.78 -2.26 -1.75 -1.23 -0.72 -0.21
-10 0 10
Vrot/ km s-1
-189.3 -126.2 -63.1 0.0 63.1 126.2 189.3
-10 0 10
Vdisp/ km s-1
0.0 33.5 67.0 100.4 133.9 167.4 200.9
-10 0 10
-10 0 10
log10(Lr/1040 erg s-1) -3.19 -2.78 -2.37 -1.96 -1.55 -1.15 -0.74
-10 0 10
Vrot/ km s-1
-171.1 -114.1 -57.0 0.0 57.0 114.1 171.1
-10 0 10
Vdisp/ km s-1
0.0 13.6 27.2 40.8 54.3 67.9 81.5
-15 -10 -5 0 5 10 15
-15 -10 -5 0 5 10 15
log10(Lr/10
40 erg s-1)
-3.30 -2.86 -2.42 -1.99 -1.55 -1.11 -0.67
-15 -10 -5 0 5 10 15
Vrot/ km s
-1
-175.6 -117.1 -58.5 0.0 58.5 117.1 175.6
-15 -10 -5 0 5 10 15
Vdisp/ km s
-1
0.0 28.5 57.0 85.4 113.9 142.4 170.9
-20 -10 0 10 20
-20 -10 0 10 20
log10(Lr/10
40 erg s-1)
-3.38 -2.89 -2.41 -1.93 -1.44 -0.96 -0.48
-20 -10 0 10 20
Vrot/ km s
-1
-229.8 -153.2 -76.6 0.0 76.6 153.2 229.8
-20 -10 0 10 20
Vdisp/ km s
-1
0.0 36.1 72.2 108.3 144.5 180.6 216.7
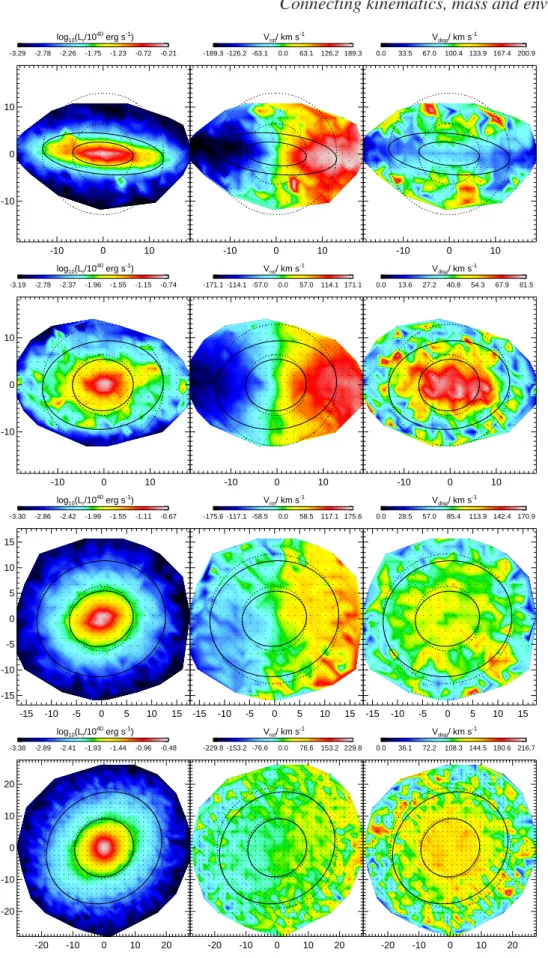
Figure 1.Examples of an edge-on view of the r-band luminosity (left), rotation (middle) and velocity dispersion (right) fields of4galaxies with2×
1010M
⊙ < Mstars < 4×10¹⁰M⊙atz = 0in the Ref-L050N752 simulation. Axes show distance from galaxy centre in pkpc. The top2galaxies haveSFR>1 M⊙yr−1, while the bottom2haveSFR<0.2 M⊙yr−1. The colour scales are indicated at the top of each panel, and in the case of the rotational velocity map, we force the range[−Vmax, Vmax], whereVmaxis the maximum circular velocity expected for the stellar mass of the galaxy given the Tully-Fisher relation measured byDutton et al.(2011). The physical scale of the images is shown along the axes and is in pkpc. Circles show1and2r50 of the galaxies, while ellipses are constructed using our ellipticity measurements at1and2r50(see Eq.1). From top to bottom, the values ofǫr50are0.65,
0.6,0.12and0.07, respectively.
Figure 2.Rotational velocity field of randomly selected galaxies in theλr50-ǫr50 plane from the Ref-L050N752 simulation. Galaxies here are randomly oriented. The colour scales of the maps and circles/ellipses are as in Fig.1. Lines show the classification of slow rotators fromEmsellem et al.(2007),
Emsellem et al.(2011) andCappellari(2016), as dashed, solid and dotted lines, respectively.
In Fig. 3 we visually compare the positions of galaxies in the λr50-ǫ plane in the Ref-L100N1504 and HYDRANGEA simulations with those of the observational surveys ATLAS3D (Emsellem et al. 2011), MASSIVE (Veale et al. 2017a) and SAMI (van de Sande et al. 2017). The former two are volume-limited sur-veys of early-type galaxies, while SAMI is a stellar mass selected survey, thus including both late and early types. Since we include all galaxies withMstars > 5×10⁹M⊙ in the simulations, our results may be more comparable to SAMI. The sizes and colours of the symbols scale with stellar mass, so that the most massive galaxies appear as larger symbols.
SAMI appears to have systematically lower λr50 compared to ATLAS3D, which is not surprising as the measurements are not performed exactly in the same way. In ATLAS3D,Emsellem et al.
(2011) adopted the radial distance to the luminosity centre asriin
Eq.7, while in SAMI,van de Sande et al.(2017) adopted the semi major axis of the ellipse that goes through the given bin asriin
Eq.7.
Our calculation of λr50 resembles more closely that in ATLAS3D. In the three surveys, galaxies withMstars&1011.5M⊙ (largest symbols in Fig.3) preferentially have lowλr50, and the same is seen to some extent in theHYDRANGEAsimulation, but in the Ref-L100N1504 simulation all massive galaxies are slightly above the observational delimitation of slow rotators. Compared to MASSIVE (middle panel in Fig.3), it is apparent that our simula-tions do not produce the right fraction of slow rotators at the very massive end. We will come back to this in§3.1.
Both simulations lack the very high ellipticity galaxies,ǫr50 & 0.7. The latter may be due to the subgrid interstellar medium physics included in the simulations, which prevents very flat Milky-Way like disks from forming. InEAGLEa global temperature floor,
Figure 3. λr50 as a function of ǫr50 for galaxies in the ATLAS3D (Emsellem et al. 2011; top panel), MASSIVE (Veale et al. 2017a; second panel) and SAMI (van de Sande et al. 2017; third panel) surveys, and for the simulations Ref-L100N1504 (fourth panel) andHYDRANGEA(bottom panel). Galaxies in the two simulations are randomly oriented. Lines show the classification of slow and fast rotators from Emsellem et al.(2007),
Emsellem et al.(2011) andCappellari(2016), as dashed, solid and dotted lines, respectively. Sizes and colours of the symbols correspond to different stellar masses, as labelled in the top panel.
0.0 0.2 0.4 0.6 0.8
λr 50
SB
MS P Ref-L100N1504
10.0 10.5 11.0 11.5 12.0
log10(Mstars/MO •) 0.0
0.2 0.4 0.6 0.8
λr 50
Hydrangea
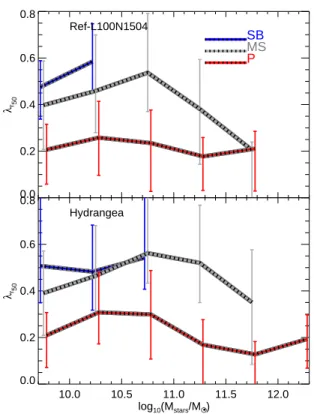
Figure 4. λr50 as a function of stellar mass for galaxies in the Ref-L100N1504 (top panel) and HYDRANGEA(bottom panel) simulations. Lines and error bars show the median and16th−84thpercentile ranges, re-spectively, for galaxies that are classifies as starburst (SB), main sequence (MS) or passive (P), as labelled. We define the above samples based on
δMS:>4,0.1−4,<0.1. Only bins with>5objects are shown.
. 1 kpc, larger than the Milky-Way or other grand-design
spi-ral galaxies, which exhibit scaleheights typically of ≈ 0.4 kpc (Kregel et al. 2002). Thus, it is not surprising that very flat galaxies do not exist inEAGLEorHYDRANGEA. AppendixA1shows that increasing the resolution by a factor of8in mass and2in spatial resolution does not significantly change the ellipticity of galaxies, supporting our conclusion.
Fig.4showsλr50as a function of stellar mass for galaxies in the Ref-L100N1504 andHYDRANGEAsimulations atz = 0. We use different symbols to show starburst, main sequence and passive galaxies. We define the latter in terms of their specific star forma-tion rate,sSFR = SFR/Mstars, relative to the main sequence at that stellar mass. We calculate the latter as inFurlong et al.(2015b). In short, the main sequence is calculated as the median sSFR of all galaxies that have sSFR>0.01 Gyr−1in a bin of stellar mass. We refer to the this ashsSF R(M)i. We then calculate the sSFR of galaxies relative to the main sequence,
δMS = sSFR
hsSFR(M)i. (9)
Starburst (SB), main sequence (MS) and passive galaxies are clas-sified as those withδMS>4,0.1< δMS<4andδMS<0.1, respectively.
In both simulations passive galaxies tend to have a lower
λr50 than MS galaxies at fixed stellar mass. SB galaxies have a slightly higher median λr50 than MS galaxies but the scatter is much larger. InHYDRANGEAmost of the galaxies withMstars &
1011.7M
⊙are passive, which is expected given that the
0.0 0.2 0.4 0.6 0.8 1.0
FSR
Measurements at r50
Ref-L100N1504
Sim+E11 Sim+E07
Sim+C16 ( 0.05 err)
Brough+17
van de Sande+17
Combined E11+V17
9.5 10.0 10.5 11.0 11.5 12.0
log10(Mstars/MO •) 0.0
0.2 0.4 0.6 0.8 1.0
FSR
Hydrangea
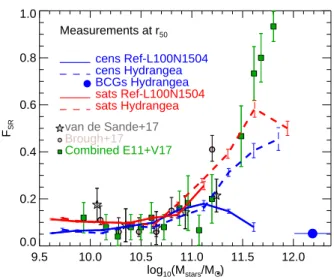
Figure 5.The fraction of slow rotators,FSRas a function of stellar mass in the Ref-L100N1504 (top panel) andHYDRANGEA(bottom panel) sim-ulations. We classified slow rotators using theEmsellem et al.(2007) (red dashed line),Emsellem et al.(2011) (black solid line) andCappellari(2016) (blue dot-dashed line) criteria. We also show the observations from the SAMI (van de Sande et al. 2017), the SAMI-clusters (Brough et al. 2017), MASSIVE (Veale et al. 2017a) and ATLAS3D(Emsellem et al. 2011) sur-veys. The latter two are presented in combination (combined E11+V17) . Error bars show1standard deviation calculated with10jackknife resam-plings in each stellar mass bin. We also show as dotted lineFSRfor the
Cappellari(2016) criterion shifted by0.05to show the systematic effect of having small errors inλr.
ments of these simulations are designed to represent the densest in the Universe. We also see that MS galaxies show a clear peak atMstars ≈ 1010.8M⊙below and above which galaxies display a decrease inλr50. This peak is also seen in the FIRE simulations (El-Badry et al. 2018). Passive galaxies also exhibit a peak but only in theHYDRANGEAsimulation, which may be due to poor statistics in the passive population in the Ref-L100N1504 simulation below that transition mass.
3.1 The fraction of slow rotators inEAGLE
Due to the availability of large IFS surveys, there has been a lot of recent interest in how the fraction of slow rotators depends on stellar mass and environment. Veale et al.(2017b),Brough et al.
(2017) andGreene et al.(2017) found that the fraction of slow rota-tors depends strongly on stellar mass, with a very weak dependence on environment once stellar mass is controlled for. The comple-mentarity ofEAGLEandHYDRANGEAin dynamical mass allows us to explore a very wide range of environments and hence to study this question.
9.5 10.0 10.5 11.0 11.5 12.0
log10(Mstars/MO •) 0.0
0.2 0.4 0.6 0.8 1.0
FSR Brough+17van de Sande+17 Combined E11+V17
Measurements at r50
cens Ref-L100N1504 cens Hydrangea BCGs Hydrangea sats Ref-L100N1504 sats Hydrangea
Figure 6.FSR, as defined by theCappellari(2016) classification, as a func-tion of stellar mass, for galaxies atz = 0in the Ref-L100N1504 (solid lines) andHYDRANGEA(dashed lines) simulations. Central and satellite galaxies are shown in blue and red, as labelled. For theHYDRANGEA sim-ulation we show separatelyFSRfor the brightest cluster galaxies as a solid symbol. The horizontal error bar in the latter shows the25th−75th per-centile range.
Fig.5shows the fraction of slow rotators,FSR, as a function of stellar mass atz= 0in the Ref-L100N1504 andHYDRANGEA
simulations, using the3definitions of slow rotators shown in Fig.3. The two simulations agree well atMstars . 1010.8M⊙ within the uncertainties, but there are some differences worth noting. Both simulations show that there is a clear transition atMstars ≈
1011M
⊙above whichFSR starts to raise quickly, except for the highest mass bin, in which we see a downturn. In the case of the Ref-L100N1504 simulation, this is due to applying the observa-tional classification of slow rotators without considering any errors. A small shift of0.05inλRin that classification leads to a mono-tonically risingFSR(dotted lines in Fig.5).HYDRANGEAdisplays a downturn at much larger masses, and we show in Fig.7that this is due to the properties of the brightest cluster galaxies (BCGs) in
HYDRANGEA. BCGs here are defined as the central galaxy of halos with masses>1014M
⊙. Because the HYDRANGEAsuite covers large regions around the24resimulated clusters (out to10 r200), there are in total 34 halos with those masses in the suite, and thus the same number of BCGs.
In Fig.5we also show a compilation of observations from the SAMI, ATLAS3Dand MASSIVE surveys. Both simulations agree remarkably well with the observations atMstars . 1011.2M⊙, with some tension arising atMstars & 1011.5M⊙. We show be-low that this is caused by unrealistic properties of our simulated BCGs. In our simulations,FSRdoes not rise above≈ 0.7in dis-agreement with the observations. We show later (Fig.7) thatFSRat Mstars&1011.2M⊙is very sensitive to environmental effects and a slightly different preference for satellites over central galaxies can significantly skewFSR.
galaxies having a larger FSR over the entire mass range com-pared to centrals (red vs. blue lines). However, when selecting only passive galaxies (Fig.7), centrals have a much largerFSR com-pared to satellites atMstars . 1011M⊙. This is expected as the quenching of central galaxies is typically accompanied by mor-phological transformation, while for satellite galaxies this is not necessary as they quench due to the environment they live in (e.g.
Trayford et al. 2016;Dubois et al. 2016). The differences between satellites and centrals at fixed stellar mass are significant. We per-formed Kolmogorov-Smirnov tests in narrow bins of stellar mass to quantify how different theλr50 distributions between these two populations are and found typicalpvalues<0.05.
Central galaxies in theHYDRANGEAsimulation show a de-crease inFSRin the highest mass bin. This decrease is significant and is driven by the contribution of BCGs (central galaxies of ha-los with masses>1014M
⊙). To make this clearer, we show sepa-ratelyFSRfor BCGs inHYDRANGEAas a filled symbol. Recently,
Oliva-Altamirano et al.(2017) analysed a sample of local Universe BCGs and found a large fraction of slow rotators, ≈ 50%, sig-nificantly larger than what we obtain inHYDRANGEA.Bah´e et al.
(2017) showed that BCGs inHYDRANGEAare too massive for their halo mass and have some remaining star formation that is higher than in observations. Several simulations have shown that contin-uing star formation can efficiently spin galaxies up (Moster et al. 2011;Naab et al. 2014;Lagos et al. 2017b;Penoyre et al. 2017), and thus it is not surprising that inHYDRANGEABCGs are mostly fast rotators. It is therefore likely that more efficient feedback at high redshift would not only lead to more realistic stellar masses and star formation rates of these BCGs, but also increase their slow rotator fraction (see alsoBarnes et al. 2017).
Fig.7also shows that satellite galaxies reach anFSR & 0.5 atMstars≈1011.5M⊙in better agreement with the observations. Since both surveys, ATLAS3Dand MASSIVE, are volume-limited, ≈42% of those are satellite galaxies,24% are brightest group/clus-ter galaxies, and the rest are field galaxies. Thus, it is not surprising that satellite galaxies better follow the results from MASSIVE. In the Ref-L100N1504 andHYDRANGEAsimulations there is a clear environmental effect that becomes apparent when comparing satel-lites and centrals at fixed stellar mass (Fig.6).
Recently Greene et al. (2017) found differences between satellite/central early-type galaxies in MaNGA of a similar mag-nitude to the one found in our simulations. Their observations are shown as shaded bands in Fig. 7. Greene et al. found that satel-lites are ≈ 20% more likely to be slow rotators than centrals. They, however, cautioned that due to the different spatial coverage and slightly different stellar mass distribution, this difference be-tween satellites and centrals is not obviously significant. InEAGLE
andHYDRANGEA, theFSRdifferences between these two popula-tions are present over the entire mass range, albeit with differences been very small atMstars < 1010.5M⊙. Note, however, that the Greene et al.(2017) slow rotator fraction is generally higher than both the Ref-L100N1504 and HYDRANGEAsimulations and the observations from ATLAS3D, SAMI and MASSIVE.
Greene et al. (2017) measured λR out to larger radii than ATLAS3D, SAMI and MASSIVE, and in addition they mea-sured ellipticities from a single S`ersic index fit to their images.
Greene et al.(2017) adapted the slow rotator classification criteria ofEmsellem et al.(2011) to work with their measurements, and ar-gued that about10% of their galaxies would change classification from slow to fast rotators if the measurements were done atr50. Nonetheless, the reportedFSR is higher by a factor of2at least compared to other IFS surveys; hence, there probably are other
9.5 10.0 10.5 11.0 11.5
log10(Mstars/MO •) 0.0
0.2 0.4 0.6 0.8 1.0
FSR
Measurements at r50
Hydrangea all cens cens δMS<0.1 all sats sats δMS<0.1 MaNGA sats MaNGA cens
Figure 7.The fraction of slow rotators obtained by applying theCappellari
(2016) classification to theHYDRANGEAsimulations, separating central and satellite galaxies. BCGs are not included in this figure. Dotted lines show all galaxies in the samples, while solid lines show the subsample of galaxies that have a SSFR relative to the MS60.1. The observations ofGreene et al.(2017) using MaNGA are shown as lines with shaded re-gions indicating the1σscatter. Note that the latter correspond exclusively to early-type galaxies.
systematic effects that have not yet been taken into account. Since these authors analysed only early-type galaxies, we also show in Fig.7theFSR−Mstarsrelation for passive galaxies (those with a δMS<0.1).FSRis higher for this subsample but not enough as to agree withGreene et al.(2017). Interestingly, in this subsample we find theFSRof centrals being2/3times larger than for satellites.
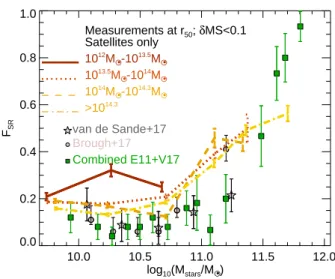
We explore the effect of environment onFSRfurther by study-ing the dependence on halo mass for centrals and satellite galaxies in Fig.8. Here, we combined the galaxy populations of the Ref-L100N1504 andHYDRANGEAsimulations atz= 0. The top panel of Fig.8 shows central galaxies. There is a trend of increasing FSRwith increasing halo mass, at fixed stellar mass. Since stel-lar and halo mass are well correlated for central galaxies inEAGLE
(Schaye et al. 2015;Guo et al. 2015), the overlap in stellar mass be-tween the different halo mass bins is only partial. We quantify the environmental dependence in the stellar mass range where overlap occurs: (i) atMstars= 1010.1−1010.8M⊙, centrals hosted by ha-los of masses1012.2M
⊙−1012.7M⊙are2times more likely to be slow rotators than centrals in halos of masses<1012.2M
⊙; (ii) at Mstars= 1010.8−1011.1M⊙centrals hosted by halos of masses
1012.7M
⊙−1014M⊙are≈35% more likely to be slow rotators than galaxies hosted by halos of masses1012.2M
⊙−1012.7M⊙. In Fig.8we show BCGs separately because their properties (i.e. overly massive and star-forming) lead to most of them being fast rotators.
In the bottom panel of Fig.8we show the effect of halo mass on the population of satellite galaxies. We see no evident effect of environment. However, when studying the subsample of pas-sive satellite galaxies (i.e. those withδMS < 0.1; see Eq.9for a definition) we see a strong environmental effect. This is shown in Fig.9. We find that among passive satellites,FSRincreases with decreasing halo massatMstars . 1011M⊙. At higher masses the statistics are too poor to draw any conclusion. At first glance this result is unexpected, as the overall trend of satellites plus
0.0 0.2 0.4 0.6 0.8 1.0
FSR
Measurements at r50
Centrals only <1012.2M
O
•
1012.2MO
•-10
12.7MO
• 1012.7M
O •-10
14M O • BCGs
Brough+17
van de Sande+17
Combined E11+V17
10.0 10.5 11.0 11.5 12.0
log10(Mstars/MO •) 0.0
0.2 0.4 0.6 0.8 1.0
FSR
Satellites only 1012
MO •-10 13.5
MO • 1013.5
MO •-10 14
MO • 1014
MO •-10
14.3 MO •
>1014.3
Figure 8.Top panel:FSRas a function of stellar mass for central galax-ies atz = 0in the combined galaxy sample of the Ref-L100N1504 and HYDRANGEAsimulations. Here we only show the slow rotator classifi-cation ofCappellari(2016). Central galaxies are shown in 4 bins of halo mass:<1012.2M
⊙(solid line),1012.2M⊙−1012.8M⊙(dotted line),
1012.8M
⊙−1014M⊙(dashed line) and>1014M⊙(filled circle; as in Fig.7). Error bars show1standard deviation calculated with10 jack-knife resamplings in each stellar mass bin. Observations are shown as sym-bols, as labelled.Bottom panel:as in the top panel but for satellite galax-ies. Here we adopt halo mass bins of:1012M
⊙−1013.5M⊙(solid line),
1013.5M
⊙−1014M⊙(dotted line),1014M⊙−1014.3M⊙(dashed line) and>1014.3M
⊙(dot-dashed line). There is a weak but significant sys-tematic effect ofFSRincreasing with increasing halo mass at fixed stellar mass for central galaxies, but this is only apparent atMstars&1011M⊙ in the case of satellites.
trals shows more slow rotators in denser environments. We inter-pret this trend as due to passive satellites in low density envi-ronments being quenched at the same time as they go through a morphological transformation (Trayford et al. 2015;Dubois et al. 2016). The satellite population we are studying here are relatively massive galaxies, Mstars > 1010M⊙, which are unlikely to be quenched solely by environment in halos of masses< 1013M
⊙. In more massive halos,Mhalo & 1014M⊙, galaxies can quench without morphological transformation, through e.g. ram pressure and/or tidal stripping. Thus, our simulations prediction that a trend with halo mass should be seen for satellite galaxies, but only in the subsample of passive satellites. Selecting passive centrals increases the overallFSR, but does not significantly change the halo mass effect we described above (not shown here).
Veale et al. (2017b) and Brough et al. (2017) recently con-cluded that the dependence ofFSR on environment is fully ac-counted for by the stellar mass of galaxies: more massive
galax-10.0 10.5 11.0 11.5 12.0
log10(Mstars/MO •) 0.0
0.2 0.4 0.6 0.8 1.0
FSR
Measurements at r50; δMS<0.1
Satellites only 1012
MO •-10 13.5
MO • 1013.5M
O •-1014MO • 1014
MO •-10
14.3 MO •
>1014.3
Brough+17
van de Sande+17
Combined E11+V17
Figure 9.As in the bottom panel of Fig8but for passive satellites (i.e. those
withδMS<0.1).
ies live in denser environments, and thus no environmental effects are seen at fixed stellar mass.Brough et al.(2017) focused exclu-sively on cluster environments, and thus their galaxy population was vastly dominated by satellite galaxies. As we showed here,EA
-GLEandHYDRANGEAshow that environmental effects (as mani-fested through a halo mass dependence) in the satellite galaxy pop-ulation are minimal, and even less obvious in the cluster popula-tion alone (see dashed and dot-dashed lines in the bottom panel of Fig.8). On the other hand, we predict that the halo mass effect on slow rotators should be detectable in the population of centrals and passive satellite galaxies, but only if a wide range of halo masses is explored,1011M
⊙).Mhalo.1015M⊙.
4 THE PHYSICAL ORIGIN OF SLOW ROTATORS
In this section we analyse the physical origin of slow rotators in two ways. First, we analyse the merger history of galaxies that atz= 0 are slow rotators to establish how correlated their lowλRis with the presence and type of mergers they suffered throughout their lives, if any. Second, we analyse the effect that individual merging events have onλR and ǫby comparing the kinematic properties of the main progenitors and merger remnants.Lagos et al.(2017a) anal-ysed the merger history of galaxies in the Ref-L100N1504 simula-tion, adding information on the cold gas masses of merging galax-ies, orientation of mergers, orbital angular momentum and mass ratios. We use this extended merger catalogue to study the con-nection between mergers and slow rotation. Thus, here we focus solely on the Ref-L100N1504 simulation. We classify mergers as dry (Rgas,merger 6 0.1), wet (Rgas,merger > 0.1), major (sec-ondary to primary stellar mass ratio,ms/mp > 0.3) and minor (0.16ms/mp<0.3; see§2.2).
10.0 10.5 11.0 11.5 12.0 log10(Mstars/MO •)
0.0 0.1 0.2 0.3 0.4 0.5 0.6 0.7
λr 50
no mergers
wet major wet minor
dry major dry minor
0.0 0.1 0.2 0.3 0.4 0.5 0.6 0.7
εr50
0.0 0.2 0.4 0.6 0.8
λr 50
Figure 10.λr50 as a function stellar mass (top panel) andǫr50 (bottom panel) for galaxies withMstars>5×10⁹M⊙in the Ref-L100N1504 sim-ulation atz= 0. Lines with error bars show the medians and25th−75th percentiles, respectively, for different samples of galaxies with different merger histories. The latter is shown only for bins with > 5 galaxies. The samples correspond to galaxies that have not experienced mergers (thick dotted line), and that experienced at least one minor wet (thin solid line), minor dry (thin dashed line), major wet (thick solid line) and ma-jor dry (thick dashed line) merger in the last10Gyr. In the case of mi-nor mergers we selected galaxies that did not have any major mergers in the last 10Gyr. Here the separation between wet and dry merger is at Rgas,merger= 0.1(see Eq.8for a definition). There is a clear connection between dry mergers (either major or minor) with slow rotation kinematics atMstellar>1010M⊙.
at least1major merger. This is done under the premise that major mergers have a more important effect on galaxy properties than mi-nor mergers. This is supported by our previous results (Lagos et al. 2017a). Our selection is based on the merger history of galaxies over the last10Gyr (i.e. approximately sincez= 2).
Fig.10shows the medianλr50as a function ofMstarsandǫr50 for galaxies atz= 0that haveMstars>5×10⁹M⊙, separated in
10.0 10.5 11.0 11.5
log10(Mstars/MO •)
0.0 0.2 0.4 0.6 0.8 1.0
Fraction of SR that went through mergers
all mergers
wet minor
wet major dry minor dry major
10.0 10.5 11.0 11.5
log10(Mstars/MO •)
0.0 0.2 0.4 0.6 0.8 1.0
Fraction of SR that went through mergers
cens
10.2 10.6 11.0
log10(Mstars/MO •) sats
Figure 11.Top panel:Fraction of slow rotators atz = 0in the Ref-L100N1504 simulation that suffered any type of mergers (thick solid line), and that have had at least one major dry (dotted line), major wet (thin solid line), minor dry (dashed line) or minor wet mergers (dor-dashed line), over the last10Gyr, as a function of theirz = 0stellar mass. We adopt the slow rotator classification ofCappellari (2016).Bottom panel:As in the top panel but split into central (left) and satellite (right) galaxies. Note that the x-axis in the panel of satellites spans a smaller dynamic range. This is because there are very few satellite galaxies with masses above1011M
⊙.
the5samples above, i.e. depending on their merger history. Here we do not distinguish between recent or far in the past mergers, but simply count their occurrence. We see a clear connection between the incidence of dry mergers (either major or minor) with slow rota-tion in galaxies withMstars>1010M⊙. On average, galaxies that went through dry major mergers have a lowerλr50than those that went through dry minor mergers. The remnants of wet major merg-ers also tend to have relatively lowλr50, but not enough to place them on the slow rotation class, though≈10% of the wet major merger sample are slow rotators. Galaxies that had wet minor
ers have slightly largerλr50at fixedǫr50than galaxies that have not had mergers, possibly reflecting the fact that the former are on aver-age a lot more gas rich (averaver-age neutral gas to stellar mass ratio of 19% compared to6% in the latter sample). InLagos et al.(2017b) we showed, also usingEAGLE, that continuous gas accretion and star formation efficiently spin up galaxies because the angular mo-mentum brought by newly accreted gas is expected to grow pro-portionally with time (Catelan & Theuns 1996). Regardless of this effect, we find that the parameter space ofλr50 &0.7andǫ&0.6 is almost exclusively occupied by galaxies that have not had any mergers.
The fact that wet minor mergers appear to only slightly af-fect galaxies agrees with the conclusions ofLagos et al.(2017a), in which it was shown that galaxies undergoing wet minor mergers have angular momentum radial profiles similar to galaxies that have not had mergers. The exception is the very centres of those galaxies, as the remnants of wet minor mergers tend to have slightly more massive bulges (see their Fig. 6). Although there is a clear trend between how galaxies populate theλr50−Mstarsandλr50−ǫr50 planes and their merger history, the scatter is large, suggesting that mergers result in a plethora of remnants with no unique outcome. Our results support the findings ofNaab et al.(2014) though with ≈50times more mergers, which allows us to disentangle preferred formation mechanisms.
To disentangle the formation paths of slow rotators inEAGLE, we focus on their merger history as a function of stellar mass. The top panel of Fig.11shows the fraction of slow rotators that went through the4merging scenarios described above (wet/dry minor mergers, wet/dry major mergers), as a function of stellar mass at
z = 0. We also show as black lines the fraction of slow rotators that had any form of merger withms/mp >0.1. We define slow rotators using theCappellari(2016) criterion.
At1010M
⊙.Mstars.5×1010M⊙,≈42% of slow rota-tors have not had any mergers. This percentage decreases system-atically with increasing stellar mass, and byMstars≈1011.5M⊙,
90% of the slow rotators had at least one merger during their past 10Gyr. Among the slow rotators that had mergers, the most com-mon type of merger is dry major merger, followed by minor merg-ers and wet major mergmerg-ers.
In the bottom panel of Fig.11we separate centrals and satel-lites. The prevalence of dry major mergers is more significant in central galaxies. Here, dry major mergers are twice more common in slow rotators than the other forms of mergers. For satellites we see that the different types of mergers have a similar incidence and dry minor or major mergers become only slightly more prevalent at
Mstars & 1010.5M⊙. This shows that the importance of mergers and their type for slow rotation may have an environmental depen-dence. Nevertheless, there is a clear connection between dry merg-ers and slow rotators, but we still need to establish whether there is a causal connection between the two. We come back to this in§4.1
where we analyse the effect of individual merger events onλRand ǫr50.
In Fig.12we show the history ofλr50of galaxies that atz= 0 are classified as slow rotators. For the latter we apply a simple cut ofλr50 6 0.1(Emsellem et al. 2007). To make the interpretation easier, we show the history ofλr50measured after orienting galax-ies edge-on (i.e.λr50takes its maximum value). We separate slow rotators that have only had minor mergers (top panel), and that have had major mergers (bottom panel). The latter could also have had minor mergers. In addition to minor and major mergers, we dis-tinguish between different numbers of mergers (either wet or dry), and also show separately the slow rotators that had dry mergers.
0.1 0.2 0.3 0.4 0.5 0.6 0.7
λr 50
(edge-on)
redshift
0 0.1 0.27 0.5 0.74 1.3 1.7
minor mergers
no mergers
=1 mergers
≥2 mergers
≥3 mergers
≥1 dry mergers
0 2 4 6 8 10
LBT/Gyr 0.1
0.2 0.3 0.4 0.5 0.6 0.7
λr 50
(edge-on)
major mergers
no mergers
=1 mergers
≥2 mergers
≥1 dry mergers
Figure 12.Top panel:Medianλr50 history of galaxies classified as slow rotators atz = 0that haveMstars > 1010M⊙in the Ref-L100N1504 simulation and that experienced only minor or no mergers. Hereλr50was measured orienting galaxies edge-on. We show the history of these galaxies split into5samples: (i) slow rotators that have not experienced a merger (solid line), (ii) slow rotators that experienced one merger (blue dashed line), (iii) at least two mergers (blue dotted line), (iv) at least 3 mergers (blue dot-dashed line), and (v) at least one dry merger (green dashed line), as labelled. In the case of samples (ii), (iii) and (iv) we do not distinguish by the gas fraction of the merger, while in the case of (v) we impose a merger gas to stellar mass ratio threshold of0.1(see Eq.8for a definition). For ref-erence, symbols show the median mass-weighted stellar age of the galaxies in each sample.Bottom panel:As in the top panel but for slow rotators that experienced major mergers. In this case the progenitors of these slow ro-tators could have also experienced minor mergers. Here we show samples (i), (ii), (iii) and (v) because major mergers are less frequent and thus, the sample of galaxies with>3major mergers is too small.
Symbols show the median mass-weighted stellar age of the galax-ies in the different samples. Slow rotators that have not experienced any minor or major mergers were born with lowλr50 values, and at a look-back time of8.5Gyr, which is roughly the median mass-weighted stellar age of all these galaxies, they haveλr50 at least twice smaller than the rest of the galaxies. This is driven by the en-vironments in which these galaxies formed. We come back to this in§4.2.
The top panel of Fig.12shows that there is a cumulative effect of minor mergers, in which galaxies could have started with a high
those slow rotators that only had one minor merger, started with relatively lowλr50. The subsample of slow rotators that has had at least one dry minor merger shows the most dramatic evolution ofλr50, again supporting our conclusion that dry mergers are most effective at producing slow rotators.Penoyre et al.(2017) recently analysed the Illustris simulation and concluded that they do not see a cumulative effect of minor mergers, in contradiction with the find-ings ofNaab et al.(2014) and our results here. Given how sensitive the outcome of mergers are to their gas fraction (see§4.1), one pos-sible explanation to the different findings is thatEAGLEproduces a different gas fraction evolution of galaxies compared to Illustris, impacting the effect mergers have on galaxies. However, because the nature of these simulations is complex, with many processes acting simultaneously at any one time, it is hard to conclusively say what drives the differences betweenEAGLEand Illustris.
The bottom panel of Fig.12shows that major mergers gen-erally have a stronger effect than minor mergers on the history of
λr50. This is clear when comparing the dashed lines between the top and bottom panels of Fig.12, where galaxies that went through one major merger started withλr50 ≈0.45, on average, while those that went through one minor merger started withλr50 ≈0.35, on average. Major mergers also display a cumulative effect, but given how much rarer they are compared to minor mergers (see Fig.2in
Lagos et al. 2017a), the significance of this is minimal for the entire galaxy population; i.e. there are only11galaxies in the entire sim-ulated volume that had>2major mergers in the last10Gyr. When selecting slow rotators that had at least one dry major merger, we see a much more drastic decrease inλr50. In§4.1we show that dry mergers are connected with the most significant decrease inλr50in individual merger events.
For both minor and major mergers, we see that slow rotators that went through dry mergers, experience a rapid decrease ofλr50 at look-back times . 6Gyr. This is due to the dry merger rate increasing rapidly after that epoch towardsz = 0. On the other hand, the total merger rate decreases smoothly, which explains why theλr50 evolutionary tracks of galaxies that suffered one or two mergers display a smoother decrease.
The fact that all the galaxies that atz = 0are slow rotators display an overall spin down throughout their lives even in the ab-sence of mergers, is probably connected to the evolution of the lo-cal environment in which galaxies and halos reside.Welker et al.
(2015) show that halos, as they move from high-vorticity regions in the cosmic web towards the filaments and nodes, start to be sub-ject to less and less coherent gas accretion. In the limit of nodes in the cosmic web, accretion happens a lot more isotropically than in the high-vorticity regions or filaments, with several filaments con-necting to the node from different directions. High-vorticity regions accrete gas from preferential directions, thus gaining more coher-ent angular momcoher-entum. The overall spin down we see in massive galaxies and halos (see§4.2) is most likely linked to the overall en-vironmental evolution. Fast rotators do not necessarily experience the same spin down because they tend to inhabit lower mass halos, which are less clustered.
4.1 The effect of individual merger events onλR
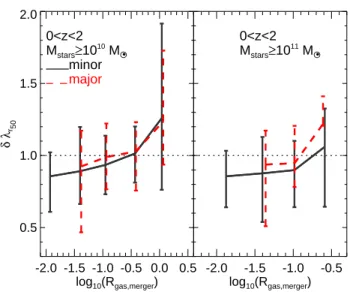
In order to determine the effect that individual mergers have on the rotation of galaxies, we take all the minor and major mergers that have primary galaxies withMstars > 1010M⊙fromz = 0 toz = 2, and compute the change in λR before and after the merger. Note that here we do not distinguish between descendants that are slow/fast rotators, but take all mergers. We then compare
-2.0 -1.5 -1.0 -0.5 0.0 0.5 log10(Rgas,merger) 0.5
1.0 1.5 2.0
δ
λr 50
0<z<2 Mstars≥1010
MO • minor
major
-2.0 -1.5 -1.0 -0.5
log10(Rgas,merger)
0<z<2 Mstars≥1011
MO •
Figure 13.Variation ofλrmeasured atr50as a function of the gas to stellar mass ratio of the merger (see Eq.8) separating minor and major mergers, as labelled. The left panel shows all the mergers that took place in galaxies withMstars > 1010M⊙at0 6 z 6 2, while the right panel shows the subsample of galaxies withMstars>1011M⊙. Lines with error bars show the median and25th−75thpercentile ranges. Only bins with>5 objects are shown. For reference, the dotted horizontal line shows no change inλr. Positive values indicate the merger remnant has a higher value ofλr than the progenitor.
λR between the main progenitor (the most massive) in the last snapshot the two merging galaxies were identified individually and the merger remnant. The latter corresponds to the first snapshot in which the two galaxies appear merged. Typically the timescale be-tween these snapshots is≈0.5Gyr. We define
δ λR= λR,rem λR,prog
, (10)
withλR,remandλR,progbeing the remnant’s and main progenitor’s λR, respectively.
Fig.13showsδ λr50 (measured atr50) as a function of the cold gas to stellar mass ratio of the merger,Rgas,merger (Eq.8). We show minor and major mergers separately. The right panel of Fig.13shows the subsample of galaxies withMstars>1011M⊙. There is a positive correlation between δ λr50 and Rgas,merger, which is of a similar magnitude between minor and major merg-ers. Galaxy mergers withRgas,merger & 0.5have a clear prefer-ence for increasingλR, while those withRgas,merger.0.07have a preference for decreasingλR. However, the scatter around the median relation is large, suggesting that the effect of a merger on
λRis not uniquely determined by its mass ratio and gas fraction.
Penoyre et al.(2017) found in Illustris that major mergers, regard-less of their gas fraction, are connected with the spinning down of galaxies, in contradiction with our findings. This may be due to their major mergers being mostly gas poor (gas-to-stellar mass ra-tios.0.1; see their Fig.13), thus, lacking the wet major mergers we obtain inEAGLEthat spin up galaxies efficiently.
Focusing specifically on dry mergers (Rgas,merger60.1), we find that in≈40% of the major mergersλRincreases, while for minor mergers this fraction is33%. The average increase inλRin these cases is≈30%. Selecting only massive galaxies inEAGLE
(right panel in Fig.13) does not change the correlation between
0.01 0.10
λDM
0.2 0.3 0.4 0.5 0.6 0.7
λr
r50 2r50
Figure 14.λRmeasured withinr50and2r50, as labelled, as a function of the dark matter haloλ(Eq.11) for central galaxies inEAGLEatz= 0 that haveMstars>1010M⊙. Lines with error bars show the median and 16th−84thpercentile ranges, respectively.
δ λr50 and Rgas,merger significantly. We analysed δ λ2r50 (mea-sured at2r50) and found a very similar relation to that shown in Fig.13. This suggests that mergers modifyλRin a similar fashion over a large radial range. It is clear that the high incidence of dry major mergers in the slow rotator population of Fig.11is due to these mergers having a detrimental effect onλR, on average.
We find that in the absence of mergers, galaxies display little change in theirλR,< 5%. This seems to contradict the result of
Choi & Yi(2017), who argued that most of the spin down of galax-ies is driven by environment and not mergers. This could be due to their study being performed exclusively on cluster regions, which represent an upper limit for the effect of environment.
We also studied the effect of mergers on the ellipticity,ǫ, of galaxies and found little effect (not shown here). Dry mergers have a tendency to increaseǫ, which, combined with the fact that they tend to decreaseλR, results in galaxies ending up more comfort-ably in the slow rotator zone in theλR−ǫplane. On the other hand, wet major mergers tend to decreaseǫ, thus making galaxies rounder. This is expected since wet mergers tend to increase the central stellar density of galaxies due to efficient gas fueling to the centre (e.g.Cox et al. 2006;Robertson et al. 2006;Johansson et al. 2009;Peirani et al. 2010;Moreno et al. 2015;Lagos et al. 2017a).
4.2 The connection between slow rotators and the halo spin parameters
Fig.11showed that about30% of the slow rotator population in the Ref-L100N1504 have not had any mergers. Fig.12showed that these slow rotators also had modestλr50in the past, smaller than theλr50values of the progenitors of slow rotators that experienced mergers. Here, we study the halos of these galaxies to understand why they are slow rotators.
We calculate the spin of halos,λDM, as inMo et al.(1998),
λDM=jh
(10H)1/3
√
2G2/3 M
−2/3
h (11)
wherejhandMhare the halo specific angular momentum and dark
0.01 0.10
0.0 0.2 0.4 0.6 0.8 1.0
normalized frequency
all galaxies λr50<0.1 λr50<0.1 & mergers
λr50<0.1 no mergers
0.01 0.10
λDM
0.0 0.2 0.4 0.6 0.8 1.0
normalized frequency
Progenitors at z=1
λr50<0.1 & mergers
λr50<0.1 no mergers
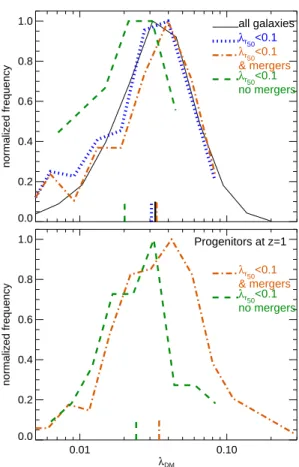
Figure 15.Top panel:The dark matter haloλfor central galaxies inEAGLE atz = 0that haveMstars >1010M⊙. Four subsamples are presented: all galaxies (solid line), those withλr50 < 0.1(dotted line), those with λr50 <0.1and that had at least 1 merger in the last10Gyr (dot-dashed line), and those with those withλr50 <0.1that have not had any mergere in the same period of time (dashed line).Bottom panel:As in the top panel but for the progenitor halos atz= 1of the two populations of slow rotators
atz = 0: (i) those that experienced mergers, and (ii) those that did not.
We find that the host halos of slow rotators that atz = 0have not yet experienced mergers, are biased towards low spins even atz= 1.
matterM200 mass2, respectively,Gis Newton’s gravity constant andH is the Hubble parameter. We calculatejhwith all the dark matter particles within a halo’sr200. We find a positive correla-tion between between the stellarλRandλDMin central galaxies (Fig.14), but with significant scatter. Interestingly, this scatter tends to decrease with increasing aperture within whichλRis measured. We now focus only on slow rotators to investigate the possi-ble connection with their host halo spin. The top panel of Fig.15
shows the distribution of halo dark matter spin parameters,λDM, of all central galaxies in the Ref-L100N1504 atz = 0that have stellar masses>1010M
⊙(solid line). In the top panel of Fig.15 we also show central galaxies withλr50 <0.1(dashed line), and the subsamples of these slow rotators that have had mergers (dot-dashed line) and had not had minor/major mergers ((dot-dashed line) over the last10Gyr. Slow rotators that have not had mergers dis-play aλDM distribution that is significantly shifted compared to the other3samples. Note that the medianλDM of galaxies with
0.00 0.05 0.10 0.15
FSR
≥1 mergers
no mergers
all galaxies 9.8<log10(Mstars/MO •)<10
0.00 0.05 0.10 0.15
FSR
10<log10(Mstars/MO •)<10.25
0.01 0.10
λDM 0.00
0.05 0.10 0.15 0.20
FSR
10.25<log10(Mstars/MO •)<10.7
Figure 16.The fraction of central galaxies that are slow rotators atz= 0 (defined as those withλr50 60.1) as a function of the halo spin parameter, λDM, in three bins of stellar mass of the central galaxy, as labelled in each panel. We show this for3samples: all central galaxies (solid line), and the subsamples that had at least1merger (dashed line) or no mergers (dotted line). Bins are chosen to have≈ 150galaxies. Error bars correspond to 1standard deviation calculated with10jackknife resamplings in individual mass bins. The horizontal and vertical line shows the fraction of slow rota-tors for all galaxies atz= 0in the stellar mass bins and their medianλDM. There is a clear tendency for lowλhalos to have a higher fraction of slow rotators.
λr50<0.1that have had mergers is very similar to the overall pop-ulation of central galaxies. The sample of centrals withλr50 <0.1 has a slightly smaller median, but that is caused by the contribution of centrals withλr50 <0.1that have not had mergers. The latter is clear when comparing the slow rotators that have had mergers to the overall galaxy population (dot-dashed and solid lines in the top panel of Fig.15). The medianλDMof slow rotators that have not experienced mergers is a factor of≈2smaller. This explains why they formed with lowλr50values: they formed and evolved in halos of low spins. On average, galaxies and their host halos grow their angular momentum together in a way that resembles weak conservation of angular momentum (Mo et al. 1998;Zavala et al. 2016;Lagos et al. 2017b), and so it is expected that low spin halos preferentially lead to the formation of galaxies with low spins.
The bottom panel of Fig.15shows the distribution of spin pa-rameters of thez= 1halos that contain the progenitors of the slow rotators atz= 0. This shows that the spins of the halos hosting the slow rotators that never had mergers were already low7Gyr ago, preventing the galaxies from reaching significantλR. Interestingly,
we see that on average the halos hosting these galaxies decrease theirλDM from≈ 0.025to0.02fromz = 1toz = 0, which may be the cause for the systematic spinning down displayed by the slow rotators that never had mergers (solid lines in Fig.12).
There is an overall weak positive correlation betweenλr50 andλDMfor central galaxies (Fig.14). However, when studying the incidence of slow rotators, a stronger correlation withλDM emerges. This is investigated in Fig.16for central galaxies in the Ref-L100N1504 simulation atz= 0in three bins of stellar mass. The averageFSRof all central galaxies is shown as the solid line, while the subsamples of galaxies that had mergers and those that did not have mergers are shown as dashed and dotted lines, respec-tively. The stellar mass bins were chosen to have>500galaxies in each of the three samples above.
The dependence ofFSRonλDMis close to monotonic with FSRdecreasing with increasingλDM. We find that galaxies that have had mergers atz <2have a higherFSRcompared to galaxies that have not had mergers at fixedλDM. The correlation is similarly tight for the different samples; i.e. jackknife errors are of a similar magnitude regardless of the merger history of galaxies. The top and middle panels of Fig.16shows that galaxies that have not had mergers and are hosted by halos of lowλDM, have aFSRthat is similar or higher than that of the overall galaxy population at that stellar mass. Our results show the importance of the halo spin in determining slow rotation in central galaxies.
5 DISCUSSION AND CONCLUSIONS
Recent observational results from IFS surveys have reached con-tradictory conclusions regarding the effect of environment on the frequency of slow rotators. The early work from ATLAS3D (Cappellari et al. 2011) concluded that the fraction of slow rota-tors increases steeply with stellar mass and towards denser environ-ments (Emsellem et al. 2011). However, recent surveys that sample much larger numbers of galaxies have concluded that there is only a very weak or no dependence on environment once stellar mass is controlled for (Brough et al. 2017;Veale et al. 2017b;Greene et al. 2017). Here we used theEAGLEandHYDRANGEAsimulations to explore this question and shed light onto the formation mechanisms of slow rotators.
We took special care in constructing IFS-like cubes for all of our simulated galaxies to measure the relevant quantities,λR andǫ, in a way that is more directly comparable to observations. We classify galaxies inEAGLEand HYDRANGEAthat have stel-lar masses > 5 ×10⁹M
⊙ into slow and fast rotators, using several observational criteria. We compare with the observations of Emsellem et al. (2011), Brough et al. (2017) and Veale et al.
(2017b) and find that our simulations reproduce the dependence of the fraction of slow rotators,FSR, on stellar mass relatively well. We showed that by applying small offsets to the observational clas-sifications we recover excellent agreement with the observations atMstars . 1011.5M⊙ (Fig. 5). At higher masses, we find a low frequency of slow rotators,≈ 20%, while observations point to a much higher fraction> 50% (Oliva-Altamirano et al. 2017;
Brough et al. 2017). This discrepancy is likely due to BCGs inEA
-GLEandHYDRANGEAbeing overly massive for their halo mass and have star formation rates that are higher than observations. Contin-uing star formation is very efficient at spinning up galaxies, result-ing in BCGs beresult-ing mostly fast rotators.
We explored the effect of environment in two ways: by sep-arating centrals and satellites, and by studying the effect of halo