Available online throug
ISSN 2229 – 5046
ANALYTICAL SOLUTIONS OF NON-LINEAR INITIAL VALUE PROBLEM
IN BIOCHEMICAL SCIENCES
D. Shanthi, M. Veeramuni and L. Rajendran*
Department of Mathematics, The Madura College, Madurai-625 011, Tamilnadu, India.
(Received on: 05-03-14; Revised & Accepted on: 18-03-14)
ABSTRACT
T
he initial value problem in biochemical enzyme mechanism is discussed. The approximate closed analytical expression of enzyme (E, E1, E2, and E3) concentrations of phenolic compound and H2O2complex are presented.Modified He’s Homotopy perturbation method (HPM) is used to give approximate and analytical solutions of non-linear reaction equations containing a non-non-linear term related to enzymatic reaction.
Keywords: Mathematical modeling; Horseradish peroxidase; 4-Aminoantipyrine; Immobilization; Biosensors; Kinetic
parameters; Modified HPM.
1. INTRODUCTION
Horseradish peroxidase (HRP) is an intensively used enzyme in biochemical and medical analyses. It is also proposed for waste water processing .A bioprocess monitoring method based on co-oxidation of phenol-4-sulfonic acid (PSA) and 4-aminoantipyrine (4-AAP) by immobilized HRP was recently described. Azevedo, et.al. [1] describe that Horseradish peroxidase (HRP) is one of the most extensively studied enzymes for historical reasons, but also because of its availability, relatively easy extraction and purification, and growing number of applications. A large family of HRP is oenzymes has been identified. HRP is a single chain polypeptide glycosilated at eight specific sites, containing two CaII ions, and one heme group (which contains the Fe-protoporphyrin IX) [2].Several methods have been proposed for the treatment of halogenated phenolic compounds such as biodegradation [3], electrochemical oxidation [4], resin adsorption [5], and peroxidase polymerization [6]. In the presence of hydrogen peroxide, peroxidases can be used for the removal of phenolic compounds by oxidizing them to phenoxyl radicals, which then react to create less soluble hydrophobic polymeric products. This approach has been applied to the decontamination of waste waters containingtoxic phenols, anilines, hydroxyquinoline, and arylaminecarcinogens such as benzidines and naphthylamines [7].
Vojinovi´c, et al. [8] describe a set of reactions that occur in phenol/4-AAP/HRP system upon addition of hydrogen peroxide has been used for the evaluation of the PSA/4-AAP/HRP system by estimating and comparing the apparent kinetic parameters for different reaction systems. The parameters thus obtained were compared for three phenolic compounds (phenol, p-chlorophenol and PSA) and for immobilized HRP in the PSA/4-AAP system. The model was able to capture distinctive features of the system, such as increasing initial reaction rates for increasing concentrations of H2O2; a plateau upon reactant exhaustion; and decreasing initial reaction rates at high H2O2 concentrations. The performance of the PSA/4-AAP/HRP system expressed as the initial reaction rate was found to be less than 12% that of the conventional phenol/4-AAP/HRP system.
Modeling of the system of HRP-catalysed reactions allows the prediction of the behaviour of the system in order to optimize conversion, shorten reaction times and avoid waste. It is also useful for studies of mechanistic behaviour of HRP systems. Steady state models were previously described [9, 10] that successfully predict initial reaction rates, but do not allow evaluation of non-rate limiting rate constants. The purpose of this communications of phenolic compound and H2O2 complex using modified new Homotopy method.
Corresponding author: L. Rajendran*
IJMA- 5(3), March-2014.
© 2014, IJMA. All Rights Reserved 151
2. MATHEMATICAL FORMULATION OF PROBLEM
The HRP\phenol\H2O2systems [11], can be represented by the following reaction equations:
R
E
R
E
1 1+
→
+
k (1)2 2 1
1
R
E
R
E
2
+
→
+
k (2)R
R
E
R
E
2 1 23
+
+
→
+
k (3)R
2
R
R
R
R
R
2
2+
3+
→
r 4+
1+
k
(4)
R
E
R
E
2+
1→
3+
app
k
(5)
6 5 3
E
R
R
E
→
a+
+
k (6)
R
R
E
R
E
3+
1→
1+
2+
b
k
(7)
where R=H2O2, R1=PhOH,R2=PhO●,R3=Am-NH2 , R4=•
O
−2 and R5=H+ . E, E1, E2 and E3are the enzyme. The model is derived from differential mass balances based on the set of reactions (1)–(7). Nicell and Wright have shown that the initial quantity of the native enzyme introduced in the assay will rapidly distribute among oxidation states, and that enzyme forms (E, E1, E2 and E3) can be considered to be in a pseudo-steady state [11]. A numerical simulation of time course of various enzymatic forms was undertaken (data not shown), in order to test the pseudo-steady state assumption for the concentration of the four HRP forms. The pseudo-steady-state assumption was thus considered valid. In the case of PSA, the steady state of the enzyme forms distribution is only achieved after 0.02 s, while the time course of the concentration of the chemical reactants is much slower. Therefore, as the time required for the system to assume steady state concentrations of the enzymatic forms can be neglected when compared to the time scale of the consumption of the reagents and formation of the product, the pseudo-steady-state assumption was considered acceptable. The balance equations for the enzyme reaction mechanism (Eqns. (1)–(7)) are given as follows:3 2
1 2
1
R
E
R
E
E
dE
a
k
k
k
dt
=
−
+
+
(8)3 1 1 1 2 1
1
R
E
R
E
R
E
dE
b
k
k
k
dt
=
−
+
(9)2 2 1 3 1 1 2
2
R
E
R
E
R
E
dE
app
k
k
k
dt
=
−
−
(10)3 1 3 2 3
E
R
E
E
R
dE
b aapp
k
k
k
dt
=
−
−
(11)The Initial conditions are
t=0; E=E0, E1=E10, E2=E20 and E3=E30 (12)
Time derivatives of phenolic compound and H2O2 concentrations are calculated from differential mass balances Eqns. (1)–(7):
2 3
1
1
R
E
R
R
R
R
E
dR
app
r
k
k
k
3 3 1 2 2 1 3 1 1 2 1
E
R
R
R
R
E
R
E
R
dR
b rk
k
k
k
dt
=
−
−
+
−
(14)3 3 1 2 2 1 3 1 1 2 2
E
R
R
R
R
2
E
R
E
R
dR
b rk
k
k
k
dt
=
+
−
+
(15)1 3 2 2
3
R
R
R
dR
r
k
dt
=
−
(16)1 3 2 2
R
R
R
dS
rk
dt
=
(17)The Initial conditions are
t=0; R=R0, R1=R10, R2 = R20, R3=R30 and S=S0 (18)
3. ANALYTICAL EXPRESSIONS FOR CONCENTRATIONS OF THE ENZYMES
Recently, many authors have applied the modified HPM to various problems and demonstrated the efficiency of the HPM for handling non-linear structures and solving various physics and engineering problems [12–17]. This method is a combination of Homotopy in topology and classic perturbation techniques. The modified HPM is unique in its applicability, accuracy and efficiency. The modified HPM uses the imbedding parameter p as a small parameter and only a few iterations are needed to search for an asymptotic solution. Using this method, we can obtain the following solution to Eqns.8-11 for the given boundary conditions (Eqn.12).
+
+
−
−
=
− 10 1 30 20 10 1 10 1 30 20 10 3 0 10
R
R
E
E
E
E
E
)
E(
1 0R
k
k
R
k
e
R
k
k
k
k
t
a kR t a(19)
+
+
−
−
=
− 10 2 30 10 0 0 1 10 2 30 10 0 0 1 10 2 10 1R
E
R
E
R
R
E
R
E
R
R
E
)
(
E
2 10k
k
k
e
k
k
k
k
t
b k R t b(20)
+
+
+
−
+
=
− + 0 10 3 10 20 2 ) ( 0 10 3 10 10 2 0 10 3 20 2R
R
E
R
R
R
E
R
)
R
R
(
E
)
(
E
3 10 0app t R k R k app app
k
k
k
e
k
k
k
k
k
t
app (21)
+
+
+
−
+
=
− + 10 20 0 ) R ( 10 20 0 10 30 3R
E
R
R
E
R
)
R
(
E
)
(
E
10 b a app t k k b a app b ak
k
k
e
k
k
k
k
k
t
a b(22)
4. ANALYTICAL EXPRESSIONS FOR CONCENTRATIONS OF PHENOLIC COMPOUND AND H2O2
In order to solve the initial value problem, Eqns. (8)-(12), we used the modified HPM [12-15]. As a result we have
Obtained
+
+
+
−
+
=
− + 2 1 0 2 20 30 ) E E ( 2 1 0 2 20 30 2 1 0E
E
R
R
R
E
E
R
R
R
)
E
E
(
R
)
R(
1 2app r t k k app r app
k
k
k
e
k
k
k
k
k
t
app (23)
+
+
+
+
+
−
+
+
=
− + + 3 2 3 1 2 0 2 20 30 ) E E E ( 3 2 3 1 2 0 2 20 30 3 2 3 1 2 10 1E
E
E
R
R
R
E
E
E
R
R
R
)
E
E
E
(
R
)
(
R
2 1 3 2 33IJMA- 5(3), March-2014.
© 2014, IJMA. All Rights Reserved 153
[
k
]
e
k
t
t
r k k kb t r0 2 20 30 )
E E E ( 10 0 2 20 30 30
3
(
)
R
R
R
R
R
(
1
)
2
R
R
R
R
=
+
−
− 2 1+ 3 2+ 33−
−
(25)
t
k
t
30 r 220 30 103
(
)
R
R
R
R
R
=
−
(26)t
k
t
)
S
0 rR
220R
30R
10(
S
=
+
(27)5. DISCUSSION
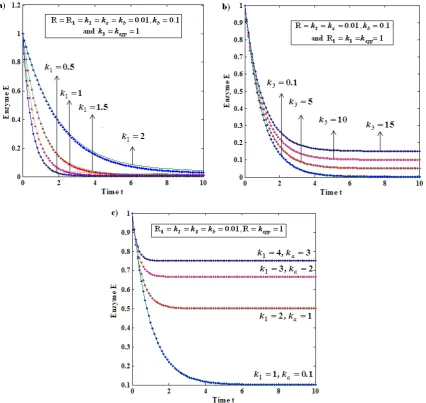
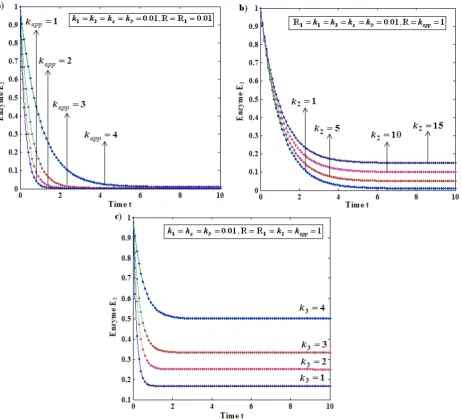
Eqns. (20)-(24) and Eqns. (25)-(26) are the new and simple analytical expressions of concentration of enzyme E, E1, E2 and E3, phenolic compound and H2O2 calculated using modified homotopy perturbation method. Figure (1)-(4), analytical expressions of concentration enzyme E, E1, E2 and E3 for various values of kinetic parameters
r b a
k
k
k
k
k
k
1,
2,
3,
,
,
andk
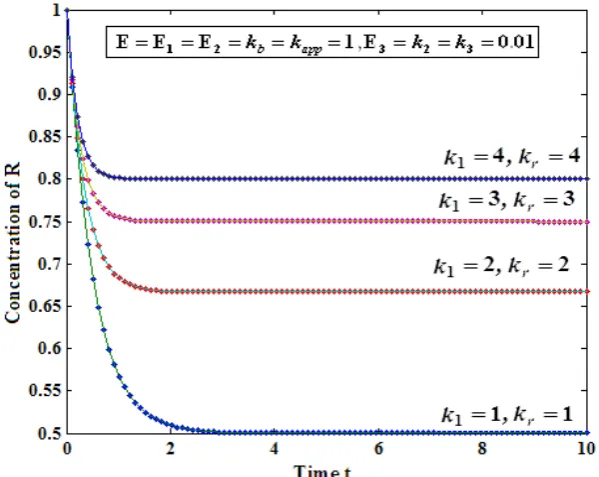
appversus time tare compared with numerical solution. From these figures, it is inferred that the value of the enzyme E, E1, E2 and E3 attains steady state value when t ≥ 4. Fig (5)-(6) indicates the concentration of phenolic compound and H2O2 using Eqns. (25) and (26) for various values of kinetic parameters. Upon careful evaluation of these figures, it is evident that concentrations is uniform when t ≥ 2.6. NUMERICAL SIMULATION
The non-linear differential equations in enzyme reaction mechanisms are solved by numerical method. To show that efficiency of the present method, our analytic result is compared with numerical solution in Figs.1-6 satisfactory agreement is noted. The Scilab/Matlab program is also give in Appendix A and Appendix B.
7. CONCLUSION
A nonlinear time dependent ordinary differential equation has been solved analytically and numerically. The primary result of this work is first appropriate calculation concentration of enzymeE, E1, E2 and E3, phenolic compound and H2O2 for all values of kinetic parameter. The modified homotopy perturbation method is extremely simple and promising method to solve other non-linear equations. This work can be easily extended to find the solution for other enzymatic mechanism in biochemical and medical systems.
Appendix A
Matlab / Scilab program to find the numerical solution of Eqns. (8) - (12)
function
options= odeset ('RelTol',1e-6,'Stats','on'); %initial conditions
Xo = [1;1;1;1]; tspan = [0,10]; tic
[t,X] = ode45(@TestFunction,tspan,Xo,options); toc
figure hold on plot(t, X(:,1),'-') plot(t, X(:,2),'-') plot(t, X(:,3),'-') plot(t, X(:,4),'-') legend('x1','x2','x3','x4') ylabel('x')
xlabel('t') return
function [dx_dt]= TestFunction(t,x)
R1=1; R2=1;k1=0.01;k2=1;k3=1;ka=0.01;kb=0.01;kapp=1; dx_dt(1) = -k1*R1*x(1)+k3*R2*x(3)+ka*x(4);
dx_dt(2) = k1*R1*x(1)-k2*R2*x(2)+kb*R2*x(4); dx_dt(3) = k2*R2*x(2)-(k3*R2+kapp*R1)*x(3); dx_dt(4) = kapp*R1*x(3)-(ka+(kb*R2))*x(4); dx_dt = dx_dt';
Appendix B
Matlab / Scilab program to find the numerical solution of Eqns. (13) - (18)
function
options= odeset ('RelTol',1e-6,'Stats','on'); %initial conditions
Xo = [1;1;1;1;1]; tspan = [0,1]; tic
[t,X] = ode45(@TestFunction,tspan,Xo,options); toc
figure hold on plot(t, X(:,1),'-') plot(t, X(:,2),'-') plot(t, X(:,3),'-') plot(t, X(:,4),'-') plot(t, X(:,5),'-')
legend('x1','x2','x3','x4','x5') ylabel('x')
xlabel('t') return
function [dx_dt]= TestFunction(t,x)
E=0.1;E1=0.1;E2=0.1;E3=1;k1=0.01;k2=1;k3=1;kr=0.01;kb=0.01;kapp=1; dx_dt(1) = -k1*E*x(1)-kr*x(1)*x(3)*x(3)*x(4)-kapp*E2*x(2);
dx_dt(2) = -k2*E1*x(2)-k3*E2*x(2)+kr*x(1)*x(3)*x(3)*x(4)-kb*E3*x(2); dx_dt(3) = k2*E1*x(2)+k3*E2*x(2)-2*kr*x(1)*x(3)*x(3)*x(4)+kb*E3*x(2); dx_dt(4) = -kr*x(1)*x(3)*x(3)*x(4);
dx_dt(5) = -kr*x(1)*x(3)*x(3)*x(4); dx_dt = dx_dt';
return
REFERENCES
[1] A.M. Azevedo, V.C.Martins, D.M.F.Prazeres, V.Vojinovi´c, J.M.S. Cabral, L.P. Fonseca, in: M.R. El-Gewely (Ed.), Biotechnology Annual Review, Elsevier Science, Amsterdam, 2003, pp. 199–247.
[2] H.B. Dunford, Heme Peroxidases, John Wiley & Sons, Inc., New York, 1999.
[3] J. Dolfing, J.E. Beurskens, The microbiologic and environmental significance of reductive dehalogenation, Adv. Microb. Ecol. 14 (1994) 143–160.
[4] C. Comninellis, C. Pulgarin, Anodic oxidation of phenol for waste water treatment, J. Appl. Electrochem. 21 (1991) 703–708.
[5] S.H. Lin, C.S. Wang, Treatment of high-strength phenolic wastewater by a new two-step method, J. Hazard. Mater. 90 (2002) 205–216.
[6] J.A. Nicell, J.K. Bewtra, K.E. Taylor, N. Biswas, C. St.Pierre, Enzyme catalyzed polymerization and precipitation of aromatic compounds from wastewater, Water Sci. Technol. 25 (1992) 157–164.
[7] A.M. Klibanov, B.N. Alberti, E.D. Morris, L.M. Felshin, Enzymatic removal of toxic phenols and anilines from wastewater, J. Appl. Biochem. 2 (1980) 414–421.
[8] V. Vojinovi´c, R.H. Carvalho, F. Lemos, J.M.S. Cabral, L.P. Fonseca, B.S. Ferreira, Kinetics of soluble and immobilized horseradish peroxidase-mediated oxidation of phenolic compounds, Bio. Eng. Journal 35 (2007) 126– 135.
[9] Y.J. Choi, H.J. Chae, E.Y. Kim, Steady state oxidation model by horseradish peroxidase for the estimation of the non-inactivation zone in the enzymatic removal of pentachlorophenol J. Biosci. Bioeng. 88 (1999) 368–373.
[10]J.A. Nicell, Kinetics of horseradish peroxidase-catalysed polymerization and precipitation of aqueous 4– chlorophenol, J. Chem. Technol. Biot. 60 (2) (1994) 203–215.
[11]J.A. Nicell, H. Wright, A model of peroxidase activity with inhibition by hydrogen peroxide, Enzyme Microb. Tech. 21 (1997) 302–310.
[12]Q.K. Ghori, M. Ahmed, A.M. Siddiqui, Application of Homotopy perturbation method to squeezing flow of a Newtonian fluid, Int. J. Nonlinear Sci. Numer. Simulat. 8 (2007)179.
[13]T. Ozis, A. Yildirim, A comparative study of He’s Homotopy perturbation method for determining frequency-amplitude relation of a nonlinear oscillator with discontinuities, Int. J. Nonlinear Sci. Numer. Simulat. 8(2007) 243-248.
IJMA- 5(3), March-2014.
© 2014, IJMA. All Rights Reserved 155 [15]M.M. Mousa, S.F. Ragab, Z. Naturforsch. Application of the Homotopy perturbation method to linear and
non-linear schrödinger equations, Zeitschrift für Naturforschung, 63 (2008) 140-144.
[16]J.H. He, Homotopy perturbation technique, Com Meth. Appl. Mech. Eng. 178 (1999) 257-262.
[17]J.H. He, Homotopy perturbation method: a new nonlinear analytical technique, Appl. Math.Comput.135 (2003) 73.
Fig. 2: Enzyme E1 versus time t is plotted using equation (20). (a) For various values of kinetic parameter
k
2. (b) Forvarious values of kinetic parameter
k
1. (c) For various values of kinetic parameterk
b.IJMA- 5(3), March-2014.
© 2014, IJMA. All Rights Reserved 157
Fig. 4:Enzyme E3 versus time t is plotted using equation (22). (a) For various values of kinetic parameter
k
b. (b) Forvarious values of kinetic parameter
k
a. (c) For various values of kinetic parameterk
aandk
b.Fig. 5(b): Plot of concentration R versus time t. The concentration was computed for various values of the kinetic parameter
k
app. The curves are plotted using equation (23). (—) denotes the analytical results and (●●●) denotes thenumerical simulations.
IJMA- 5(3), March-2014.
© 2014, IJMA. All Rights Reserved 159
Fig. 6(b): Plot of concentration R1 versus time t. The concentration was computed for various values of the kinetic parameter