MICROFLUIDIC SYSTEMS FOR ISOLATING AND ANALYZING CIRCULATING CANCER CELLS FROM THE PERIPHERAL BLOOD OF PATIENTS WITH EPITHELIAL CANCERS AND ACUTE MYELOID LEUKEMIA
Joshua Matthew Jackson
A dissertation submitted to the faculty at the University of North Carolina at Chapel Hill in partial fulfillment of the requirements for the degree of Doctor of Philosophy in the Department of Chemistry
(Analytical) in the College of Arts and Sciences
Chapel Hill 2015
© 2015
ABSTRACT
Joshua Matthew Jackson: Microfluidic Systems for Isolating and Analyzing Circulating Cancer Cells from the Peripheral Blood of Patients with Epithelial Cancers and Acute Myeloid Leukemia
(Under the direction of Steven A Soper)
Simple, effective, and minimally invasive methods for the routine screening of patients for cancer, the monitoring of treatment efficacy, and the early detection of relapse are needed to reduce the substantial burden cancer has on society. In this dissertation, we detail a microfluidic device that processes a patient’s peripheral blood in search for extremely rare cancer cells that are shed from the tumor. The technique uses cancer-specific antibodies to recognize and retain cancer cells within the device, which can be analyzed after purification to provide information to clinicians that can guide precision medicine.
I am filled with deep gratitude and respect for my parents, Deborah and James Jackson. They have provided me the tools with which to thrive in trying times. They have forever encouraged me to think deeply, to think freely, to see beyond the confines of concrete reality, and to refine abstractions to
their purest utility. Every work I have ever done and every art I have ever created is born directly from their hands. May these words mark but a moment of my timeless love.
To my partner, Allan Bunch. I remember a time, it seems like yesterday, when once intangible words scrawled themselves into the fabric of our lives. They remain as clear as the day they were written,
and today, every day, I read them. They stop me. They suspend the superfluous and expose the foundations that will persist beyond today, those on which we can stand tomorrow and the day after
that. Your contribution is simple. You have been there. Every day you have been there. And I could not wish for anything more.
ACKNOWLEDGEMENTS
TABLE OF CONTENTS
LIST OF PUBLICATIONS AND PATENTS ... xv
Publications ... xv
Patents ... xvi
LIST OF TABLES ... xvii
LIST OF FIGURES ... xviii
LIST OF ABBREVIATIONS ... xxix
CHAPTER 1. A CRITICAL REVIEW OF TECHNOLOGIES FOR THE ISOLATION AND ANALYSIS OF CIRCULATING TUMOR CELLS... 1
1.1 Circulating Tumors Cells (CTCs) – A Biological Context ... 1
1.2 Properties of CTCs Targeted for Isolation... 4
1.2.1 Biological Properties ... 6
1.2.2 Physical Properties... 7
1.3 Figures-of-Merit for CTC Technologies ... 8
1.3.1 How is Recovery Measured, and What Does It Mean? ... 9
1.3.2 Purity – A Very Important but Perplexing Metric ... 10
1.3.3 Throughput – How Much Blood is Really Necessary? ... 11
1.3.4 Establishing Clinical Specificity and Sensitivity ... 12
1.4 Magnetic CTC Isolation ... 17
1.4.3 MagSweeper – Improving Purity for Magnetic Isolation by Shear
Forces ... 23
1.4.4 CTC-iChip – Microfluidic Magnetic Separation ... 24
1.4.5 Ephesia – Magnetic Microbeads as a Microfluidic Solid Support ... 26
1.4.6 Magnetically Labeled CTCs – Sensing Rather than Separating... 27
1.5 Microfluidic Technologies for Positive-Affinity CTC Selection ... 28
1.5.1 Colliding CTCs with Ab-Coated Microposts ... 28
1.5.2 Chaotic Mixing to Propel CTCs towards Surfaces, and Nano-Texturing of Ab-Coated Surfaces... 32
1.5.3 Rolling CTCs along Sinusoidal Microchannels at High Shear ... 35
1.5.4 Mass Production of Affinity-Based Microfluidic Devices – Thermoplastics for CTC Analysis ... 37
1.5.5 In Vivo, Affinity-Based CTC Collection... 38
1.6 Microfluidic Catch and Release ... 40
1.6.1 Digest the Affinity Agent ... 41
1.6.2 Polymer Coatings for Severing the Entire Binding Complex from the Modified Microfluidic Surface... 43
1.7 Discriminating CTCs by Physical Properties ... 46
1.7.1 CTC Filtration – Size and Deformability... 46
1.7.2 Hydrodynamic Size Separation ... 51
1.7.3 Dielectrophoretic (DEP) Separations ... 54
1.8 Those That Don’t Fit the Biological/Physical Mold ... 55
1.8.1 Only the Invasive CTCs ... 55
1.8.2 Just Scan Everything – An Epic Task ... 58
1.10 Conclusions and Future Outlook ... 62
CHAPTER 2. THERMOPLASTIC REPLICATION, AND FLUID DYNAMICS OF CELL ISOLATION IN THE SINUSOIDAL MICROFLUIDIC DEVICE ... 64
2.1 Introduction ... 64
2.2 Production of in vitro Diagnostic Devices in Thermoplastics ... 66
2.3 Cell Selection in Sinusoidal Microchannels from a Fluid Dynamics Perspective ... 69
2.3.1 Centrifugal Forces in Sinusoidal Microchannels ... 71
2.3.2 Transient Dynamics of Cell-Ab Binding ... 76
2.3.3 Parallel Channel Arrays for High Throughput Sample Processing ... 80
2.4 Conclusions ... 88
CHAPTER 3. UV ACTIVATION OF POLYMERIC HIGH ASPECT RATIO MICROSTRUCTURES: RAMIFICIATIONS IN ANTIBODY SURFACE LOADING FOR CIRCULATING TUMOR CELL SELECTION ... 90
3.1 Introduction ... 90
3.2 Experimental Methods ... 93
3.2.1 Materials ... 93
3.2.2 Fabrication and Assembly of Microfluidic Chips ... 93
3.2.3 Water Contact Angle Measurements ... 94
3.2.4 Quantification of Carboxylic Acid Surface Densities ... 94
3.2.5 Spectroscopic Analyses ... 94
3.2.6 Conjugation Reactions and Fluorescence Imaging ... 95
3.2.7 Microfluidic Chips for CTC Selection ... 96
3.2.8 Patient Derived Xenografts (PDX) Models for Pancreatic Ductal Adenocarcinoma (PDAC) and Clinical Sample Processing ... 96
3.3 Results and Discussion ... 99
3.3.1 Assessing UV Activation Efficiency and Uniformity within Microfluidic Channels ... 101
3.3.2 Thermal Effects on UV-Activated Thermoplastics ... 104
3.3.3 ATR-FTIR, Raman, and XPS Analyses of Thermally Treated, UV-Activated Polymers. ... 106
3.3.4 Fluorescence Images of Immobilized Cy3-Labeled Oligonucleotides to UV Activated Thermoplastics ... 109
3.3.5 Polymer Choice and UV-Activation Scheme for Efficient CTC Clinical Recovery and Purity ... 110
3.4 Conclusions ... 115
CHAPTER 4. ENZYMATIC CLEAVAGE OF URACIL-CONTAINING SINGLE-STRANDED DNA LINKERS FOR THE EFFICIENT RELEASE OF AFFINITY-SELECTED CIRCULATING TUMOR CELLS ... 116
4.1 Introduction ... 116
4.2 Experimental Methods ... 118
4.2.1 Materials ... 118
4.2.2 Fabrication of the Cell Selection Device... 119
4.2.3 Operation of the Cell Selection Device ... 119
4.2.4 Heating System ... 120
4.2.5 Oligonucleotide Linker Sequences ... 120
4.2.6 Modification of the Cell Selection Chip with Oligonucleotide Linkers. ... 121
4.2.7 Cell Release ... 122
4.2.8 Clinical Samples ... 122
4.2.10 FISH Analysis of CMMCs Isolated from Clinical Samples ... 123
4.3 Results and Discussion ... 124
4.3.1 Validation of Linker Cleavage in a Bench Top Experiment ... 124
4.3.2 Linker Cleavage in a Microfluidic Device ... 125
4.3.3 Self-Referencing Method for Quantifying Cell Recovery ... 127
4.3.4 Cell Recovery using the Cleavable Linkers ... 129
4.3.5 Efficiency of Cell Release with the USER™ Enzyme System ... 130
4.3.6 Viability of Released Cells ... 132
4.3.7 The Efficiency of Immunostaining Cells while Bound to Microfluidic Surfaces ... 133
4.3.8 Releasing Clinical CTCs for Off-Chip Interrogation ... 135
4.4 Conclusions ... 137
CHAPTER 5. MICROFLUIDICS FOR THE LONGITUDINAL TRACKING OF MINIMAL RESIDUAL DISEASE IN THE PERIPHERAL BLOOD OF ACUTE MYELOID LEUKEMIA PATIENTS ... 138
5.1 Introduction ... 138
5.2 Experimental Methods ... 143
5.2.1 Materials ... 143
5.2.2 Cell Selection Device Fabrication ... 144
5.2.3 CD33, CD34, and CD117 Antigen Co-expression in AML Cell Lines ... 145
5.2.4 Processing Clinical Samples with the Cell Selection Device ... 145
5.2.5 Immunostaining, Cell Release, and Imaging... 146
5.3 Results and Discussion ... 147
5.3.1 Sample Processing. ... 147
5.3.3 Patient Characteristics ... 151
5.3.4 CLCs in Clinical Samples and Early Signs of Impending Relapse by Microfluidic MRD Surveillance ... 154
5.3.5 Shifts in CLC Subpopulations through Relapse. ... 160
5.4 Conclusions ... 162
CHAPTER 6. FUTURE DIRECTIONS ... 164
6.1 Introduction ... 164
6.2 Modular Microfluidic Systems for Integration Cell Isolation and Analysis ... 164
6.3 Paths to Commercialization ... 167
6.4 Injection Molding the Z-Configuration Cell Isolation Modules ... 169
6.5 Microvalving Systems for Automated CTC Analysis ... 170
6.6 Cell Enumeration and Viability Testing by Impedance Sensing ... 173
6.7 Microfluidic MFC for In-Line Immunophenotyping and Cell Sorting ... 174
6.8 Concluding Remarks ... 176
DERIVATION OF THE Z-CONFIGURATION GEOMETRY OPTIMIZATION STRATEGY AND APPLICATION AND VALIDATION FOR CONSTRUCTING HIGH POWER HYDROGEN FUEL CELLS ... 178
A2.1.1 Derivation of Z-Configuration Optimization Strategy ... 178
A2.1.2 Validation of the Optimization Strategy using Computational Fluid Dynamics Simulations ... 181
A2.1.3 Application and Validation for High Power Fuel Cells ... 182
CHANG-HAMMER MODEL – PARAMETERS AND FULL EXPRESSIONS ... 186
APPENDIX 3.1. UV-VISIBLE ABSORPTION SPECTRA OF THERMOPLASTIC SUBSTRATES ... 187
APPENDIX 3.2. CALIBRATION CURVE FOR TBO ASSAY ... 188
APPENDIX 3.4. ABLATION OF THERMOPLASTIC SURFACES DURING UV ACTIVATION ... 190
APPENDIX 3.5. AFM IMAGING OF THERMOPLASTIC SUBSTRATES THROUGHOUT ACTIVATION ... 191
APPENDIX 3.6. WATER CONTACT ANGLES OF DIFFERENT PMMA GRADES THROUGH ACTIVATION ... 192
APPENDIX 3.7. DECONVOLUTION OF X-RAY PHOTOELECTRON SPECTRA ... 194
APPENDIX 3.8. RAMAN SPECTROSCOPY OF ACTIVATED COC SUBSTRATES ... 198
APPENDIX 3.9. ANALYSIS OF UV-ACTIVATED AND THERMALLY TREATED PC SUBSTRATES ... 199
APPENDIX 4.1. CELL RECOVERIES USING THE CLEAVABLE LINKER SYSTEM ... 203
APPENDIX 4.2. RELEASE EFFICIENCY BY USER™ ENZYME DIGESTION OF THE CLEAVABLE LINKERS ... 204
APPENDIX 4.3. CELL CULTURE AFTER USER™ RELEASE ... 205
APPENDIX 4.4. FLOW CYTOMETRY RESULTS FOR THE RELEASED KG-1 CELL LINE ... 206
APPENDIX 4.5. CLINICAL CTC YIELDS FROM M-OVC PATIENTS USING CLEAVABLE LINKER ... 208
APPENDIX 5.1 LONG TERM SHELF-LIFE OF CELL ISOLATION DEVICES ... 209
APPENDIX 5.2 CLINICAL CHARACTERISTICS OF PTS #1-5 AT DIAGNOSIS AND TRANSPLANT. ... 210
APPENDIX 5.3 LAP PROFILES FOR PTS #1-5 AS DETERMINED BY MFC ANALYSIS... 211
APPENDIX 5.4 MFC OF AML CELL LINES... 213
APPENDIX 5.5 HEALTHY DONOR CELL COUNTS ... 215
APPENDIX 6.1 OPTICAL SCHEMATIC OF THE GRC MICROFLUIDIC MFC SYSTEM ... 216
LIST OF PUBLICATIONS AND PATENTS
Publications
1. J.W. Kamande, M.L. Hupert, H. Wang, M.A. Witek, U. Dharmasiri, S.K. Njoroge, R. Trophy, J.M. Jackson, R. Aufforth, A. Snavely, J.J. Yeh, and S.A. Soper. Modular microsystem for the isolation, enumeration, and phenotyping of circulating tumor cells: Managing patients with pancreatic cancer. Analytical Chemistry 85 (2013), 9092.
2. M.L. Hupert, J.M. Jackson, H. Wang, M.A. Witek, J.W. Kamande, M.I. Milowsky, Y.E. Whang, and S.A. Soper. Arrays of high-aspect ratio microchannels for high-throughput isolation of circulating tumor cells (CTCs). Microsystems Technologies 20 (2013), 1815.
3. J.M. Jackson, M.A. Witek, M.L. Hupert, C. Brady, S.R. Pullagurla, J. Kamande, R. Aufforth, C.J. Tignanelli, R.J. Torphy, J.J. Yeh, and S.A. Soper. UV activation of polymeric high aspect ratio microstructures: Ramifications in antibody surface loading for circulating tumor cell selection. Lab on a Chip 14 (2014), 106.
4. K.N. Battle, J.M. Jackson, M.A. Witek, M.L. Hupert, S.A. Hunsucker, P.M. Armistead, and S.A. Soper. Solid-phase extraction and purification of membrane proteins using a UV-modified PMMA microfluidic bioaffinity µSPE device. Analyst 139 (2014), 1355.
5. S.R. Pullagurla, M.A. Witek, J.M. Jackson, M.A. Lindell, M.L. Hupert, I.V. Nesterova, A.E. Baird, and S.A. Soper. Parallel affinity-based isolation of leukocyte subsets using microfluidics: Application for stroke diagnosis. Analytical Chemistry 86 (2014), 4058.
6. J.M. Jackson, M.L. Hupert, and S.A. Soper. Discrete geometry optimization for reducing flow non-uniformity, asymmetry, and parasitic minor loss pressure drops in Z-type configurations of fuel cells.
Journal of Power Sources 269 (2014), 274.
7. S.V. Nair, M.A. Witek, J.M. Jackson, M.A. Lindell, S.A. Hunsucker, T. Sapp, C.E. Perry, M.L. Hupert, V. Bae-Jump, P.A. Gehrig, W.Z. Wysham, P.A. Gehrig, P.M. Armistead, P. Voorhees, and S.A. Soper. Enzymatic cleavage of uracil-containing single-stranded DNA linkers for the efficient release of affinity-selected circulating tumor cells. Chemical Communications 51 (2015), 3266.
8. J.M. Jackson, M.A. Witek, M.L. Hupert, and S.A. Soper.Curved Microchannels with High Aspect Ratios for CTC Selection and Analysis in Circulating Tumor Cells: Isolation and Analysis. H. Fan, Ed.; Wiley Publishing (2015), In press.
10.M.L. Hupert, S.A. Soper, and J.M. Jackson. Discrete geometry optimization for reducing flow non-uniformity in U-type configurations of fuel cells. Journal of Power Sources (2015), Submitted for publication.
11.M.A. Witek, R.D. Aufforth, H. Wang, J.W. Kamande, J.M. Jackson, S.R. Pullagurla, M.L. Hupert, J. Usary, W.Z. Wysham, V. Bae-Jump, L.A. Carey, P.A. Gehrig, M.I. Milowsky, C.M. Perou, J.T. Soper, Y.E. Whang, J.J. Yeh, G. Martin, and S.A. Soper. Orthogonal subpopulations of circulating tumor cells: Clinical ramifications for managing cancer diseases. Science Translational Medicine (2015), Submitted for publication.
12.C.E. O’Neil, J.M. Jackson, S.H. Shim, and S.A. Soper. Characterizing surface functional group density for O2 plasma and UV/O3-activated thermoplastics using super-resolution microscopy. Analytical Chemistry (2015), Submitted for publication.
13.F.I. Uba, B. Hu, K.M. Weerakoon-Ratnayake, J.M. Jackson, N.J. Calixte, and S.A. Soper. Nanofluidic circuits for storage, shaping and manipulation of single molecules. Nano Letters (2015), In preparation.
14.J.M. Jackson and S.A. Soper. A critical review of technologies for the isolation and analysis of circulating tumor cells. (2016), In preparation.
Patents
1.Optimization of Z-type configurations of parallel systems for uniform flow distribution. United States Provisional Patent Application 61/944,762. UNC-Chapel Hill (2014).
2.Optimization of U-type parallel systems for uniform flow distribution. United States Provisional Patent Application 62/092,511. UNC-Chapel Hill (2015).
LIST OF TABLES
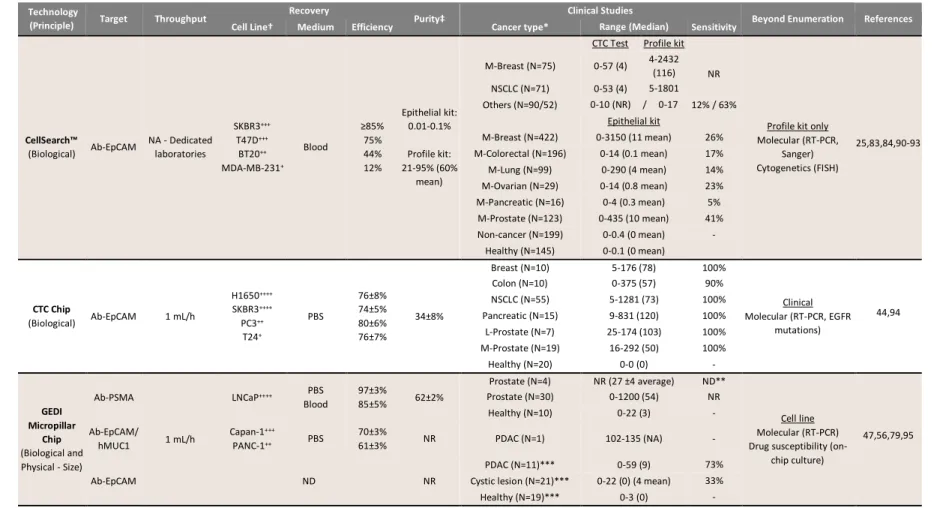
Table 1.1 Figures-of-merit for representative technologies that isolate CTCs by
biological and/or physical properties, results from clinical studies, and demonstrations
of CTC analysis beyond enumeration. ... 13 Table 1.2 The properties of materials that are generally used to manufacture CTC
selection devices, focusing on those that affect the rate and cost of production, assay
efficiency, CTC identification, and CTC viability. ... 37 Table 3.1 Surface characterization data for pristine, UV, and UV/thermal, planar
PMMA and COC substrates. ... 104 Table 4.1 Sequences of the ssDNA linkers investigated in this study. ... 121
Table 5.1 Patient characteristics for Pts #1-5. ... 152 Table 5.2 Heat maps are the percent change of the total count relative to the previous
sample. If MRD(+), the patient’s MRD burden was assigned using the quartiles of total CLC counts accumulated from all patients. MRD burden was assigned as low (<29 CLCs/mL), mid (≥29 and <90 CLCs/mL), high (≥90 and <405 CLCs/mL) and very high
LIST OF FIGURES
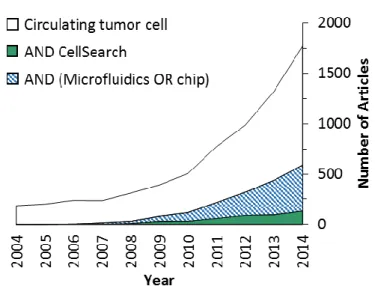
Figure 1.1 A Scopus survey of articles published from 2004 to 2014 that regard CTCs in general or specifically regard CellSearch or microfluidics. Scopus results were
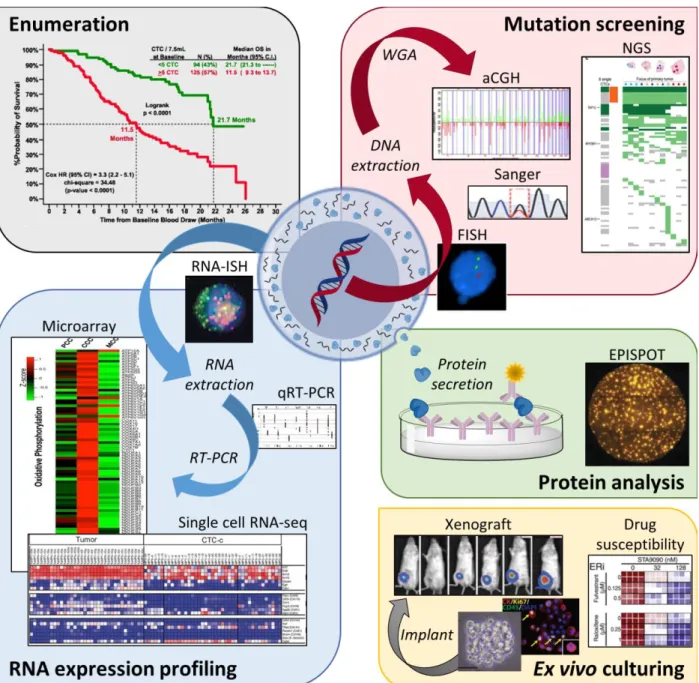
restricted to articles only and used the fields specified in the legend. ... 3 Figure 1.2 Applications for CTC analyses, including enumeration,34 genomic mutation
screening (FISH,30 Sanger sequencing,35 aCGH,36 and NGS)37, RNA expression profiling (RNA-ISH,27 qRT-PCR,38 expression microarrays,39 and single cell RNA-seq)40, protein analysis (EPISPOT)41, and ex vivo culturing (CTC expansion, xenograft models, and drug susceptibility)42. FISH (fluorescence in situ hybridization); WGA (whole genome
amplification); aCGH (array comparative genomic hybridization); NGS (next generation sequencing); RNA-ISH (fluorescence RNA in situ hybridization); qRT-PCR (quantitative reverse transcription polymerase chain reaction); EPISPOT (epithelial immunospot).
Adapted from Pantel and Speicher.43 ... 5 Figure 1.3 Magnetic CTC isolation technologies. (A) Workflow of the CellSearch™ CTC
Test versus the CellSearch™ Profile Kit along with a picture of the MAGNEST® magnetic chamber used to isolate magnetically-labeled CTCs. (B) Workflow of sample processing using the MagSweeper technology, where a sheathed magnetic rod sweeps through a blood sample to isolate magnetically-labeled CTCs.103 (C) Workflow and diagram of the iChip, here shown in positive selection mode. The blood is debulked; the remaining cells are focused; and magnetically labelled cells (CTCs in positive selection mode, WBCs in negative selection) are preferentially force into a separate outlet.86 (D) A diagram of the Ephesia microfluidic technology, which aligns anti-EpCAM magnetic microbeads into solid supports for CTC isolation that can be released by removing the
magnetic field.32,65 ... 18 Figure 1.4 Direct comparisons to the CellSearch™ CTC Test by (A) the CellSearch™
Profile Kit,83 (B) Epic CTC,60 (C) the posiChip,86 (D) the GEDI micropillar device,79 and (E) the Ephesia technology.65 Note that the GEDI device selected PSMA(+) CTCs, whereas the CTC Test targeted EpCAM(+) CTCs. Kirby, et al. noted that 60% (median) of CTCs were PSMA(+)/EpCAM(+), indicating the GEDI yields were roughly 10-fold greater than
by the CellSearch™ CTC Test.79 ... 20
Figure 1.5 (A) CTCs labeled with magnetic nanoparticles pass over a µHall sensor and induce a voltage linearly proportional to number of MNPs. (B) Sample stream (pink) focused over 8 staggered µHall sensors that compensate for variable CTC positions. (C)
Assembled µHall device.101 ... 27 Figure 1.6 Microfluidic technologies for the affinity selection of CTCs. (A) Assembly of
recovering cells >18 µm (blue dot) and minimizing WBC (yellow dot) interaction.56 (C) Picture a PDMS herringbone chip, which uses convective mixing to encourage CTCs to interact with Ab-coated surfaces.68 (D) A schematic of the silicon nanopillar chip, where a convective mixing chamber is attached to a silicon substrate that is etched to produce nanotexturing prior to Ab-functionalization.100 (E) Another nano-textured device, where standard polyurethane tubing is coated with naturally occurring halloysite nanotubes and adsorbed Abs and selectins.145 (F) The thermoplastic-based sinusoidal chip uses narrow, Ab-coated microchannels to isolate CTCs. CTC release enables off-chip enumeration and viability testing by impedance sensing and phenotyping in a microfluidic imaging module, which are combined in an integrated
microfluidic system.146 ... 29 Figure 1.7 (A) The CellCollector® guidewire is inserted into a patient’s cubital vein for
in vivo CTC recovery. (B) Functionalization of the gold-coated guidewire with a
hydrogel and anti-EpCAM Abs.173... 39 Figure 1.8 Strategies to release CTCs after microfluidic affinity selection. (A) Proteolytic
digestion of Ab-antigen complex.158 (B) Exonuclease digestion of DNA aptamers.176 (C) Uracil-specific enzymatic digestion of oligonucleotide linkers that anchor Abs to surface, which is presented in Chapter 4.30 (D) Thermally responsive polymer that internalizes the attached Abs when cooled.179 (E) Electrostatic assembly of nano-films containing biotinylated-alginate that can be enzymatically digested.73 (F) Gelatin nano-films assembled by avidin cross-linking that can be thermally melted or locally
dissociated by mechanically tapping with a microtip.35 ... 42
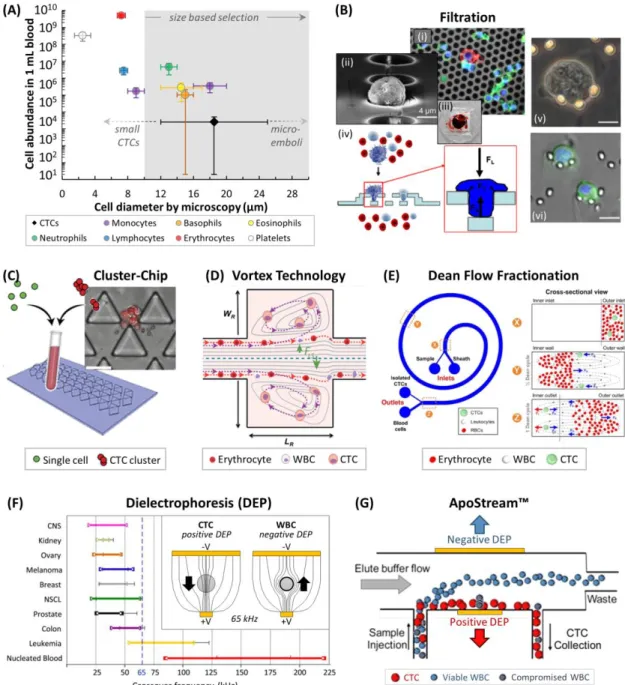
Figure 1.9 (A) Cell abundance versus cell diameter of blood cells26 and CTCs,83 and common size ranges for CTC discrimination.115,195 WBC sizes can be smaller in free solution than when plated for microscopy.62,63 (B) (i) A CK(+)/DAPI(+) CTC amongst CD45(+)/DAPI(+) WBCs on a silicon filter membrane.197 (ii) SEM of a fixed CTC on a parylene C membrane.198 (iii) Picture of a clogged filter after processing 7.5 mL of blood.199 (iv) Schematic of a 3D parylene C membrane.195 (v,vi) Images of CTCs trapped in a microfluidic filtration device.200 (C) The Cluster-Chip, a microfluidic chip for filtering CTC micro-emboli.57 (D) The Vortex Technology hydrodynamically traps large CTCs in side channels at high flow rates.63 (E) Dean Flow Fractionation, a hydrodynamic centrifugation method for size-dependent separation of CTCs.115 (F) Dielectrophoretic crossover frequencies for cancer cell lines, leukemia cell lines, and WBCs.201 (inset) Working principle of DEP, showing field lines for positive and negative DEP
experienced by CTCs and WBCs at 65 kHz, respectively.202 (G) Schematic of the
ApoStream™ technology for DEP-flow field fractionation of CTCs.69... 47
staining patterns were indicative of (A) epithelial, (B) mesenchymal, and (C) tumor
progenitor CTC phenotypes.107 ... 56
Figure 1.11 (A) Workflow for Epic CTC analysis. (B) Images of CTC types (traditional CTCs and CTC clusters) as well as small CTCs similar in size to WBCs, CK(-) CTCs that are possibly mesenchymal CTCs, and apoptotic CTCs characterized by nuclear
abnormalities such as fragmentation. DAPI, CK, and CD45 are false colored blue, red, and green, respectively.58 Inlaid into each image are the frequencies of each CTC type in 47 NSCLC samples,61 with each set of data scaled to the distribution of traditional
CTCs and CTC clusters in the central image and a red line marking the break in scale. ... 57 Figure 2.1 (Left) Schematics of the first generation, high-throughput CTC selection
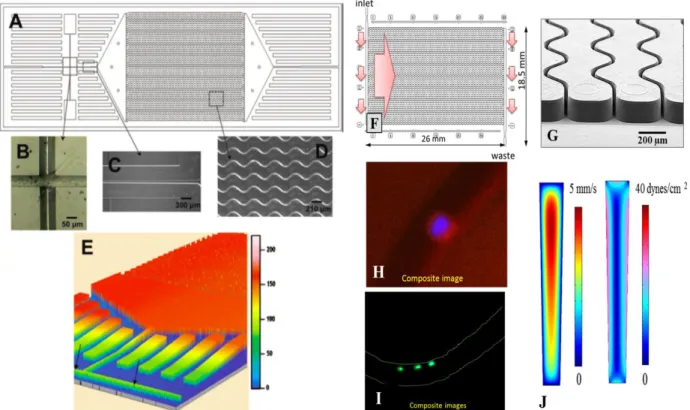
device showing: (A) A scaled AutoCAD diagram of the sinusoid capture channels with brightfield optical micrographs; (B) the integrated conductivity sensor consisting of cylindrical Pt electrodes that were 75 μm in diameter with a 50 μm gap; (C) single port exit where the device tapers from 100 μm wide to 50 μm while the depth tapers from 150 μm to 80 μm over a 2.5 mm region that ends 2.5 mm from the Pt electrodes; (D) micrograph taken at 5X magnification showing the sinusoidal cell capture channels; and (E) 3D projection of the topology of the device obtained at 2.5 μm resolution using noncontact optical profilometry (arrows indicate the Pt electrode conduits). (Right) Second generation sinusoidal device: (F) Schematic operation of the CTC selection module with 50 parallel, sinusoidal microchannels and inlet/outlet channels arranged in the Z-configuration. The large arrow indicates sample flow direction through the selection channels. (G) SEM of the selection bed showing high-aspect ratio (~25 μm × 150 µm, w × d) sinusoidal microchannels and the output channel. (H) Composite fluorescence images of a CTC stained with DAPI, CK8/19, and CD45. (I) Three WBCs staining positively for DAPI and CD45 and negatively for CD8/19. (J) Fluid dynamics simulation results showing the distribution of flow velocities and shear stress in
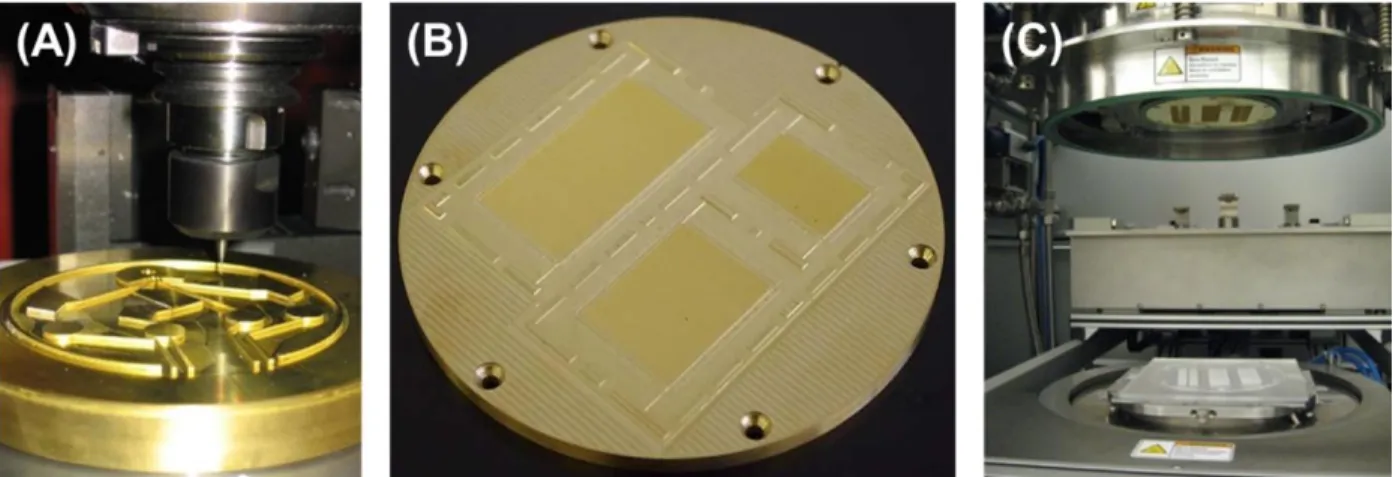
microfluidic selection channels. ... 65 Figure 2.2(A) High precision micromilling of a brass substrate using solid carbide bits
on the order of 500 to 50 µm or smaller in diameter. (B) A completed brass master mold that can be used for (C) repeated micro-replication by hot embossing the mold
master into a thermoplastic substrate. ... 67 Figure 2.3 SEMs of a CTC selection device in Figure 2.1F hot embossed into a COC
thermoplastic. (A) Low resolution SEM showing a series of sinusoidal, high aspect ratio channels. (B) High resolution SEM of one channel with the inset showing surface roughness due to milling. For reference, the marks left by the milling bit have an average roughness of 115 nm and mean peak height of 290 nm when measured vertically along the channel wall and 55 and 200 nm when measured horizontally, respectively, while the typical average roughness of the polymer used for embossing is <20 nm.25,60,61,99,115,239 (C) SEM of the channel prior to thermal fusion bonding of the cover plate. (D) SEM of a channel following thermal fusion bonding of the cover plate.
Figure 2.4 Recovery of 24 µm MCF-7 cells via anti-EpCAM monoclonal Abs in 35 µm and 50 µm wide channels that are either straight or sinusoid. In all configurations, optimal recovery occurs at 2 mm/s linear velocity. Recovery increased by ~30% due to decreasing channel width and increased by ~20% due to channel curvature. This figure
was reproduced with permission from Adams, et al.158 ... 70 Figure 2.5 Three-dimensional computational fluid dynamics simulations conducted on
blood flow through the sinusoidal cell isolation channel utilizing the Carreau
model240,241 for blood’s non-Newtonian viscosity. Shown are: (A) Longitudinal velocity profile of blood flow; (B) cross sectional velocity streamlines of weak Dean flow on the order of 0.1 µm/s; (C) cross sectional centrifugal forces acting on a 16 µm CTC due to the channel’s radius of curvature, where positive forces act from left to right as shown by the force vector; (D) cross section of non-Newtonian viscosity profile generating fluidic drag that opposes the centrifugal forces; and (E) cross sectional centrifugal velocities obtained by balancing centrifugal and drag forces, where positive velocity is a left-to-right motion as shown by the velocity vector. Note that negative centrifugal
velocities in (E) are due to the velocity streamlines in (B)... 71
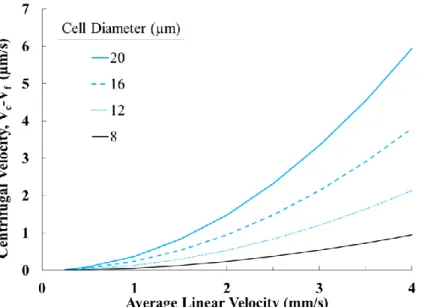
Figure 2.6 The maximum centrifugal velocity (Eq. 2.4) experienced by a CTC traversing through sinusoidal microfluidic channels. 𝑉𝑐 is critical to force CTCs out of laminar streamlines and towards microchannel surfaces and scales with the CTC’s size and the
fluid’s forward linear velocity squared. ... 73 Figure 2.7 Schematic of the Chang-Hammer model describing (A) a cell rolling along a
surface coated with recognition elements such as Abs. (B) The probability of cell adherence is governed by the relative motion of the cell’s antigens with the surface
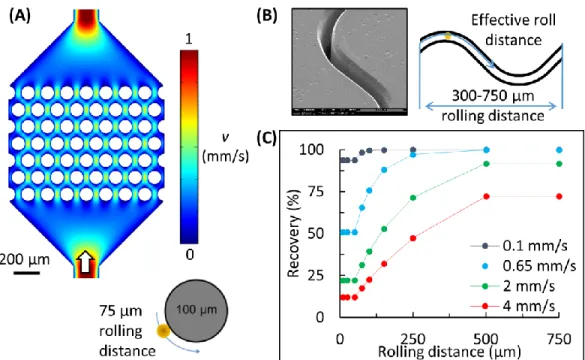
elements. ... 75 Figure 2.8 (A) Schematic of flow fields generated in a micropillar device (0.65 mm/s)
and a close-up of a pillar with a maximal roll distance of 75 µm. (B) An SEM of the high-aspect ratio sinusoid channel (2 mm/s) with a period of 750 µm, 125 µm radius of curvature, and an effective roll distance of >300 µm. (C) The recovery of CTCs (EpCAM expression = 49,700 molecules/cell) for different roll lengths and translational
velocities according to the Chang-Hammer kinetic model. ... 78
Figure 2.9 Recovery of the MCF-7 CTC surrogates (cell line), which expresses high levels of EpCAM and is commonly used to assess recovery, versus clinical CTCs that vary significantly in EpCAM expression. Cell recoveries were determined by the Chang-Hammer model assuming a cell size of 16 µm, a 100 µm rolling distance, and various
translational velocities. ... 79 Figure 2.10 Time to process 7.5 mL of blood as a function of microchannel depth and
channel number for a channel width of 25 µm and a linear flow velocity of 2 mm/s. AR
Figure 2.11 Comparison of different inlet/outlet geometries for a CTC selection device. (A) Results of computer simulations for the distribution of flow velocities within the CTC isolation bed with 50 microchannels arranged in the Z-configuration or 51 microchannels with triangular inlets and outlets. Pictures of devices filled with blood
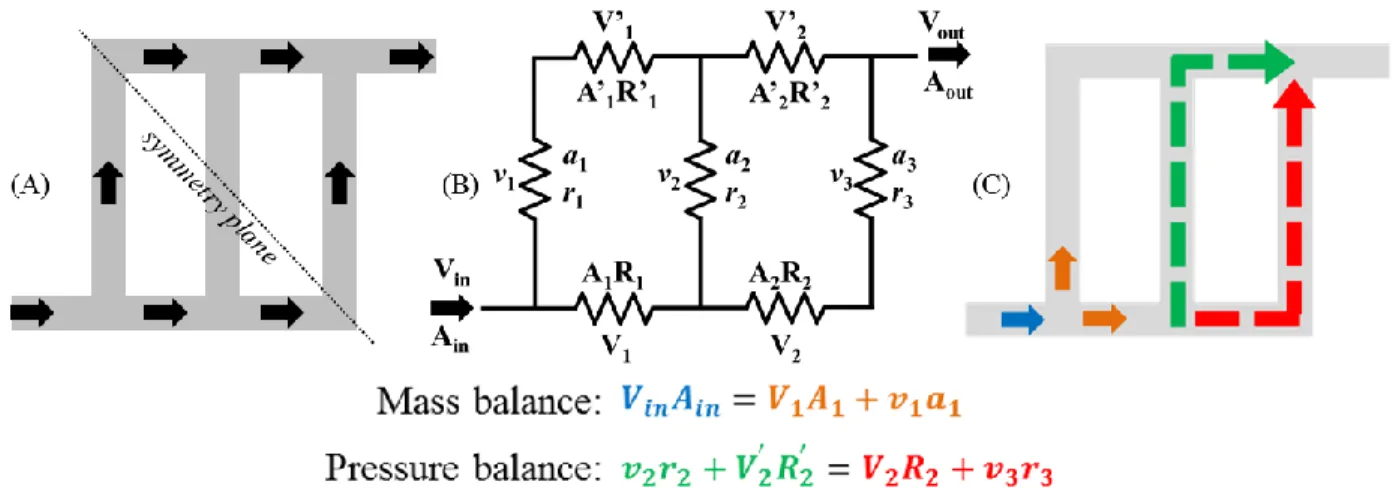
for (B) the triangular configuration and (C) the Z-configuration. ... 81 Figure 2.12 (A) Schematic diagram and (B) electrical representation of a
Z-configuration network with three parallel channels. (C) Color-coded illustration of mass and pressure balance equations in the fluid network. In (A), grey regions
represent fluidic channels, and black arrows represent the direction of flow ... 82 Figure 2.13. (A) Various stages of filling of a 320-channel Z-configuration device (20
mm long parallel channels) with a dye solution. (B) Numerical simulation results showing the distribution of flow velocities for different configurations of the CTC selection beds arranged in a Z-configuration. (C) Average linear velocities of fluid in 16 groups of 20 adjacent sinusoidal, high aspect ratio microchannels based on the results in Figure 2.13A (filled bars) and theoretical values obtained via the network analysis
model (empty bars). (D) Distribution of cells selected in 20 mm long microchannels. ... 86
Figure 2.14 (Left) AutoCAD renderings of Z-configuration cell isolation units with 250 parallel channels that utilize straight and tapered inlet and outlet channels. The Z-configuration with tapered inlets and outlets offers (top right) constant linear velocity throughout the parallel array and (bottom right) controlled shear stress throughout
the tapered inlet and outlet channels to ensure mechanical stability of the CTCs. ... 88 Figure 3.1Meshed geometry for CFD simulation of curvilinear channels with
trapezoidal cross sections after hot-embossing and stringent annealing. Each mesh
contains >1,600,000 elements (shown on the geometries’ surfaces as a black grid). ... 98 Figure 3.2Carboxy surface densities determined by collecting TBO solution from
UV-modified and thermal fusion bonded PMMA and COC microchannels with several
different aspect ratios. Zero aspect ratio indicated UV/thermal, planar substrates. ... 101 Figure 3.3 (A) Curvilinear channels (30 x 80 µm, w x d) were cut along their length to
expose Cy3-labeled oligonucleotides immobilized along sidewalls. 5X fluorescence images of controls and Cy3-labeled oligonucleotides are shown for (B,C) PMMA and (D,E) COC, respectively. 20X fluorescence images for (F) PMMA and (G) COC are presented along with (H) line plots as indicated by the thick, dotted lines. Controls were Cy3-labeled oligonucleotides immobilized without the EDC coupling agent and measure non-specific adsorption and autofluorescence. Only control images are scaled to the same intensity as their counterparts. All other fluorescence images are not
Figure 3.4 (A,B) Carbonyl regions of the ATR-FTIR spectra, (C,D) hydroxyl regions of the same spectra, and (E,F) C 1s XP spectra for PMMA and COC, respectively. Shown are spectra for pristine substrates (solid grey lines), UV-activated (dotted black lines), and UV/thermal (solid black lines) surfaces. General peak positions are labeled on the XP spectra corresponding to deconvoluted functional groups, where R generically represents carbon or hydrogen. See Appendix 3.7 for detailed XPS deconvolution
methods. ... 107 Figure 3.5Images of Cy3-labeled oligonucleotides immobilized on UV and UV/thermal
planar substrates for (A,B) PMMA and (C,D) COC, respectively. (E,F) NL493-streptavidin was immobilized on UV and UV/thermal COC, respectively. Images of Cy3-labeled oligonucleotides immobilized within UV-modified and thermal fusion bonded (G) PMMA and (H) COC microchannels. All fluorescence images of Cy3-labeled
oligonucleotides are scaled to same intensity. NL493-streptavidin images are scaled
independently. ... 109 Figure 3.6 (A) Schematic operation of the CTC selection module with 50 parallel,
sinusoidal microchannels and inlet/outlet channels arranged in the z-configuration. The large arrow indicates sample flow direction through the selection channels. (B) SEM of the selection bed showing high-aspect ratio (30 x 150 µm, w x d) sinusoidal microchannels and the output channel. (C) Composite fluorescence images of a CTC stained with DAPI(+), CK8/19(+), and not with CD45(-). (D) Four WBCs staining positively for DAPI(+) and CD45(+) and negatively for CD8/19(-). (E) Fluid dynamics simulation results showing the distribution of flow velocities and shear stress in
microfluidic selection channels. ... 111 Figure 3.7 Box plots presenting count of CTCs and WBCs selected in UV-PMMA (5 PDX)
and UV-COC (4 PDX) chip from mice blood samples. Data are normalized to 1 mL. Lower and upper edge of box shows 25th and 75th percentiles, respectively. Solid line in box represents median, and solid diamond represents mean. Error bars show
maximum and minimum values. ... 113
Figure 4.1 Cell selection and release assay. (A) mAbs immobilized to surfaces using oligonucleotide linkers containing a uracil residue are used for the positive selection of target cells. (B) Incubation of the selected cells and ssDNA linker with the USER™ enzyme system. (C) Removal of the uracil residue results in release of the selected
cells. ... 117 Figure 4.2 Schematic of mAb immobilization onto UV/O3-activated COC thermoplastic
substrate using cleavable ssDNA linkers. While a COC substrate is shown here, any surface containing functional groups can be used for the ssDNA linker attachment with
following sequence: 5’- NH2-C6-T8 U T6 CCG ACA CTT ACG T8 Cy5-3‘. The red traces
represent the separation of standards (20 nt and 80 nt shown). ... 125
Figure 4.4 Fluorescence images of sinusoidal microchannels (A) before and (B) after 15 min enzymatic cleavage of a 3’-Cy3 modified 25 nt oligonucleotide containing a dU residue. The microchannel surfaces were activated using UV/O3 exposure and functionalized with 20 mg/mL EDC and 2 mg/mL NHS in 0.1 M MES (pH 4.8). After 20 min of the EDC/NHS reaction, a 40 μM solution containing the 3’-Cy3 oligonucleotide was infused into the device. Before imaging, the device was rinsed with 0.1% SDS and
nuclease-free water... 126 Figure 4.5Accuracy of the self-referencing method for determining recovery of target
cells from samples in which the expression level of the target would be highly variable and the input cell number is unknown or variable. Multiple devices in series deplete the sample of the target cells, allowing for quantification of the cell recovery.
Over-estimation of recovery is minimized as more devices are used in the series. ... 128 Figure 4.6 (A) Release efficiency of viable and fixed KG-1 cells isolated with the 20dT
and 40dT linkers as a function of incubation time with USER™ enzyme. (B) Comparison of the efficiency and rapidity of the USER™ enzymatic release process for the three cell
lines isolated with 40dX linkers and released in a viable state. ... 130 Figure 4.7 Release of KG-1 cells isolated using the 40dT linker. Cells stained with (A)
Live/Dead™ kit were released after (B) 15 min and (C) 30 min USER™ incubation. (D) Cells (eluted at 10 μL/min) were enumerated. Live cells generate esterase-dependent Calcein, fluorescing green (ex/em 488/515 nm). Dead cells were susceptible to a
cell-impermeable, DNA-intercalating dye fluorescing red (ex/em 570 nm/605 nm). ... 131 Figure 4.8 Fluorescence images used to quantify cell viability (A, B) after isolation and
(C-E) after release. Images C-E share the same scale bar. ... 132 Figure 4.9 Flow cytometry analysis of KG-1 cells isolated, stained, and released from
the cell selection device... 133 Figure 4.10 (A) Composite image of a 7 mm diameter well with DAPI-stained EpCAM+
CTCs isolated from a M-OVC patient. (B) Close-up image of a smaller area of the well.
(C-E) Fluorescence images of CTCs stained with DAPI, CK-TR, and CD45. ... 134
Figure 4.11 (A) DIC and fluorescence images of M-OVC CTCs isolated using anti-EpCAM antibodies and released into a titer well. (B-C) EpCAM+ CTCs were stained with
LIVE/DEAD kit after release for viability determinations, (B) is green fluorescence signal for viable cells and (C) is red fluorescence signal from ethidium homodimer-1 in dead
Figure 4.12 FISH images with a 13q14 probe of patient CMMCs. Green signal indicates the presence of chromosome 13 and red signal indicates absence of the chromosome 13 deletion. The patient sample contained a mixture of CMMCs: (A) Cell shows the presence of the deletion and (B) polyploidy cell without the deletion. Cells were
isolated using an anti-CD138 modified chip. ... 136 Figure 5.1 (A) Whole blood is processed through three microfluidic devices modified
with mAbs specific for CD33 (red), CD34 (yellow), and CD117 (blue) expressing cells. Arrows indicate direction of blood flow through the device. (B) SEMs of the sinusoidal channel array (50 channels in the array) and the entrance of the single channel that addresses all sinusoidal channels. mAb-coated surfaces were false-colored red to represent an anti-CD33 mAb device. (C) Schematic of the affinity isolation assay. Antigen expressing cells (here CD33(+) cells used as an example) bind to surface-tethered mAbs and are retained in the device while other blood components are passed through the device. Selected cells are then immunostained against CD45 and the aberrant marker (e.g., with anti-CD7 or anti-CD56 fluorescent mAbs), followed by fixation and nuclear staining. (D) Selected cells are released from the capture surface and carried hydrodynamically into flat-bottomed wells, where the cells are imaged by semi-automated fluorescence microscopy. CLCs are identified by positive aberrant staining (aberrant(+)) and positive CD45 and DAPI staining, whereas other blood
components only show CD45 and DAPI staining (aberrant(-)). ... 142 Figure 5.2 Immunophenotyping of aberrant(+) CLCs and aberrant(-) cells isolated by
targeting (A,B) CD33, (C,D) CD34, and (E,F) CD117, respectively. All cells were
DAPI(+)/CD45(+) and positive for at least one of the isolation markers (CD33, CD34, or CD117). All images were taken from Pt #1 (CD7 aberrant marker) 85 days post-SCT. The cells in this panel were stained using DAPI (nucleus), and mAbs directed against
CD7 (FITC), CD45 (Cy5) and finally, the selection marker (CD33, CD34, CD117; Cy3). ... 148 Figure 5.3 (A) FITC fluorescence, (B) brightfield, and (C) overlay images of calibration
beads with different antigen binding capacity levels (see (C) annotations for the approximate load of the fluorescent antibodies per bead). Image contrast settings were selected to highlight low intensity fluorescence; brightly fluorescent beads were not saturating the CCD. FITC exposure times were identical to those used for CLC
identification. ... 149 Figure 5.4 (A-C) Microfluidic monitoring of Pt #1 from 28 to 85 days post-SCT. (A) Total
stained peripheral blood smear from day 85, which showed two blasts with open chromatin and weak intensity from the cytoplasm (magnification was 100x). PB =
Peripheral Blood; NA = not applicable... 156 Figure 5.5 CLC counts and aberrant(-) cells for (A,B) Pt #2, (C,D) Pt #3, (E,F) Pt #4 and
(G,H) Pt #5. Cell counts are color coded according to the targeted marker used for CLC selection. Results from FISH, PCR, blood smear and MFC MRD diagnostics, which used bone marrow biopsies unless noted otherwise, and the time frames for antiviral therapy are shown in the figures. Linear connections between events are for
visualization purposes only ... 157 Figure 5.6 Fluorescence images of the cells isolated using the anti-CD33 device for Pt
#2’s day 84 sample. Particle analysis of the DAPI image indicated the well contained 89,492 cells, which showed high agreement with CD45-Cy5 staining. This cell count is likely to be an under-approximation of the true cell count due to imperfect particle analysis. The entire well was scanned to identify CLCs that expressed the CD7-FITC aberrant marker, 99 of which were identified. (A,B) DAPI and CD45-Cy5 fluorescence images. These images were stitched from 225 individual images acquired with a 20X objective. The apparently dark portion in the bottom, left corner of panel (B) is an artifact of background subtraction used to produce this figure, but was not present during the identification of aberrant cells. (C-G) Zoomed fluorescence panel of a single aberrant, CD7-FITC(+) CLC amidst a large background of aberrant(-) cells. A Cy3-labeled
Ab was not used (autofluorescence channel). ... 158 Figure 5.7 The percent change between samples in the (top) aberrant (+) and (bottom)
aberrant(-) cells. All changes are calculated relative to the previous measurement. Patient data was separated by shading and the x-axis arbitrarily represents subsequent sampling (not scaled with time). We did not observe any apparent trend between the aberrant(+) and the aberrant(-) sets. The maximum decrease in any set was -100% and corresponded to complete loss of cells associated with that set. There is no
fundamental limit to increases in the aberrant(+) or aberrant(-) cells, but we did limit the y-axis to +1000% for visualization purposes. Lastly, if a set of cells was present in a sample but was not observed on the previous sample, a change of +100% was
assigned. ... 161 Figure 6.1 (A) Schematic of the module fluidic system for the comprehensive analysis
solenoid valves, and heaters), and robot control board. Microscope control electronics
are located inside microscope enclosure shown in (C) along with optical components... 166
Figure 6.2 Strategic path for commercializing the CTC technology. (A) Rapid generation of a low cost system that purifies, counts, and tests the viability of CTCs. CTCs are then dispensed for laboratory analysis. (B) A fully automated CTC test, including CTC
phenotyping. (C) Future research and development to explore microfluidic MFC to sort CTC sub-types for separate testing (molecular profile/drug resistance), either by
laboratory technicians or within an integrated microfluidic system. ... 168
Figure 6.3 Injection molding of high aspect ratio fluidic microchannels (25 µm wide and 150 µm deep) used in the CTC isolation module. (A) Design of “split” CTC isolation channels; red circles show the position of the ejector pins. (B) SEM of injection molded sinusoidal microchannels with ejector pins and (C) injection molded sinusoidal
channels with no ejector pins. Simulations of (D) velocity through the parallel channels and (E) shear stress in the inlet and outlet channels using straight or tapered
addressing channels. ... 169 Figure 6.4 (A) Schematic operation of membrane microvalve with direct solenoid
actuation. (B) Preparation and assembly membrane valve using a pressure sensitive adhesive tape. (C) Picture of assembled test valve for evaluation of valve performance. (D) Results of pressure test of the membrane microvalves. (E) Schematic
representation of self-aligning fluidic interconnects for attaching modules to a fluidic motherboard with minimal unswept volumes based on conical receiving ports molded into modules and motherboard and a semi-rigid TefzelTM tubing (1) permanently bonded with adhesive (2). (F) Picture of assembled units with interconnects shown in
(E). ... 171 Figure 6.5 (A) Impedance trace of SKBR3 cells. SKBR3 cells recovered from the
impedance sensor in (A) and subjected to (B) Eth-HD1 staining and (C) calcein AM staining. (D) SKBR3 cells that were subjected to FA and Triton-X100 and then allowed to hydrodynamically flow through the impedance sensor module. SKBR3 cells
recovered from the impedance sensor in (D) and subjected to (E) Eth-HD1 staining and (F) calcein AM staining. (G-H) Diagram explaining the origin of higher then buffer-only resistance registered for intact cells (A) and drop in resistance for cells containing membranes that are compromised (D). Rcell – resistance of cell, Rsol – resistance of volume of solution equal to volume of cell. Impedance traces were collected for cells
suspended in 1X TG buffer. The impedance was measured at a frequency of 40 KHz. ... 172 Figure 6.6 (A) Picture of the assembled TDI-Spectral MFC system. (B) Optical
PE-Cy7). A box with color indicates that the program detected the dye in the mixture. All dye combinations were successfully deconvoluted by classic least squares unmixing,
LIST OF ABBREVIATIONS
Ab Antibody
aCGH Array comparative genomic hybridization AFM Atomic force microscopy
AML Acute myeloid leukemia
ASCO American Society of Clinical Oncology
ATR-FTIR Attenuated total reflectance – Fourier transform infrared spectroscopy BSA Bovine serum albumin
CAM Collagen adhesion matrix CCD Charge coupled device
CF Continuous flow
CFD Computation fluid dynamics
CK Cytokeratin
CLC Circulating leukemic cell
CMMC Circulating multiple myeloma cell CMV Cytomegalovirus
COC Cyclic olefin copolymer COOH Carboxylic acid
DLI Donor lymphocyte infusion
EDC 1-Ethyl-3-(3-dimethylaminopropyl)carbodiimide EGFR Epidermal growth factor receptor
EMT Epithelial to mesenchymal transition EpCAM Epithelial cell adhesion molecule EPISPOT Epithelial immunospot
ER Estrogen receptor
FACS Flow assisted cell sorting FAPα Fibroblast activation protein-α FAST Fiber-optic array scanning
FC Flow cytometry
FISH Fluorescence in situ hybridization
GEDI Geometrically enhanced differential immunocapture GvL Graft-versus-leukemia
HER2 Human epidermal growth factor receptor 2 hMUC1 Hypoglycosylated mucin 1
HPMM High precision micromilling
IPA Isopropanol
ISET Isolation by size of (epithelial) tumor cells
L Localized
LDR Ligase detection reaction
LiGA Lithographie, galvanoformung, abformung
M Metastatic
MAC Myeloablative conditioning MFC Multi-parameter flow cytometry MFI Mean fluorescence intensity MRD Minimal residual disease
NCCN National Comprehensive Cancer Network NGS Next generation sequencing
NHS N-Hydroxysuccinimide NSCLC Non-small cell lung cancer
OVC Ovarian cancer
PBS Phosphate buffered saline
PC Poly(carbonate)
PCR Polymerase chain reaction
PDAC Pancreatic ductal adenocarcinoma PDMS Poly(dimethylsiloxane)
PDX Patient derived xenograft PDT7 Protein tyrosine kinase 7 PEGDA Poly(ethylene glycol diacrylate) PMMA Poly(methyl) methacrylate PMT Photomultiplier tube PNIPAm Poly(N-isopropylacrylamide) PSA Prostate specific antigen
PSMA Prostate specific membrane antigen
RMS Root mean squared RNA-ISH RNA in situ hybridization RNA-seq RNA sequencing
RT-PCR Reverse transcription polymerase chain reaction SCCHN Squamous cell carcinoma of the head and neck SCT Stem cell transplant
SELEX Systematic evolution of ligands by exponential enrichment SEM Scanning electron microscopy
SMCC Succinimidyl trans-4 (maleimidylmethyl) cyclohexane-1-carboxylate SSNV Somatic single nucleotide variant
TBO Toluidine blue O
TDI Time-delayed integration Tg Glass transition temperature USER™ Uracil specific excision reagent
Vim Vimentin
VvL Virus-versus-leukemia WBC White blood cell WCA Water contact angle
CHAPTER 1. A CRITICAL REVIEW OF TECHNOLOGIES FOR THE ISOLATION AND ANALYSIS OF CIRCULATING TUMOR CELLS
1.1Circulating Tumors Cells (CTCs) – A Biological Context
Cancer metastasis causes ninety percent of all cancer-related deaths.1,2 Mobile cancer cells are released from the primary tumor and invade proximal tissue, some migrating into the lymphatic system or into the peripheral blood where these tumor cells circulate (circulating tumor cells – CTCs) and potentially colonize a distal site to form metastases.1,3,4 It has been theorized that metastasizing tumor cells undergo an epithelial-to-mesenchymal transition (EMT), where tumor cells lose their epithelial character and morph into a mesenchymal-like phenotype.5,6 The EMT posits that cells with mesenchymal phenotype are mobile and capable of escaping tumor tissue; remain viable during circulation by being resistant to anoikis, apoptosis, and necrosis; have the ability to invade distal tissues; and possess stem cell capability – self-renewal and tumor-initiating ability.5,7-12 The EMT process is also thought to be reversible so that mesenchymal CTCs can revert to an epithelial phenotype during colonization, which has been suggested to be critical for metastasis formation because CTCs locked into a mesenchymal state are apparently unable to form metastases.13-15 Thus, CTCs with an intermediate epithelial-mesenchymal phenotype are likely the effectors of metastasis.16,17
suitable for routine and frequent staging of the patient’s cancer.23 The extraction of CTCs directly from the blood (i.e., liquid biopsy) has received significant attention as a minimally invasive diagnostic that could serve as a routine screening tool for the early detection of cancer and/or provide a frequent insight into the effectiveness of chemotherapy treatment. This is especially beneficial for monitoring cancers that are anatomically inaccessible such as pancreatic ductal adenocarcinoma (PDAC). Further, molecular profiling of the CTCs can help identify drug resistance prior to implementation of the therapy regimen – e.g., therapies targeting the epidermal growth factor receptor (EGFR) are blocked by genomic mutations in the KRAS gene24 – and molecular or proteomic CTC analysis could potentially aid in discovering new therapy targets.17
Numerous technologies have been developed over the past decade (Figure 1.1) to isolate CTCs directly from the blood. The primary challenge in CTC analysis has always been the low abundance of CTCs (1-3,000 CTCs/mL)25 against the high background of blood cells (109 total blood cells/mL; 107 white blood cells (WBCs)/mL).26 It is a technically complex feat to design an assay that both reliably identifies rare CTCs and substantially purifies the CTCs, which is necessary to eliminate the large WBC background that complicates CTC identification and yields abundant wild-type nucleic material that inhibits molecular analyses. CTCs must then be discerned by some unique property that specifically differentiates CTCs from all other blood components. This can be a biological marker, such as a molecular or protein signature, or a physical property, such as CTC size.
Figure 1.1 A Scopus survey of articles published from 2004 to 2014 that regard CTCs in general or specifically regard CellSearch or microfluidics. Scopus results were restricted to articles only and used the fields specified in the legend.
heterogeneity in tumor biology, particularly with respect to the EMT.17 For example, CTCs were initially defined as negative for the WBC-specific CD45 surface protein and positive for the epithelial cell adhesion molecule (EpCAM) surface protein and cytokeratin (CK) cytoskeletal proteins, yet modern studies have identified mesenchymal CTCs that do not fit this definition due to EMT with downregulation of the epithelial EpCAM and CK markers.27-29 Thus, not only have technologies evolved for highly sensitive CTC isolation, but the community continues to explore the biological properties and clinical importance of CTCs. It is also interesting to note that the developed assays for CTC isolation have been adapted to other important clinical applications beyond surveying epithelial cancers, e.g., blood cancers such as multiple myeloma30 and leukemias23,31,32 and even stroke diagnostics.33
laboratories and commercial technologies? This latter point is especially important for microfluidic-based CTC assays that have arguably seen the most extensive development, as well as divergence in techniques.
Microfluidics are comprised of fluidic channels or other conduits that are only <100 µm in size and allow the accurate manipulation of very small sample volumes. For CTC analysis, this can be used to carefully control the interaction of blood cells with CTC-specific antibodies (Abs) immobilized along the similarly sized microfluidic channels, for example. Further, by conducting the assay within a dedicated device, conventional laboratory procedures can be automated (i.e., lab on a chip) and packaged in a low-cost, sample-in-answer-out format so that the technology can achieve in-clinic, point-of-care use for the general public or even in-laboratory, point-of-research use by cancer researchers.
We cannot exhaustively cover every technology in the literature due to the field’s acceleration – almost 350 microfluidic-based articles regarding CTCs were reported in 2014 alone (Figure 1.1) – therefore, we will rather focus on representative technologies with significant clinical demonstrations or those that illustrate fundamental principles in order to discuss nuances, technical considerations that affect assay performance, and steps that have been made toward commercialization. We will also highlight a number of analyses that can be performed using the CTCs once they are retrieved, which extends beyond enumeration-based prognostics and towards screening for genomic mutations, gene transcription profiles, protein translation, and drug susceptibility of the CTCs (Figure 1.2).
1.2 Properties of CTCs Targeted for Isolation
matrix (i.e., invasion capacity), whereas technologies employing physical properties seek to discriminate CTCs by size, deformability, density, and dielectric properties amongst others. Some technologies have emerged that combine both biological and physical properties.
1.2.1Biological Properties
The most ubiquitous biological property exploited for CTC isolation is the presence EpCAM. Circulating EpCAM(+) cells are generally absent in the blood of healthy donors and patients with non-malignant diseases, and this affords technologies that use Abs or aptamers that affinity select EpCAM(+) CTCs with high specificity. The resultant purity of the CTC isolate depend on subtle aspects in the selection process that will be discussed throughout this review. EpCAM selection was first employed by the CellSearch™ CTC Test platform25 and later by microfluidics.44 The most recent research has documented, however, the presence of clinically relevant CTCs that do not express EpCAM, namely those of mesenchymal or stem cell nature.27,28 A number of additional markers, including N-Cadherin, O-Cadherin, VCAM-1, ICAM-1, CEA, MUC1, EphB4, CD44, CD133, CD146, PSMA, HER2, EGFR, TROP-2, and FAPα have been explored in addition to anti-EpCAM selection.27,28,35,45-48 Some of these markers lack specificity due to expression on normal blood cells, benign cells, and/or endothelial cells, while other markers are co-expressed with EpCAM and thereby providing no additional benefit to the assay,48-50 or are specific for only a particular disease, such as the targeting of the prostate specific membrane antigen (PSMA) for prostate cancer.28
of patients with ovarian, colorectal, prostate, and pancreatic cancers and 80% of breast cancer patients.28 Both studies demonstrated the presence of CTCs that had weak or no expression of CK with Yu, et al. identifying mesenchymal CTCs by RNA in situ hybridization (RNA-ISH)27 and Witek, et al. by expression of the mesenchymal cytoskeletal protein vimentin (Vim).28 Further, results indicated that mesenchymal CTCs could be an indicator of disease progression and/or chemotherapy resistance.27,28 Such studies strongly suggest that the classic definition of CTCs as EpCAM(+)/CK(+)/CD45(-) is not inclusive of all CTC phenotypes and that assays exclusively selecting EpCAM(+) CTCs do not fully survey a patient’s disease burden. 1.2.2Physical Properties
A significant amount of research has been invested in developing technologies that discern CTCs by physical properties, e.g., size, deformability, density, and dielectric properties. Microfabricated filter pores, traps, and slots; microfluidic devices that employ hydrodynamic phenomena for size-separation; and microfluidic devices for dielectrophoretic separation all separate CTCs by physical properties.51,52 In general, physical-based technologies isolate CTCs much more quickly (reduced assay time) than biological-based enrichment technologies but at a cost of considerably lower purity (i.e., a high abundance of background WBCs in the isolate), which can complicate CTC identification and preclude molecular analyses.
entrapments or escaping fluidic trapping, thereby biasing these technologies towards epithelial CTC recovery.54,55 Furthermore, the consistency of CTC size (15-25 µm in diameter56) has been called into question with CTC clusters (micro-emboli) exceeding 25 µm57 and with evidence of “small” CTCs that are similar in size to the highly abundant normal blood components,26,58-63 although the clinical importance of these small CTCs remains to be explored.
1.3Figures-of-Merit for CTC Technologies
To draw an informative comparison between CTC isolation technologies, the following important figures-of-merit were outlined:
(i) Recovery – the assay’s efficiency in selecting CTCs.
(ii) Purity – the ratio of CTCs to the total number of cells in the isolate. (iii) Throughput – the rate for processing samples.
(iv) Clinical sensitivity – the assay’s ability to correctly identify patients with the disease. (v) Clinical specificity – the assay’s ability to correctly identify patients without the disease. In addition to these figures-of-merit, there are other factors that affect commercialization of the technology. The transition from an academic/research technology to a commercial product can be influenced by the cost involved in mass production of microfluidic devices and peripheral instrumentation and the cost and complexity of the assay, which can either promote or curb a technology’s prolificacy.
care to convert the reported figures-of-merit to the same definition and extract data from graphs via image processing as accurately as possible so useful comparisons can be made.
1.3.1How is Recovery Measured, and What Does It Mean?
All but two sets of recoveries reported in Table 1.1 were determined by spiking cultured cancer cells (i.e., CTC surrogates) into buffer or blood, enumerating the recovered CTCs, and calculating recovery based on the estimated number of cells spiked. Compared to buffer, blood is more viscous, exhibits non-Newtonian properties where viscosity decreases under shear, and contains a concentrated suspension of cells that can infer unpredictable cell-cell collisions;63 hence, spiking in physiological buffers is not preferred but is sometimes used to simplify cell identification. A second point to consider is that cell lines are relatively uniform in size, phenotype, and antigen (e.g., EpCAM) expression, although these parameters can vary due to culture conditions and even through passage.63,64 Cell line recoveries are then representative of and have been used to assess a technology’s performance in recovering a particular subpopulation of clinical CTCs (e.g., highly epithelial CTCs versus CTCs in EMT transition),44,47,65 which may or may not directly translate to yields of highly heterogeneous CTCs from clinical samples. For assays that rely on antigen expression, we have noted cell line antigen expression along with recoveries in Table 1.1. The accuracy and precision in recovering low numbers of cells (1-100 CTCs/mL) is governed by Poisson statistics with ~10-50% variance in the spiking process;66 our lab has concordantly observed calculated recoveries with standard deviations of 14-30%,30 which makes subtle shifts in assay performance difficult to assess. Some researchers have reduced this variability by counting spiked cells on the cap of a blood sample prior to mixing66 or by using a micromanipulator to physically pick individual cells for spiking,67 but even these methods assume that each cell is drawn from the blood tube and truly enters the device, which could be questionable when loading blood into a syringe, a common practice.
collected in a shallow microfluidic channel so that pre-labeled cultured cells can be identified.31,57,68 While the method ensures reliability of the measurement, this is a laborious process that requires one to scan 50 cm2 (~3 microscope slides) to identify a few cells amongst 250 µL of blood57 (~3,000,000 blood cells).69 Separately, we devised a “self-referencing” method in Chapter 4 of this dissertation, in which CTCs not recovered in a device are infused through an identical second device, third device, etc. The serial devices sequentially deplete CTCs from the sample with recoveries >70% requiring only 2 devices to sufficiently deplete the sample and lower recoveries requiring ≥3 devices. Average self-referencing recoveries were similar to spiking recoveries, but standard deviations were reduced from 35% to 6%.30
Because the self-referencing method does not rely on pre-labeled cells, the recovery of patient-derived CTCs in clinical samples could be determined without prior knowledge of CTC abundance. The authors demonstrated 79-87% recovery of M-PDAC CTCs in the sinusoidal technology and the only quantitative clinical CTC recoveries reported to date.28 Further, by referencing a device’s recovery to its own performance with the same clinical sample, the self-referencing method avoids matrix effects, which are fundamentally present when spiking cells into healthy blood. Cancer increases blood clotting (thrombosis is the second most frequent cause of death for cancer patients),70 which depletes fibrinogen, decreases plasma viscosity, increases sedimentation rates,71 and may have significant effects on the fluid dynamics occurring during CTC recovery. Chemotherapy and radiation treatment may also contribute to thrombosis and alter the production of blood cells altogether,71 all of which are important factors that will be encountered in the clinic but not represented by spiking experiments. The self-referencing method is easily adapted to other technologies and should enable further quantitation of clinical CTC recoveries. 1.3.2Purity – A Very Important but Perplexing Metric
biased by experimental design (spiking level of cells) or in clinical samples by variable disease burden. In other words, for the same levels of backgrounds WBCs, purity will decrease with lower levels of spiked cells or lower disease burden.
These factors can lead to results that are hard to interpret, even within the CTC technological community. For example, the following purities have been reported: (i) 10%; (ii) 14%; (iii) 38%; (iv) 53%; (v) 62%; (vi) 84%; and (vii) 99%. These purities correspond to the following approximate counts of WBCs/mL: (i) 10;72 (ii) 5,600;68 (both iii and vii) 1,000;31 (iv) 3,500;73 (v) 10;56 and (vi) 3,500 to >24,000.74 It is certainly not obvious which purity corresponds to the lowest level of background WBCs, and without context into how each experiment was performed, it is difficult to assess an assay’s performance and limitations. Further, one would expect that if a particular technology’s WBC background is reproducibly consistent throughout clinical trials, this would be reflected by a constant purity. Our lab achieved purities varying from 40% to 100% for 66 clinical samples, yet this variability was due to fluctuating CTC levels and actually represented a consistent background of 3 ± 3 WBCs/mL.28,75,76 Therefore, throughout this review, we will attempt to provide background cell counts per mL blood in addition to purity values.
1.3.3Throughput – How Much Blood is Really Necessary?
Some microfluidic technologies reach throughputs on the order of 1-2 mL/h without pre-processing the blood, whereas some technologies pre-concentrate the blood, e.g., by red blood cell lysis or Ficoll density gradient centrifugation to obtain a buffy coat, both of which incur cell loss ranging from 10-33%.85,86 Thus, volumetric throughput may not accurately represent an assay’s throughput for processing samples, and in Table 1.1, we have adjusted throughputs for dilutions and concentrations; a volumetric processing rate of 240 mL/h of 10X diluted is a sample throughput of 24 mL/h.63 It should be noted that most microfluidic devices with 1-2 mL/h sample throughput can be engineered towards 5-15 mL/h by processing blood through multiple devices in parallel,65,87,88 and in Chapter 2 and Appendix 2.1, we detail methods to enable these high throughputs. However, in the short term, it is doubtful that the technologies with 1-2 mL/h throughput that also achieve high clinical yields will be practically hindered by this factor. Therefore, the 7.5 mL benchmark is not resolute and depends on assay performance.
1.3.4Establishing Clinical Specificity and Sensitivity
Table 1.1 Figures-of-merit for representative technologies that isolate CTCs by biological and/or physical properties, results from clinical studies, and demonstrations of CTC analysis beyond enumeration.
† Cell line antigen expression: +1,000-15,000, ++15,000-50,000, +++50,000-150,000, ++++>150,000
‡ Purity is defined as the ratio of CTC count to total cell count
* Cancer type abbreviations used throughout table: AML (acute myeloid leukemia), CR (castration resistant), CS (castration sensitive), L (localized), M (metastatic), NSCLC (non-small cell lung cancer), PDAC (pancreatic ductal adenocarcinoma) PDX (patient derived xenograft), SCCHN (squamous cell carcinoma of the head and neck)
** CTCs were detected in 90% of clinical samples, but thresholds for positivity were not established from controls. *** Peripheral blood samples were collected in a CellSave™ Tube.
Technology
(Principle) Target Throughput
Recovery
Purity‡ Clinical Studies Beyond Enumeration References
Cell Line† Medium Efficiency Cancer type* Range (Median)
CTCs/mL
Sensitivity
CellSearch™
(Biological) Ab-EpCAM
NA - Dedicated laboratories SKBR3+++ T47D+++ BT20++ MDA-MB-231+ Blood ≥85% 75% 44% 12% Epithelial kit: 0.01-0.1% Profile kit: 21-95% (60% mean)
CTC Test Profile kit
Profile kit only Molecular (RT-PCR,
Sanger) Cytogenetics (FISH)
25,83,84,90-93 M-Breast (N=75) 0-57 (4) 4-2432
(116) NR NSCLC (N=71) 0-53 (4) 5-1801
(145) Others (N=90/52) 0-10 (NR) / 0-17
(NR)
12% / 63% Epithelial kit
M-Breast (N=422) 0-3150 (11 mean) 26% M-Colorectal (N=196) 0-14 (0.1 mean) 17% M-Lung (N=99) 0-290 (4 mean) 14% M-Ovarian (N=29) 0-14 (0.8 mean) 23% M-Pancreatic (N=16) 0-4 (0.3 mean) 5% M-Prostate (N=123) 0-435 (10 mean) 41% Non-cancer (N=199) 0-0.4 (0 mean) -
Healthy (N=145) 0-0.1 (0 mean)
CTC Chip
(Biological) Ab-EpCAM 1 mL/h
H1650++++ SKBR3++++ PC3++ T24+ PBS 76±8% 74±5% 80±6% 76±7% 34±8%
Breast (N=10) 5-176 (78) 100%
Clinical Molecular (RT-PCR, EGFR
mutations)
44,94 Colon (N=10) 0-375 (57) 90%
NSCLC (N=55) 5-1281 (73) 100% Pancreatic (N=15) 9-831 (120) 100% L-Prostate (N=7) 25-174 (103) 100% M-Prostate (N=19) 16-292 (50) 100% Healthy (N=20) 0-0 (0) -
GEDI Micropillar
Chip
(Biological and Physical - Size)
Ab-PSMA
1 mL/h
LNCaP++++ PBS
Blood
97±3%
85±5% 62±2%
Prostate (N=4) NR (27 ±4 average) ND**
Cell line Molecular (RT-PCR) Drug susceptibility
(on-chip culture)
47,56,79,95 Prostate (N=30) 0-1200 (54) NR
Healthy (N=10) 0-22 (3) - Ab-EpCAM/
hMUC1
Capan-1+++
PANC-1++ PBS
70±3%
61±3% NR PDAC (N=1) 102-135 (NA) -
Ab-EpCAM ND NR
PDAC (N=11)*** 0-59 (9) 73% Cystic lesion (N=21)*** 0-22 (0) (4 mean) 33% Healthy (N=19)*** 0-3 (0) -