Physiological and Behavioral Factors Influencing Dietary Restraint and BMI By
Megan Ashley Neff
Senior Honors Thesis Department of Nutrition
University of North Carolina at Chapel Hill 2019
Approved:
ABSTRACT
Megan Ashley Neff; Physiological and Behavioral Factors Influencing Dietary Restraint and BMI
(Under the direction of Kyle Burger)
TABLE OF CONTENTS
LIST OF TABLES ... iv
LIST OF FIGURES ... v
CHAPTER 1: STUDY AIMS AND HYPOTHESES ... 1
CHAPTER 2: INTRODUCTION ... 2
CHAPTER 3: METHODS ... 5
3.1 Participants ... 5
3.2 Measures: Independent Variables ... 5
3.2.1 BMI ... 5
3.2.2 Body Fat Percentage ... 5
3.3 Measures: Dependent Variables ... 6
3.3.1 Average Resting Metabolic Rate ... 6
3.3.2 Total Energy Expenditure ... 6
3.3.3 Behavioral Inhibition and Activation ... 7
3.3.4 Dietary Intake ... 8
3.3.5 Dutch Eating Behavior Questionnaire ... 8
3.3.6 Food Craving and Liking ... 9
3.3.7 Dietary Disinhibition ... 9
3.3.8 Dietary Restraint ... 9
3.3.9 Dietary Hunger ... 10
3.3.10 Restraint Scale ... 10
3.4 Analysis ... 11
CHAPTER 4: RESULTS ... 13
4.1 Participant Characteristics ... 13
4.2 Results ... 13
4.2.1 Factor Analysis ... 13
4.2.2 Linear Regressions ... 13
CHAPTER 5: DISCUSSION ... 15
APPENDIX ... 18
LIST OF TABLES
Table 1 – Sample Characteristics ... 19
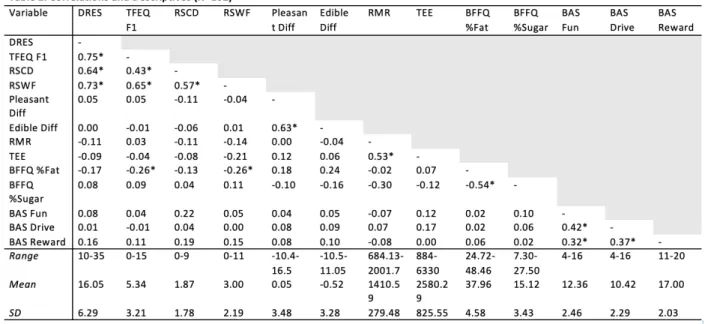
Table 2 – Pearson’s Correlations Between Measures ... 20
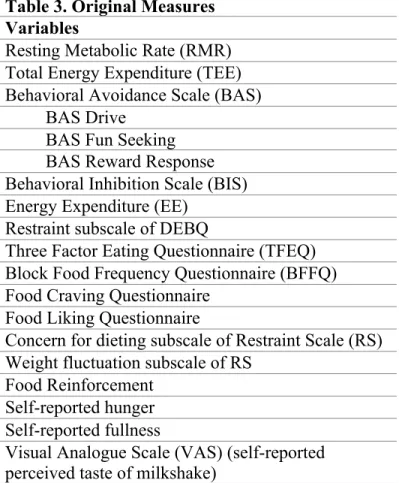
Table 3 – Original Measures ... 21
Table 4 – Factor Loadings ... 22
Table 5 – Factors regressed on BMI change controlling for W1 BMI ... 23
Table 6 – Factors regressed on BMI percentile change controlling for W1 BMI percentile ... 24
Table 7 – Factors regressed on BMI slope controlling for BMI intercept ... 25
Table 8 – Factors regressed on body fat (BF) change controlling for W1 BF ... 26
LIST OF FIGURES
CHAPTER 1: STUDY AIMS AND HYPOTHESES
Obesity is a major public health concern affecting approximately one-third of the United States adult population (Flegal, Carroll, Ogden, & Curtin, 2010). As obesity becomes more widespread, dietary restraint is an attractive method for weight control. However, studies have
consistently shown a positive relationship between dietary restraint and obesity, with prospective
studies showing that those with higher dietary restraint scores actually gain more weight over
time than those with lower scores (Stice, Sysko, Roberto, & Allison, 2010). However, many
factors may interact among the relationship between restraint and increased BMI: physiology, taste, impulsivity, and reward response among them. In fact, one study showed a positive
relationship between impulsivity and food intake (Guerrieri, et al., 2007), and those who indicate higher preference for sweet-fat taste may be at an increased risk for obesity (Donaldson, Bennett, Baic, & Melichar, 2009). As obesity continues to spread in prevalence, it is important to
determine what other factors might be leading to weight gain. Therefore, we will look at thirty-two variables measured on 162 adolescents and determine what factors among them might be influencing BMI and percent body fat.
Aim 1: To determine how variables related to food intake – such as resting metabolic rate, taste preference, and impulsivity – interact and cluster into distinct factors. We hypothesize that three factors will emerge and can de defined as follows: physiology, behavioral control, and taste perception.
CHAPTER 2: INTRODUCTION
Obesity is the second leading cause of preventable premature death, affecting over 72 million adults in the United States (Bean, Stewart, & Olbrisch, 2008). Defined as having a body mass index (BMI) of ≥30.0 kg/height in m2, obesity is associated with a number of health consequences, including cardiovascular disease, sleep apnea, type 2 diabetes, and some cancers (Kopelman, 2000). Herman and Polivy theorized that each individual has his/her own range of homeostatically regulated body weight (Herman, & Polivy, 1983). Those with a higher natural set-point of body weight are under extreme societal pressure to lose weight (Herman & Polivy, 1983), and dietary restraint is often the attempted mechanism for doing so (Van Strien, Frijters, Bergers, & Defares, 1986). However, lack of adequate intake can leave these individuals persistently hungry and vulnerable to overeating (Van Strien et al., 1986). Laboratory studies have found that restrained eating in rats results in exaggerated predigestive hormonal reflexes, which correspond with subsequent overeating (Polivy & Herman, 1985). Similar physiological reactions to self-starvation may underlie overeating and higher weight status in dieting humans.
As the prevalence of obesity increases, dietary restraint has become one common method of weight control. Dietary restraint can be defined as the restriction of food intake for the
females with higher dietary restraint scores are at greater risk for future onset of binge eating, bulimic symptoms, and bulimic pathology (Stice, Sysko, Roberto, & Allison, 2010). Intuitively one who practices dietary restraint, and therefore reduces caloric intake, should also maintain a lower BMI. However, studies consistently suggest a positive relationship between dietary restraint and caloric intake (Stice et al., 2010). Additionally, individuals with higher scores on dietary restraint scales gain more weight over time than people with lower scores (Stice,
Cameron, Killen, Hayward, & Taylor, 1999). While restrained eaters are generally motivated to control their weight via dieting, they are rarely successful (Papies, Stroebe, & Aarts, 2009).
The relationship between dietary restraint and obesity is complex. Therefore it is important to consider other factors that may influence dietary intake among restrained eaters, including: food craving, impulsivity, taste, resting metabolic rate (RMR), hunger, fullness, inhibition, and avoidance. Restrained eaters often report stronger preferences for palatable foods than non-restrained eaters, and this may negatively affect restrained eaters’ attempts at
controlling intake (Papies et al., 2009). Additionally, impulsivity has been shown to be predictive of food intake, with high impulsivity leading to higher dietary intake (Guerrieri, et al., 2007). This may be why Attention Deficit Hyperactivity Disorder, a disorder characterized by
impulsivity, is often comorbid with obesity (Guerrieri et al., 2007). Studies show that individuals with ADHD have above average BMI z-scores and/or a significantly higher prevalence of
obesity compared with subjects without ADHD (Cortese, & Peñalver, 2010). Taste also affects intake. Individuals who exhibit higher preference for sweet-fat taste may be at an increased risk for obesity (Donaldson, Bennett, Baic, & Melichar, 2009). Also of interest is resting metabolic rate (RMR), which is the rate at which your body uses energy when at rest. It is strongly
sedentary adults (Bogardus et al., 1986). Furthermore, studies suggest that higher RMR
corresponds with higher body weight (Ravussin, Burnand, Schutz, & Jequier, 1982), and RMR is well known to decrease during periods of caloric restriction (Lennon, Nagle, Stratman, Shrago,
& Dennis, 1985). In regards to hunger and fullness, researchers have theorized that dieters who
experience chronic hunger are at greater risk of binge eating (Tuschl, 1990). Furthermore, dieters
rely heavily on cognitive controls, such as calorie counting and excluding food groups, to dictate their eating patterns (Stice et al., 2010). These cognitive controls leave them vulnerable to overeating and binge eating when they are compromised, such as if an individual were to eat a “forbidden” food (Stice et al., 2010). Finally, the Behavioral Inhibition Scale (BIS)/Behavioral Avoidance Scale (BAS) is designed to measure one’s sensitivity to punishment and reward. BIS/BAS scores have been shown to be significantly different in those who are obese versus those who are normal weight (Danner, Ouwehand, van Haastert, Hornsveld, & de Ridder, 2012). It is possible that one’s sensitivity to punishment (i.e., bitter taste) and motivation to find novel, pleasurable rewards (i.e., sweet-fat taste) would influence both the foods one consumes and therefore BMI.
CHAPTER 3: METHODS 3.1 Participants
We recruited 162 lean adolescents from high schools who were non-smokers, exhibited no major psychiatric disorders, and had no relevant food allergies. Each participant was asked to fast overnight before they completed a taste test and questionnaires, and had his or her BMI calculated. Methods were approved by the Oregon Research Institute Institutional Review Board.
3.2 Measures: Independent Variables 3.2.1 BMI
Height was measured to the nearest millimeter using a direct reading stadiometer. Participants were measured without shoes and with the body positioned such that the heels and buttocks are against the vertical support of the stadiometer and the head aligned so that the auditory canal and lower rim of the orbit are in a horizontal plane. Weight was assessed to the nearest 0.1 kg using digital scales with participants wearing light clothing without shoes or coats. Two measures of height and weight were obtained and averaged. BMI correlates with direct measures of total body fat such as Dual Energy X-ray Absorptiometry (DXA) (r = 0.80 to 0.90) and with health measures including blood pressure, adverse lipoprotein profiles, atherosclerotic lesions, serum insulin levels, and diabetes mellitus in adolescent samples (Dietz & Robinson, 1998; Pietrobelli et al., 1998).
3.2.2 Body Fat Percentage
minimize trapped air mass. Body density was calculated as body mass (assessed by direct weighing) divided by estimated body volume. Body density was used to calculate percent body fat. Estimates of percent body fat show high test-retest reliability (r 0.92 - 0.99) and correlate with DXA and hydrostatic weighing estimates (r = 0.98-0.99), with ADP estimate of percent body fat falling an average of only 1.7% different relative to DXA estimates (Fields, Goran, & McCrory, 2002; Weyers et al., 2002).
3.3 Measures: Dependent Variables 3.3.1 Average Resting Metabolic Rate
Resting Metabolic Rate (RMR) was measured using a Parvo Medicas TrueOne 2400 metabolic cart. RMR was assessed after a 12 hour overnight fast and after a 24-hour break from exercise. A transparent plastic hood was placed over the participant’s head. Ambient air is drawn through a fitted hood past the subject’s nose and mouth at a rate sufficient to prevent escape of expired gas (i.e., up to 60 l/min). The rate is adjusted to maintain flow-through carbon dioxide concentrations between 1 and 1.5%. Both the O2 and CO2 analyzers have an accuracy of 0.1%
(Bassett et al., 2001). Subjects remain awake in a recumbent position in a dim room at a comfortable
temperature. After a 20-min habituation period, oxygen consumption and carbon dioxide
production are measured continuously for 20 min by indirect calorimetry with a ventilated-hood system. RMR is then calculated from an average of the 20 minutes using the Weir formula (Weir, 1949).
3.3.2 Total Energy Expenditure
tracers. After a loading dose of water labeled with deuterium, a stable isotope of hydrogen, and the stable isotope 18 Oxygen (O), these tracers quickly equilibrate in body water. The deuterium is eliminated from the body as water and the elimination rate is thus proportional to water turnover. The 18 O is eliminated as water and carbon dioxide and thus its elimination is
proportional to the sum of water turnover and carbon dioxide production. The difference between these two elimination rates is proportional to carbon dioxide production. Total energy
expenditure over the 2 week period can be calculated from carbon dioxide production using indirect calorimetric equations (Weir, 1949), which provides an estimate of habitual energy expenditure. This estimate of total energy expenditure can be used to estimate total energy intake during the assessment period, after correcting for any change in BMI that occurs over the 2 week assessment period (Stice, Cooper, Schoeller, Tappe, & Lowe, 2007), which provides an estimate of habitual energy intake. The DLW method has an accuracy of 1% (Schoeller. 1988), has been validated in lean and obese individuals (Ravussin, Harper, Rising, & Bogardus, 1991; Seale, Rumpler, Conway, & Miles, 1990), and shows test-retest reliability (ICC r = 0.98) (Trabulsi &
Schoeller, 2001).
3.3.3 Behavioral Inhibition and Activation
Responsiveness (r = 0.871, 0.856-0.883) measures the sensitivity to pleasant reinforcers in the environment. Four items contribute to this score (e.g., “It would excite me to win a contest”). BAS Fun Seeking (r = 0.904, 0.904-0.906) measures the motivation to find novel rewards
spontaneously. Five items contribute to this score (e.g., “I crave excitement and new sensations”) (Campbell-Sills, Liverant, & Brown, 2004)
3.3.4 Dietary Intake
At baseline and annual follow-ups over four years, we assessed self-reported intake to characterize macronutrient composition of the diet (food choice), even though self-reported intake has questionable validity (Bathalon et al., 2000; Stice, Shaw, & Marti, 2007). The 60-item Block Food Frequency Questionnaire (Block FFQ; Block, Hartman, & Naughton, 1990) asks participants to estimate frequency of consumption of 60 specific food types. Participants indicate whether their typical serving is small, medium, or large, with a definition of a medium serving size provided. Food frequency questionnaires are the most practical and economical method for collecting comprehensive dietary data in large studies (Subar et al., 2001). Versions of the Block FFQ have corresponded well to dietary records and discriminate between treatment groups (Harris, French, Jeffery, McGovern, & Wing, 1994). Block FFQ values had a median correlation of 0.57 with 4-day food record estimates for energy and most nutrients (Block & Subar 1992) and were within +/- 3% of values obtained from 7-day weighed food records (Surrao, Sawaya, Dallal, Tsay, & Roberts, 1998).
3.3.5 Dutch Eating Behavior Questionnaire
Dutch Eating Behavior Questionnaire (van Strein et al., 1986) assessed whether participants eat in response to negative emotions. The scale has shown internal consistency (alpha = 0.90) and predictive validity for binge eating onset (Stice, Presnell, & Spangler, 2002). The external eating subscale measures whether participants eat in response to food-related stimuli, regardless of their internal state of hunger or satiety (Van Strien, Frijters, Bergers, & Defares, 1986).
3.3.6 Food Craving and Liking
The Food Craving Inventory (FCI, White, Whisenhunt, Williamson, Greenway, & Netemeyer, 2002) assesses the degree of craving for a variety of foods at baseline and annual follow-ups. We adapted this scale by also requesting ratings of how palatable participants find each food. The original FCI has shown internal consistency (aalpha = 0.93), 2-week test-retest reliability (r = 0.86), and sensitivity to detecting intervention effects (Martin, O’Neil, & Pawlow, 2006; White et al., 2002). In a pilot study (N = 27) the craving scale and the palatability scale showed internal consistency (aalpha = 0.91 and 0.89 respectively).
3.3.7 Dietary Disinhibition
The Disinhibition scale from the Three Factor Eating Questionnaire (TFEQ; Stunkard & Messick, 1985) is used to assess disinhibited eating. This scale has shown internal consistency (aalpha = 0.90) and correlates with objectively measured caloric intake and with current BMI and future increases in BMI (Bellisle et al., 2004; Bjorvell, Rossner, & Stunkard, 1986; Shrager, Wadden, Miller, Stunkard, & Steller, 1983).
3.3.8 Dietary Restraint
temporally reliability (1-month test-retest = 0.98) (French, Jeffery, & Wing, 1994; Stunkard & Messick, 1985).
3.3.9 Dietary Hunger
The dietary hunger scale from the TFEQ is used to assess hunger and its behavioral consequences. In addition, binge severity correlates with Factor III, perceived hunger (r = 0.54, p < 0.001). The scale is broken into three factor subcomponents; coefficient alpha reliabilities were 0.90 for Factor I (20 items), 0.87 for Factor II (19 items), and 0.82 for Factor III (20 items) (Stunkard & Messick, 1985)
3.3.10 Restraint Scale
The Restraint Scale (RS) is a widely used measure to assess restrained eating. RS includes items assessing restraint and other items assessing disinhibition or over-eating, (e.g., “Do you eat sensibly in front of others and splurge alone?”), but these items are not separated into subscales (van Strien, Herman, Engels, Larsen, & van Leeuwe, 2007). The scale instead has been shown to have two underlying factors: Weight Fluctuation (RSWF) and Concern for Dieting (RSCD) (Laessle, Tuschl, Kotthaus, & Prike, 1989).
3.3.11 Hedonic Visual Analogue Scale (VAS)
Participants tasted a standard highly palatable and hedonically pleasurable milkshake and used cross-modal visual analogue scales to rate the pleasantness, intensity, familiarity and level of desire/wanting for the milkshake.
3.3.12 Behavioral measure of sensitivity to food reward and general reward
Pringles, Skittles, Oreo cookies, Gingersnaps, Gummy Bears, and popcorn) and rated the
pleasantness of the food. After choosing the snack food they wanted to earn, subjects participated in a variable ratio button-pressing beginning at a ¼ schedule (meaning that one point was
awarded for four button presses), after earning 5 points the participant earned the snack of their choice. As the task continued, the ratio schedule became increasing more difficult (VR8, VR16, VR32, etc.). Participants were told that it would get progressively harder to earn points.
Participants were told to play for as long as they liked. They then repeated this task, but worked for $1 monetary rewards instead of food. The breakpoint at which the participant stopped button pressing for food was used as the behavioral measure of food reward (i.e., how many button presses are made in total before the subject stops). The food reinforcement paradigm has shown 2-7 day test-retest reliability (r = .80) (Epstein, Leddy, Temple, & Faith, 2007). Participants who rate the snack food as more pleasant typically work longer for it, and those who work longer for the snack also tend to consume more food during the ad lib portion of the paradigm. Participants who are obese and/or calorically deprived also work longer for the snack food (Epstein,
Truesdale, Wojcik, Paluch, & Raynor, H., 2003; Goldfield & Legg, 2006; Epstein et al., 2007). Statistical Analysis
3.4 Analysis
The package “nfactors” was used for all subsequent study analyses. In order to determine which variables clustered in factors, we performed an exploratory factor analysis using principal
components analysis (PCA) on all dependent variables. The purpose of PCA for this study was to reduce the number of variables into categorical groups (i.e., factors), which serves as a data trimming method and allows for analyses to be run while reducing the odds of encountering a false positive when looking at statistical significance of the results. The number of retained components were based on scree plot (Figure 1) examinations and eigenvalues greater than 1.0 (Kaiser, 1974). The scree plot allowed us to determine that there were 11 factors that could be identified among our 32 variables. After the initial factors were determined, variables were eliminated if they were cross-loaded (more than .35 on multiple factors) or had low factor loadings (<.40), and factors with only one variable were ignored (Johnson, Boles, & Burger, 2014). This left a total of five factors. Of the five factors remaining, we then ran a confirmatory factor analysis using only the thirteen variables listed for those five factors, which confirmed the five factors to be as follows: restraint, taste, physiology, diet, and reward response. After
CHAPTER 4: RESULTS 4.1 Participant Characteristics
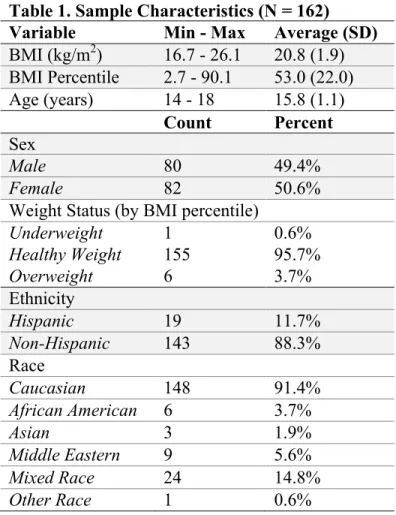
As shown in Table 1, the total sample population of (n=162) consists of a roughly even number of males and females (50.6% female) between the ages of 14 and 18 (average 15.8). The majority of participants were of a healthy weight according to BMI Percentile (average BMI percentile 53.0%). Participants were predominantly Caucasian (91.4%) and non-Hispanic (88.3%).
4.2 Results
4.2.1 Factor Analysis
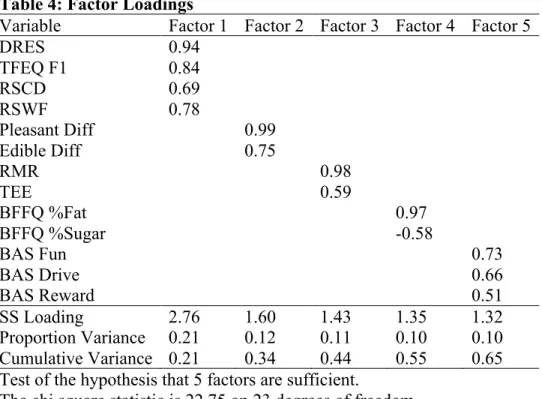
As seen in Table 4, factor 1 (restraint) contained the dietary restraint subscales of DEBQ and TFEQ, concern for dieting and weight fluctuation subscales of RS and accounted for 0.21 of the total variance. Factor 2 (taste) contained ratings of how pleasant and edible a milkshake was and accounted for 0.12 of the total variance. Factor three (physiology) contained RMR, as well as TEE, and accounted for 0.11 of the total variance. Factor four (diet) contained the fat and sugar subscales of the BFFQ and accounted for 0.10 of the total variance. Finally, factor five (reward response) contained BAS Drive, BAS Fun Seeking, and BAS Reward Responsiveness and accounted for 0.10 of the total variance.
4.2.2 Linear Regressions
CHAPTER 5: DISCUSSION
The purpose of this study was to determine the factors that best explain the complex
relationship between dietary restraint and obesity, as well as trend with BMI and percent body fat change. While we hypothesized that three factors would emerge (physiology, behavioral control, and taste perception), we found a total of five factors. These factors can be defined as follows: restraint, taste, physiology, diet, and reward response. The first factor restraint emerged as a combination of the following scales: TFEQ, restotal, RSCD, and RSWF. This factor in part confirms our hypothesis that behavioral control would emerge as a factor; it can be argued that restraint, diet, and reward response are components of behavioral control. Participant ratings of the hedonic value of milkshake make up the second factor taste. This factor supports our
hypothesis that taste perception would emerge as a distinct factor. Supporting our hypothesis that physiology would emerge as a factor, the third factor physiology is comprised of RMR and total
energy expenditure (TEE). The fourth factor diet is comprised of both percent fat and percent sugar intake, calculated from the Block FFQ, which asks participants to estimate frequency of
consumption of select foods. Consumption of these types of calorie-dense foods coincides with our hypothesis that taste perception would emerge as a factor; consumption of high-sugar and high-fat foods can be argued to be a component of taste perception, since it is likely that those who are consuming these foods also enjoy their taste. The final factor that emerged is reward response, which is comprised of BAS Drive, BAS Reward Responsiveness, and BAS Fun Seeking. This factor corresponds with our hypothesized factor of behavioral control.
explain. Another consideration is that each of the five factors is measuring a different amount of variance. Perhaps BMI and body fat could be better predicted by only three factors, rather than all five. Future studies should perform the same analyses, excluding one or more factors in each linear regression model, to see if a different combination of the five would better predict BMI. A common measure in the field of psychology, the Big Five of Personality Traits (Extraversion, Emotional Stability, Agreeableness, Conscientiousness, and Openness to Experience) was based on a five-factor model much like the one done in this study (Barrick, & Mount, 1991). Perhaps the five factors we found (restraint, taste, physiology, diet, and reward response) could be used in the future as the “Big Five” of eating behavior. Public health researchers should look into these factors more and determine the impact that each factor has on an individual’s eating patterns. For example, researchers could look at whether those with low restraint and high reward response are more likely to be obese. One step further would be to take these five factors and assess their relative impacts on different populations. This would allow public health officials to then design interventions based on these factors that could target areas of weakness regarding eating
behavior in specific populations. One limitation to acknowledge about these factors is that they do not include access to food as a component of social economic status (SES), such as if
someone were to live in a food desert or not have the financial means to afford food. We did not collect this data, and therefore cannot determine whether SES would emerge as one of the main factors impacting eating behavior.
replicate these statistics with a more representative study population, perhaps adults with a wider range of BMIs.
When initially analyzing the factors, the food craving questionnaire did not fall under any of them, essentially meaning it did not capture any of the variance. However, one limitation of using this questionnaire in our study is that it is limited by the foods that are presented in the questions. It is possible the questionnaire did not capture individualized food
preferences/cravings. Food craving is a subjective measurement, and future studies should look to personalize this questionnaire. One example of this is Dr. Rolls who is piloting a food craving questionnaire that has individuals first list the foods that they crave, and then designs the
questionnaire based on those foods (personal communication). This will hopefully allow craving to be better measured in the future.
Table 1. Sample Characteristics (N = 162) Variable Min - Max Average (SD) BMI (kg/m2) 16.7 - 26.1 20.8 (1.9)
BMI Percentile 2.7 - 90.1 53.0 (22.0) Age (years) 14 - 18 15.8 (1.1)
Count Percent Sex
Male 80 49.4%
Female 82 50.6%
Weight Status (by BMI percentile)
Underweight 1 0.6%
Healthy Weight 155 95.7%
Overweight 6 3.7%
Ethnicity
Hispanic 19 11.7%
Non-Hispanic 143 88.3%
Race
Caucasian 148 91.4%
African American 6 3.7%
Asian 3 1.9%
Middle Eastern 9 5.6%
Mixed Race 24 14.8%
Table 3. Original Measures Variables
Resting Metabolic Rate (RMR) Total Energy Expenditure (TEE) Behavioral Avoidance Scale (BAS)
BAS Drive BAS Fun Seeking BAS Reward Response Behavioral Inhibition Scale (BIS) Energy Expenditure (EE)
Restraint subscale of DEBQ
Three Factor Eating Questionnaire (TFEQ) Block Food Frequency Questionnaire (BFFQ) Food Craving Questionnaire
Food Liking Questionnaire
Concern for dieting subscale of Restraint Scale (RS) Weight fluctuation subscale of RS
Food Reinforcement Self-reported hunger Self-reported fullness
Table 4: Factor Loadings
Variable Factor 1 Factor 2 Factor 3 Factor 4 Factor 5
DRES 0.94
TFEQ F1 0.84
RSCD 0.69
RSWF 0.78
Pleasant Diff 0.99
Edible Diff 0.75
RMR 0.98
TEE 0.59
BFFQ %Fat 0.97
BFFQ %Sugar -0.58
BAS Fun 0.73
BAS Drive 0.66
BAS Reward 0.51
SS Loading 2.76 1.60 1.43 1.35 1.32
Proportion Variance 0.21 0.12 0.11 0.10 0.10 Cumulative Variance 0.21 0.34 0.44 0.55 0.65 Test of the hypothesis that 5 factors are sufficient.
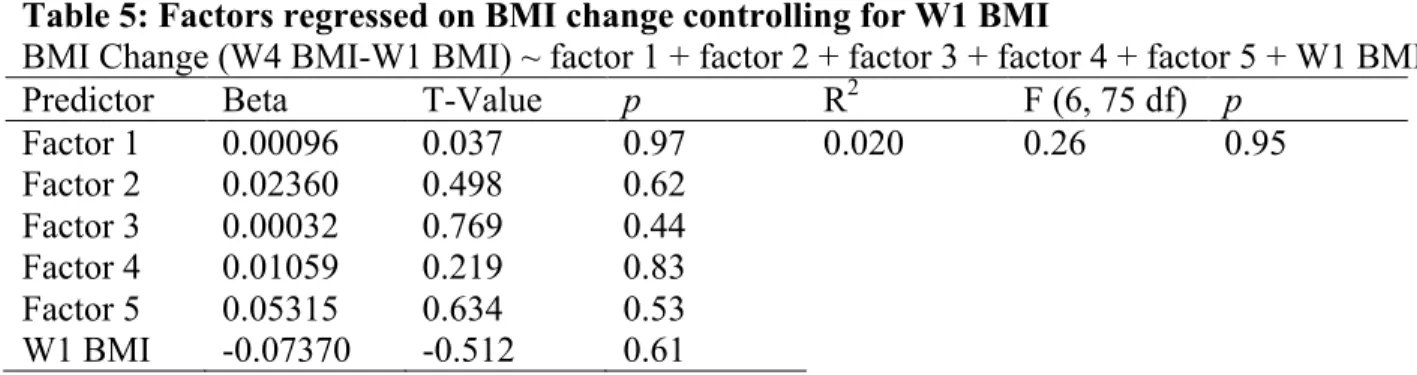
Table 5: Factors regressed on BMI change controlling for W1 BMI
BMI Change (W4 BMI-W1 BMI) ~ factor 1 + factor 2 + factor 3 + factor 4 + factor 5 + W1 BMI
Predictor Beta T-Value p R2 F (6, 75 df) p
Factor 1 0.00096 0.037 0.97 0.020 0.26 0.95
Factor 2 0.02360 0.498 0.62
Factor 3 0.00032 0.769 0.44
Factor 4 0.01059 0.219 0.83
Factor 5 0.05315 0.634 0.53
Table 6: Factors regressed on BMI percentile change controlling for W1 BMI percentile BMI Percentile (W4 BMI pct – W1 BMI pct) ~ factor 1 + factor 2 + factor 3 + factor 4 + factor 5 + W1 BMI pct
Predictor Beta T-Value p R2 F (6, 75 df) p
Factor 1 0.16543 0.910 0.366 0.052 0.68 0.67
Factor 2 0.28254 0.836 0.406 Factor 3 0.00041 0.141 0.889 Factor 4 -0.31203 -0.909 0.366 Factor 5 -0.02776 -0.046 0.963 W1 BMI
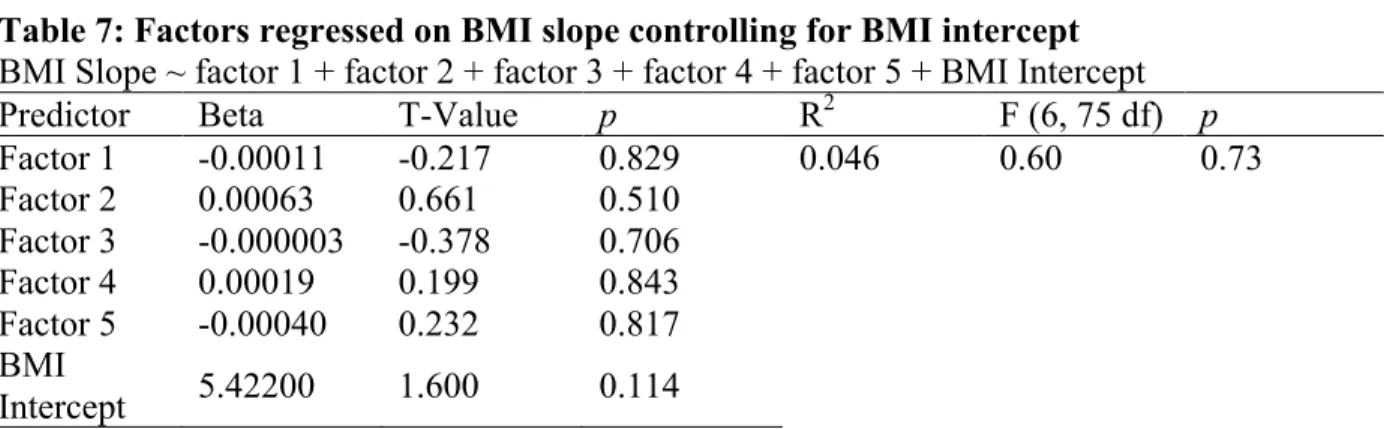
Table 7: Factors regressed on BMI slope controlling for BMI intercept BMI Slope ~ factor 1 + factor 2 + factor 3 + factor 4 + factor 5 + BMI Intercept
Predictor Beta T-Value p R2 F (6, 75 df) p
Factor 1 -0.00011 -0.217 0.829 0.046 0.60 0.73
Factor 2 0.00063 0.661 0.510 Factor 3 -0.000003 -0.378 0.706 Factor 4 0.00019 0.199 0.843 Factor 5 -0.00040 0.232 0.817 BMI
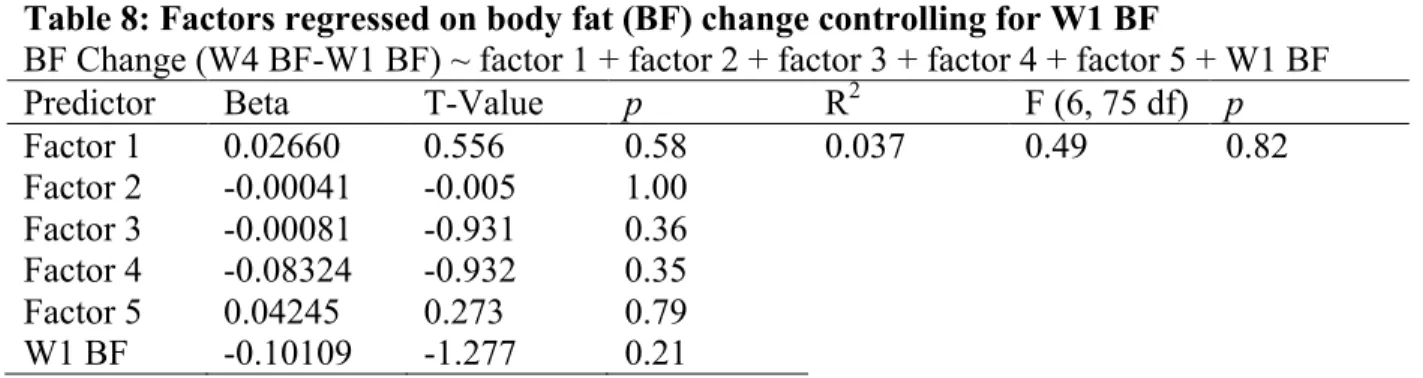
Table 8: Factors regressed on body fat (BF) change controlling for W1 BF
BF Change (W4 BF-W1 BF) ~ factor 1 + factor 2 + factor 3 + factor 4 + factor 5 + W1 BF
Predictor Beta T-Value p R2 F (6, 75 df) p
Factor 1 0.02660 0.556 0.58 0.037 0.49 0.82
Factor 2 -0.00041 -0.005 1.00 Factor 3 -0.00081 -0.931 0.36 Factor 4 -0.08324 -0.932 0.35
Factor 5 0.04245 0.273 0.79
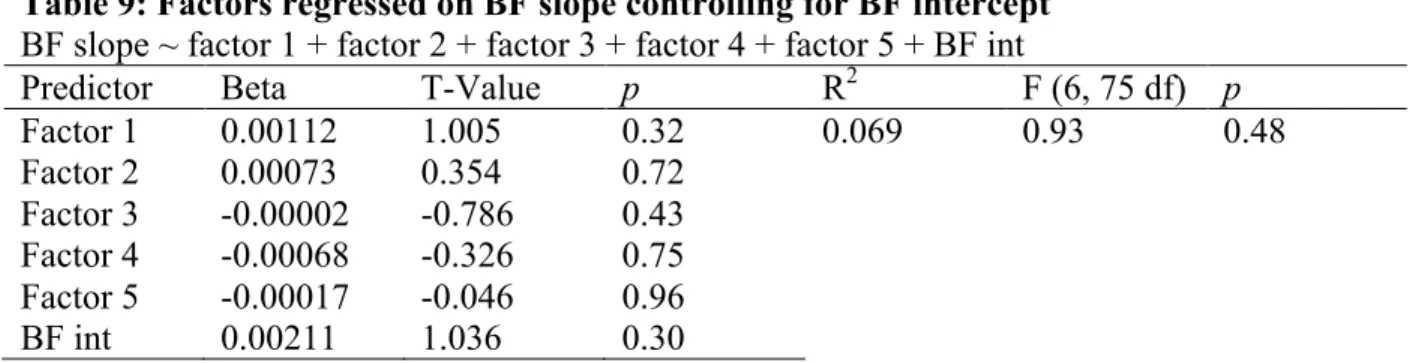
Table 9: Factors regressed on BF slope controlling for BF intercept BF slope ~ factor 1 + factor 2 + factor 3 + factor 4 + factor 5 + BF int
Predictor Beta T-Value p R2 F (6, 75 df) p
Factor 1 0.00112 1.005 0.32 0.069 0.93 0.48
Factor 2 0.00073 0.354 0.72
Factor 3 -0.00002 -0.786 0.43 Factor 4 -0.00068 -0.326 0.75 Factor 5 -0.00017 -0.046 0.96
REFERENCES
Allison, D. B., Kalinsky, L. B., & Gorman, B. S. (1992). A comparison of the psychometric properties of three measures of dietary restraint. Psychological assessment, 4(3), 391.
Barrick, M. R., & Mount, M. K. (1991). The big five personality dimensions and job performance: a meta-analysis. Personnel psychology, 44(1), 1-26.
Bassett Jr, D. R., Howley, E. T., Thompson, D. L., King, G. A., Strath, S. J., McLaughlin, J. E., & Parr, B. B. (2001). Validity of inspiratory and expiratory methods of measuring gas exchange with a computerized system. Journal of Applied Physiology, 91(1), 218-224.
Bathalon, G. P., Tucker, K. L., Hays, N. P., Vinken, A. G., Greenberg, A. S., McCrory, M. A., &
Roberts, S. B. (2000). Psychological measures of eating behavior and the accuracy of 3 common dietary assessment methods in healthy postmenopausal women. The American journal of clinical nutrition, 71(3), 739-745.
Bean, M. K., Stewart, K., & Olbrisch, M. E. (2008). Obesity in America: implications for clinical and health psychologists. Journal of Clinical Psychology in Medical Settings, 15(3), 214-224. Bellisle, F., Clément, K., Le Barzic, M., Le Gall, A., Guy-Grand, B., & Basdevant, A. (2004). The
Eating Inventory and body adiposity from leanness to massive obesity: a study of 2509 adults. Obesity research, 12(12), 2023-2030.
Björvell, H., Rössner, S., & Stunkard, A. (1986). Obesity, weight loss, and dietary restraint. International Journal of Eating Disorders, 5(4), 727-734.
Block, G., Hartman, A. M., & Naughton, D. (1990). A reduced dietary questionnaire: development and validation. Epidemiology, 58-64.
Block, G., & Subar, A. F. (1992). Estimates of nutrient intake from a food frequency questionnaire: the 1987 National Health Interview Survey. Journal of the American Dietetic Association, 92(8), 969-977.
Bogardus, C., Lillioja, S., Ravussin, E., Abbott, W., Zawadzki, J. K., Young, A., ... & Moll, P. P. (1986). Familial dependence of the resting metabolic rate. New England Journal of Medicine, 315(2), 96-100.
Cacciari, E., Milani, S., Balsamo, A., Dammacco, F., De Luca, F., Chiarelli, F., ... & Vanelli, M. (2002). Italian cross-sectional growth charts for height, weight and BMI (6–20 y). European Journal of Clinical Nutrition, 56(2), 171.
Carver, C. S., & White, T. L. (1994). Behavioral inhibition, behavioral activation, and affective
responses to impending reward and punishment: the BIS/BAS scales. Journal of personality and social psychology, 67(2), 319.
Cortese, S., & Peñalver, C. M. (2010). Comorbidity between ADHD and obesity: exploring shared mechanisms and clinical implications. Postgraduate medicine, 122(5), 88-96.
Danner, U. N., Ouwehand, C., van Haastert, N. L., Hornsveld, H., & de Ridder, D. T. (2012). Decision -making impairments in women with binge eating disorder in comparison with obese and normal weight women. European Eating Disorders Review, 20(1), e56-e62.
Epstein, L. H., Leddy, J. J., Temple, J. L., & Faith, M. S. (2007). Food reinforcement and eating: a multilevel analysis. Psychological bulletin, 133(5), 884.
Epstein, L. H., Truesdale, R., Wojcik, A., Paluch, R. A., & Raynor, H. A. (2003). Effects of deprivation on hedonics and reinforcing value of food. Physiology & behavior, 78(2), 221-227.
Fields, D. A., Goran, M. I., & McCrory, M. A. (2002). Body-composition assessment via
air-displacement plethysmography in adults and children: a review. The American journal of clinical nutrition, 75(3), 453-467.
Flegal, K. M., Carroll, M. D., Ogden, C. L., & Curtin, L. R. (2010). Prevalence and trends in obesity among US adults, 1999-2008. Jama, 303(3), 235-241.
French, S. A., Jeffery, R. W., & Wing, R. R. (1994). Food intake and physical activity: A comparison of three measures of dieting. Addictive Behaviors, 19(4), 401-409.
Goldfield, G. S., & Legg, C. (2006). Dietary restraint, anxiety, and the relative reinforcing value of snack food in non-obese women. Eating behaviors, 7(4), 323-332.
Guerrieri, R., Nederkoorn, C., Stankiewicz, K., Alberts, H., Geschwind, N., Martijn, C., & Jansen, A. (2007). The influence of trait and induced state impulsivity on food intake in normal-weight healthy women. Appetite, 49(1), 66-73.
Harris, J. K., French, S. A., Jeffery, R. W., McGovern, P. G., & Wing, R. R. (1994). Dietary and physical activity correlates of long-term weight loss. Obesity research, 2(4), 307-313. Herman, C. P., & Polivy, J. (1983). A boundary model for the regulation of eating. Psychiatric
Annals, 13(12), 918-927.
Johnson, S. L., Boles, R. E., & Burger, K. S. (2014). Using participant hedonic ratings of food images to construct data driven food groupings. Appetite, 79, 189-196.
Laessle, R. G., Tuschl, R. J., Kotthaus, B. C., & Prike, K. M. (1989). A comparison of the validity of three scales for the assessment of dietary restraint. Journal of abnormal psychology, 98(4), 504.
Lennon, D., Nagle, F., Stratman, F., Shrago, E., & Dennis, S. (1985). Diet and exercise training effects on resting metabolic rate. International journal of obesity, 9(1), 39-47.
Donaldson, L. F., Bennett, L., Baic, S., & Melichar, J. K. (2009). Taste and weight: is there a link?. The American journal of clinical nutrition, 90(3), 800S-803S.
Martin, C. K., O'neil, P. M., & Pawlow, L. (2006). Changes in food cravings during low-calorie and very-low-calorie diets. Obesity, 14(1), 115-121.
Papies, E. K., Stroebe, W., & Aarts, H. (2009). Who likes it more? Restrained eaters’ implicit attitudes towards food. Appetite, 53(3), 279-287.
Pietrobelli, A., Faith, M. S., Allison, D. B., Gallagher, D., Chiumello, G., & Heymsfield, S. B. (1998). Body mass index as a measure of adiposity among children and adolescents: a validation study. The Journal of pediatrics, 132(2), 204-210.
Polivy, J. (1996). Psychological consequences of food restriction. Journal of the American dietetic association, 96(6), 589-592.
Polivy, J., & Herman, C. P. (1985). Dieting and binging: A causal analysis. American psychologist, 40(2), 193.
R Development Core Team (2008). R: A language and environment for statistical computing. R Foundation for Statistical Computing, Vienna, Austria. ISBN 3-900051-07-0, URL http://www.R-project.org.
Ravussin, E., Burnand, B., Schutz, Y., & Jequier, E. (1982). Twenty-four-hour energy expenditure and resting metabolic rate in obese, moderately obese, and control subjects. The American journal of clinical nutrition, 35(3), 566-573.
Ravussin, Eric, Harper, I. T., Rising, Russell., & Bogardus, Clifton (1991). Energy expenditure by doubly labeled water: validation in lean and obese subjects. American Journal of Physiology-Endocrinology And Metabolism, 261(3), E402-E409.
Seale, J. L., Rumpler, W. V., Conway, J. M., & Miles, C. W. (1990). Comparison of doubly labeled water, intake-balance, and direct-and indirect-calorimetry methods for measuring energy expenditure in adult men. The American journal of clinical nutrition, 52(1), 66-71.
Shrager, E. E., Wadden, T. A., Miller, D., Stunkard, A. J., & Stellar, E. (1983). Compensatory intra-meal responses of obese women to reduction in the size of food units. In Abstracts, Society for Neuroscience (Vol. 201, No. 62.8).
Stice, E., Cameron, R. P., Killen, J. D., Hayward, C., & Taylor, C. B. (1999). Naturalistic weight-reduction efforts prospectively predict growth in relative weight and onset of obesity among female adolescents. Journal of consulting and clinical psychology, 67(6), 967.
Stice, E., Cooper, J. A., Schoeller, D. A., Tappe, K., & Lowe, M. R. (2007). Are dietary restraint scales valid measures of moderate-to long-term dietary restriction? Objective biological and behavioral data suggest not. Psychological assessment, 19(4), 449.
Stice, E., Presnell, K., & Spangler, D. (2002). Risk factors for binge eating onset in adolescent girls: a 2-year prospective investigation. Health psychology, 21(2), 131.
Stice, E., Shaw, H., & Marti, C. N. (2007). A meta-analytic review of eating disorder prevention programs: encouraging findings. Annu. Rev. Clin. Psychol., 3, 207-231.
Stice, E., Sysko, R., Roberto, C. A., & Allison, S. (2010). Are dietary restraint scales valid measures of dietary restriction? Additional objective behavioral and biological data suggest
not. Appetite, 54(2), 331-339.
Stunkard, A. J., & Messick, S. (1985). The three-factor eating questionnaire to measure dietary restraint, disinhibition and hunger. Journal of psychosomatic research, 29(1), 71-83.
Subar, A. F., Thompson, F. E., Kipnis, V., Midthune, D., Hurwitz, P., McNutt, S., ... & Rosenfeld, S. (2001). Comparative validation of the Block, Willett, and National Cancer Institute food frequency questionnaires: the Eating at America's Table Study. American journal of epidemiology, 154(12), 1089-1099.
Surrao, J., Sawaya, A. L., Dallal, G. E., Tsay, R., & Roberts, S. B. (1998). Use of food quotients in human doubly labeled water studies: comparable results obtained with 4 widely used food intake methods. Journal of the American Dietetic Association, 98(9), 1015-1020.
Trabulsi, J., & Schoeller, D. A. (2001). Evaluation of dietary assessment instruments against doubly labeled water, a biomarker of habitual energy intake. American Journal of Physiology-Endocrinology And Metabolism, 281(5), E891-E899.
Tuschl, R. J. (1990). From dietary restraint to binge eating: some theoretical considerations. Appetite, 14(2), 105-109.
van Strien, T., Herman, C. P., Engels, R. C., Larsen, J. K., & van Leeuwe, J. F. (2007). Construct validation of the Restraint Scale in normal-weight and overweight females. Appetite, 49(1), 109-121.
Weir, J. D. V. (1949). New methods for calculating metabolic rate with special reference to protein metabolism. The Journal of physiology, 109(1-2), 1-9.
Westerterp, K. R. (1999). Physical activity assessment with accelerometers. International Journal of Obesity, 23(S3), S45.
Weyers, A. M., Mazzetti, S. A., Love, D. M., GÓmez, A. L., Kraemer, W. J., & Volek, J. S. (2002). Comparison of methods for assessing body composition changes during weight loss. Medicine and science in sports and exercise, 34(3), 497-502.