Abstract:
Chromatin regulation plays a role in establishing and maintaining cell identity, and is
generally highly dynamic between stem and differentiated cells. The intestinal epithelium is a
monolayer of cells that is replaced every 3-5 days, and is thus a rapidly self-renewing and
differentiating tissue. It is not currently understood how the integrity of the intestinal stem cell
(ISC) genome is maintained or how the identity of a differentiated cell is dictated. Vital to
chromatin regulation and gene expression are epigenetic modifications, such as methylation. The
addition of methyl groups to the nucleotide cytosine silences genes, while demethylation allows
gene expression. Demethylation pathways produce the epigenetic mark
5-hydroxymethylcytosine (5-hmC) as an intermediate. The conversion of 5-methylcytosine (5mC)
to 5-hmC is accomplished by ten-eleven translocation (TET) enzymes, which require co-factors,
such as the micronutrient alpha-ketoglutarate (a key intermediate in the Krebs cycle). Assessing
the global 5-hmC abundance among distinct cellular populations will elucidate this epigenetic
mark’s role in determination of cell fate. To investigate this aim, murine intestinal organoid
cultures were exposed to varying dosages of dimethyl 2-oxoglutarate, a cell permeable form of
alpha-ketoglutarate, in order to modulate TET activity and thus 5-hmC abundance. Through dot
blot analysis of 5-hmC abundance, the ability to modulate the epigenetic mark was assessed.
Results indicate that exposure of intestinal organoids to dimethyl 2-oxoglutarate leads to
phenotypic differences compared to controls, but these differences cannot be attributed to 5-hmC
abundance. Understanding the differences in 5-hmC across cellular populations will provide
insight into the role of epigenetic modifications in regulating gene expression. Furthermore, the
impact of micronutrients on the genome emphasizes the significance of cellular environment for
Introduction:
Each cell in an individual holds the same genome, and yet over one hundred different cell
types arise from this identical sequence of adenines, cytosines, thymines, and guanines. The
human genome is comparable to a book: the nucleotides, letters, are ordered to form genes,
sentences, combinations of which come together to create the proteins that fill and power the
many diverse cells of the body, separate chapters of one complete book. In order for proper
development to occur, every cell must correctly express the genes required to carry out its
specific physiological function. How is this direction of cell fate regulated? Evidence shows that
methylation and demethylation are involved.
DNA methylation is a widespread epigenetic modification; the human genome is >70%
methylated at any given time1. Methylated cytosine, or 5-methylcytosine (5mC), plays a critical
role in gene silencing, genomic imprinting, X chromosome inactivation, as well as the stability
of genomic DNA2. DNA methylation is catalyzed by DNA methyltransferases (DNMTs), three
of which are enzymatically active (DNMT1, DNMT3A, and DNMT3B)3. Errors in DNA
methylation can cause embryonic lethality and cancer4. Cytosine can be demethylated by
recently discovered mechanisms5, presenting 5-hydroxymethylcytosine (5-hmC). As an
intermediate of active demethylation, 5-hmC is involved in the pluripotency of stem cells,
development, and disease6.
The conversion of 5mC to 5-hmC is accomplished by ten-eleven translocation (TET)
enzymes, which are named after the rare (t(10;11)(q22;q23)) translocation commonly seen in
acute myeloid leukemia and lymphocytic leukemia7. There are three TET proteins in the family,
2-oxoglutarate is an intermediate in the Krebs cycle, and the ratio of 2-2-oxoglutarate to succinate
has been shown to impact TET-dependent demethylation9.
Therefore, experimental dosing of organoids with cell permeable forms of 2-oxoglutarate
and succinate can be used to enhance or inhibit the conversion of 5mC to 5-hmC. 5-hmC
abundance has been seen to vary during development and differentiation10. Manipulating the
expression of 5-hmC and understanding the impact that its presence has is the first step in
understanding its role in the regulation of cell fate.
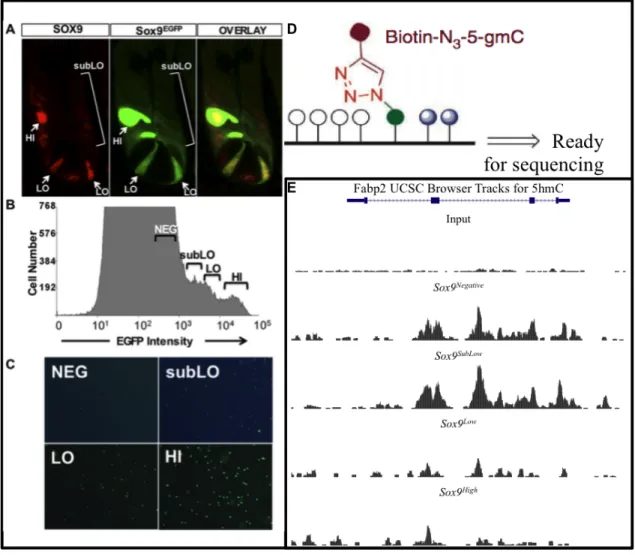
Our lab has previously shown, utilizing a transgenic Sox9EGFPmouse, that populations of
cells expressing different levels of the transcription factor Sox9 correlate to distinct phenotypes11
(Figure 1B). Sox9High marks reserve intestinal stem cells (rISCs), Sox9Lowmarks active intestinal
stem cells (aISCs), Sox9SubLow marks progenitor cells, and Sox9Negative marks differentiated cell
types such as Paneth cells, Goblet cells, and absorptive enterocytes2. The ability to isolate
distinct populations of cells (Figure 1C) from one reporter mouse is advantageous because it
allows for the analysis of the entire intestinal epithelial differentiation landscape (Figure 1A),
from ISCs to post-mitotic cells, enabling us to better comprehend how genetic/epigenetic
changes regulate cell fate. Preliminary sequencing data indicates that 5-hmC is present in all
Sox9EGFP populations. This may in part explain the mechanism of differential expression of
cellular populations in the intestine.
To address this research question our lab has been utilizing advanced sequencing
techniques to map 5-hmC across the landscape of intestinal differentiation. Preliminary 5-hmC
mapping results indicate differential enrichment of 5-hmC across the genome of Sox9
populations (Unpublished data, n=3)(Figure 1E). This analysis was accomplished beginning with
and the isolation of four distinct cell lineages. 5-hmC was then assessed at genes of interest in
these populations using a pull-down technique (hmC-Seal) followed by next-generation
sequencing (NGS).
In order to assess the genomic distribution of 5-hmC large-scale mapping has been
accomplished through multiple different methods. The most “straightforward”12 method is
5-hmC immunoprecipitation, which utilizes antibodies; this method is expensive, and there have
been notable variations in the results obtained from different experiments 13 . CMS
immunoprecipitation involves treatment with sodium bisulphite, which converts 5-hmC to
cytosine methylene sulphonate (CMS); this method recovers DNA regions containing 5-hmC
with high specificity and low background, but it is prohibitively expensive. I chose to optimize
the hmC-Seal pull-down because it provides an advantageous balance of affordability and
accuracy.
To assess the relationship between 5-hmC and transcriptional regulation, I developed
primary murine organoid cultures and treated them with the TET cofactor and cell permeable
5-hmC agonist dimethyl 2-oxoglutarate in order to assess how 5-5-hmC levels impact gene
expression. Organoids are self-organizing three-dimensional structures derived from primary
tissue stem cells that exhibit similar functionality as the tissue of origin14. Organoids were
analyzed phenotypically every two days, and their Paneth cells were counted. Successful
modulation of 5-hmC abundance was validated via dot blot after organoids were lysed.
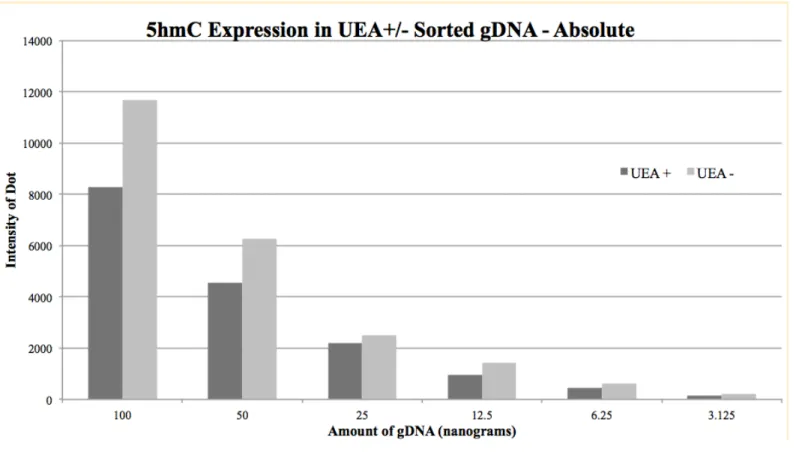
In order to test whether dot blot assays were a viable method of assessing global 5-hmC
expression, a preliminary dot blot was carried out on UEA positive and negative FACS-sorted
cellular populations. UEA is an absorptive enterocyte marker which binds exclusively and
The conversion of 5mC to 5-hmC is an important mechanism to study, as 5-hmC plays a
role in the regulation of gene expression during cellular differentiation, as well as the
maintenance of pluripotency16. Thinking of the genome as a book, we propose that epigenetic
marks, such as 5-hydroxymethylcytosine, act as highlighters, indicating which specific genes the
cell should express. Results indicate that dimethyl 2-oxoglutarate impacts organoid phenotype,
but the causality of this relationship has yet to be attributed to 5-hmC abundance.
Methods:
Mapping 5-hmC across the landscape of intestinal differentiation. Initial 5-hmC mapping was
accomplished via hmC-Seal pull-down. The process begins with the addition of azide-modified
glucose to the hydroxyl group of 5-hmC via T4 β-glucosyltransferase. Another reaction couples
this azide-modified glucose to a biotin molecule (Figure 1D). Streptavidin coated beads bind to
this biotin to allow pull-down. Through this technique, DNA enriched for 5-hmC can be gathered
for downstream analysis by NGS. I optimized this hmC-Seal protocol, focusing specifically on
testing T4 β-glucosyltransferase concentrations in order to increase 5-hmC enrichment
efficiency. Subsequent qPCR analysis was used to validate 5-hmC-seq at selected regions of the
genome where 5-hmC signal is detected (Figure 3).
Furthermore, to enhance the understanding of 5-hmC across the landscape of intestinal
differentiation, cells sorted via FACS based on Sox9 expression representing the four distinct
cellular populations were analyzed via qPCR for TET and DNMT activity, which are crucial for
5-hmC presence. DNMT’s deposit the methyl group on the cytosine, and TETs convert that
methyl group to a hydroxymethyl group, creating 5-hmC. In order to accomplish this,
RNA isolation kit. Subsequently, cDNA was synthesized from the isolated RNA, 1 microliter of
which is added into a qPCR plate that contains a 9 microliter master-mix of SsoAdvanced™
Universal Probe Supermix (5 microliters), molecular grade water (3.5 microliters), and the
TaqMan Probes for the gene of interest (0.5 microliters).
Establishing the functional relationship between 5-hmC and transcriptional regulation. To
assess the impact of 5-hmC on gene transcription in vitro, 5-hmC was modulated through
exposure of primary murine organoids to cell-permeable forms of alpha-ketoglutarate, dimethyl
2-oxoglutarate. Intestinal organoid culture systems allow for in vitro assays that maintain normal
epithelial differentiation and self-renewal. Organoids were established from wild type C57B1/6
mice. Three mice were sacrificed, their jejunums extracted, and the crypts (where the stem cells
reside) isolated. These crypts were concentrated and placed into Cultrex, a three-dimensional
matrix-gel that is liquid at 4 degrees Celsius but polymerizes at room temperature. This matrix
was deposited in a bubble into a 96 well plate. Each well holds a 10 microliter bubble of Cultrex,
which holds about 50 crypts initially, and is covered in 100 microliters of ENR growth media.
ENR growth media contains 84.6% Advanced DMEM/F12, 0.9% Glutamax, 0.9% HEPES
Buffer, 1.8% B27, 0.9% P/S, 0.9% N2, 10% Rspo1, 1,000x Noggin, 10,000x EGF, and 1,000x
Y27 on the first day.
Organoids were allowed to develop for six days before dosing with dimethyl
2-oxoglutarate began. On the sixth day after plating, the organoids were exposed to various
concentrations of either micronutrient (0, 1, 2, 5 and 10 mM) every 48 hours when the ENR
growth media was changed. While exposing these organoids to dimethyl 2-oxoglutarate, I
observed cell survival by counting organoid number per well on the microscope every 48 hours
bud for 20 buds per well while organoids were being dosed. Images (Figure 4A) were taken on
an Olympus IX-81 with a 40X objective.
After the sixth day of dosing with dimethyl 2-oxoglutarate the organoids were ready to be
processed. One third of the organoids were lysed for gDNA to be analyzed via dot blot, one third
of the organoids were lysed for RNA to be analyzed by qPCR, and the remaining third were
fixed and embedded to later be sectioned and stained via immunohistochemistry.
Results:
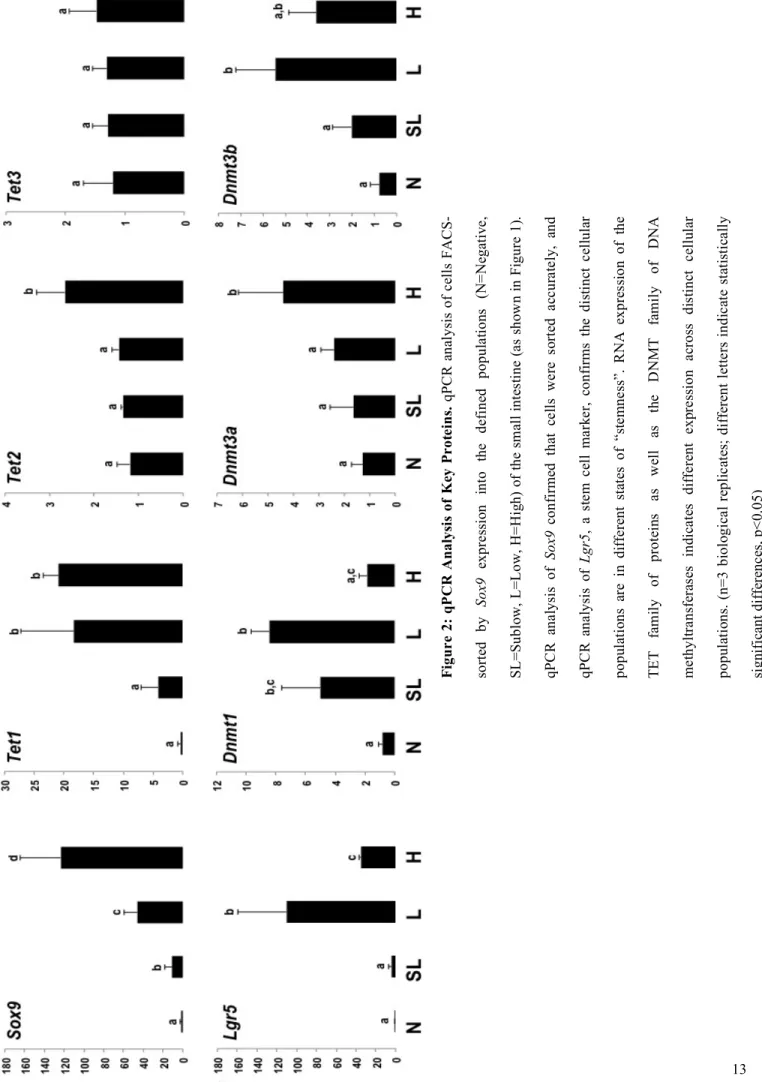
In order to investigate the presence of 5-hmC, the machinery for methylation and
demethylation was also analyzed. Flow cytometry was utilized to sort primary murine cells into
distinct Sox9 populations (Figure 1C). qPCR analysis of RNA transcript levels in FACS sorted
cells indicates that TET proteins, the enzymes which convert 5mC to 5-hmC, are seen to be
expressed at different levels throughout the distinct Sox9 populations of the small intestine
(Figure 2). The family of active DNA methyltransferases, DNMT1, DNMT3A, and DNMT3B,
involved in the methylation of cytosine, are also expressed at different levels throughout the
distinct Sox9 populations (Figure 2).
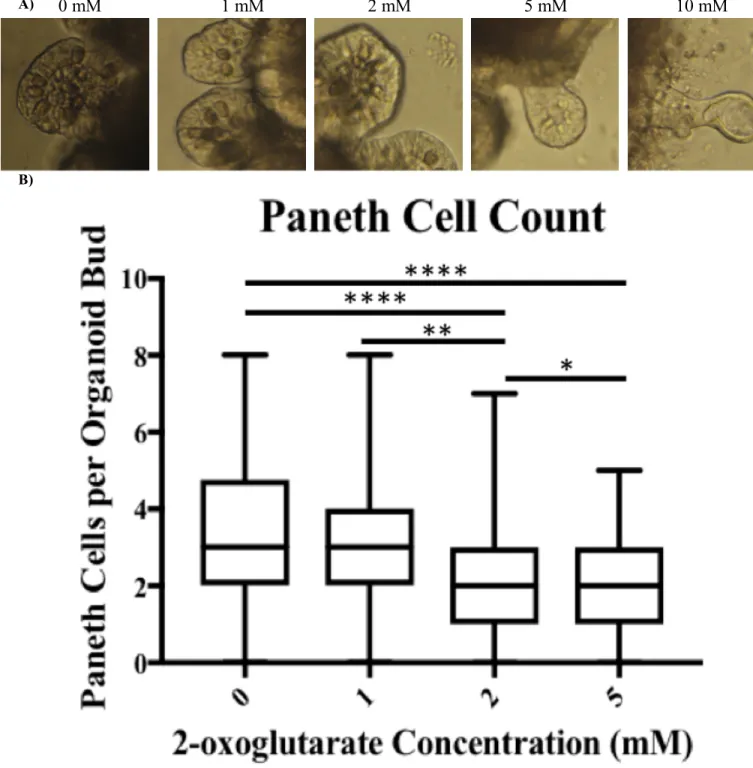
Organoids treated with varying doses of dimethyl 2-oxoglutarate exhibited noticeable
phenotypic differences and altered survival times as compared to control organoids. Six days
after initial dosing with dimethyl 2-oxoglutarate began it was visible that the organoids exposed
to the 10 mM concentration of dimethyl 2-oxoglutarate exhibited different phenotypes (Figure
3A). In the absence of dimethyl 2-oxoglutarate (Figure 3A, Panel 1) a handful of dark and
granular Paneth cells can easily be seen. As the concentration of dimethyl 2-oxoglutarate
unhealthy. This visual phenomenon has been empirically represented in a graph of average
Paneth cell count per bud over the course of the experiment (Figure 3B). 140 buds were counted
for 0 and 1 mM each, 141 buds were counted for 2 mM, and 134 buds were counted for the 5
mM concentration. This data was gathered from six technical replicates of organoids derived
from three biological replicates. No data was collected for 10 mM wells because the organoids
began to die.
Increasing levels of dimethyl 2-oxoglutarate decreases organoid survival. This data is
represented as percentage of initial organoids per well (Figure 5) over the course of the
experiment. This data was gathered from five biological replicates of organoids from two
separate mice.
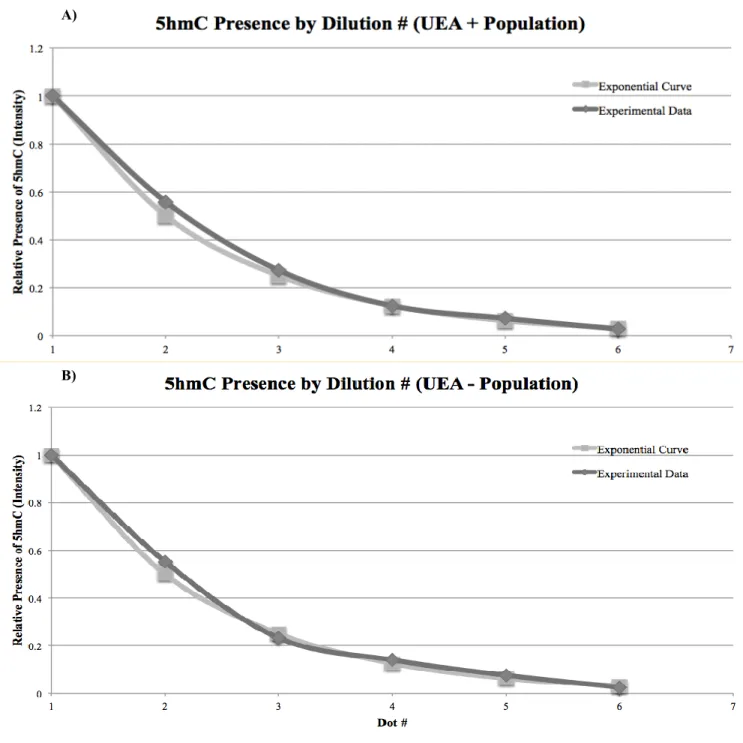
Dot blot validity was assessed by measuring the expression of 5-hmC for serial dilutions
and comparing it to an exponential curve, decreasing by a factor of 2 each dilution. 5-hmC
expression followed an exponential trend down the blot (Figure 7), indicating proper serial
dilution of samples and loading of gDNA onto the nitrocellulose membrane. This dot blot
indicated that UEA positive and UEA negative populations express different amounts of 5-hmC
(Figure 6).
Dot blots analysis of primary murine organoids exposed to dimethyl 2-oxoglutarate are
ambiguous at the moment (Figure 8). Although an initial dot blot indicated that increased
concentration of dimethyl 2-oxoglutarate correlated with increased global 5-hmC expression
(Figure 8A), Methylene Blue analysis of the nitrocellulose blot revealed unequal gDNA
deposition, and therefore improper loading. The second dot blot indicated that increased
concentration of dimethyl 2-oxoglutarate had no impact on global 5-hmC expression (Figure
Discussion:
The different levels of TET and DNA methyltransferase transcripts, as indicated by
qPCR data (Figure 2), across the distinct cellular populations of the small intestine indicates that
methylation and demethylation occur at different levels in these different cellular populations.
Thus, as cells transition from stem to progenitor, and further from progenitor to differentiated
cells, methylation profiles must change. Therefore, 5-hmC, as a mark of active demethylation
pathways, is an attractive mark to analyze epigenetic regulation of cell fate and differentiation.
qPCR analysis of hmC-Seal pull-down products showed enrichment for 5-hmC over
genes Adh6a and Fabp2, absorptive genes, compared to Sox2 and MyoD1 loci, which are
involved in renewal and muscle development, respectively. It was confirmed that 5-hmC
presence varies across cellular populations within the small intestine by carrying out a dot blot of
gDNA of cells sorted into UEA positive and negative subpopulations (Figure 5). Cells that were
sorted into a UEA-negative subpopulation expressed more global 5-hmC in their gDNA than
cells from the same mouse sorted into a UEA-positive subpopulation.
Initially, dot blot analysis of organoid gDNA from this experiment implied that global
5-hmC was increased by exposure to higher concentrations of dimethyl 2-oxoglutarate (Figure
6A). However, a subsequent dot blot of organoid gDNA from a biological replicate indicated that
5-hmC was not expressed at different levels in organoids exposed to various concentrations of
dimethyl 2-oxoglutarate (Figure 7A). Both of the dot blot results were confirmed by staining the
nitrocellulose blots for whole gDNA presence with Methylene Blue. Methylene Blue staining
confirmed that the first blot was incorrectly executed (unequal distribution of gDNA across blot,
Figure 7B). However, if the second blot is accurate, this implies that 5-hmC presence is
unaffected by increased exposure to dimethyl 2-oxoglutarate.
Although results have shown that 5-hmC is differentially expressed across different
populations, the capability to modulate 5-hmC in vivo has not yet been validated via dot blot, but
phenotypic results indicate a biological response to exposure to dimethyl 2-oxoglutarate. This
may be attributable to the fact that the family of TET proteins contains three enzymes, all of
which have slightly different functions, and dimethyl 2-oxoglutarate most likely impacts other
aspects of cellular metabolism. Future experiments will analyze TET protein expression via
qPCR to validate that TET mediated demethylation is increasing due to the dimethyl
2-oxlogutarate, in order to identify the mechanism of the phenotypic changes observed.
Acknowledgements:
I would like to thank my PI, mentor, and friend Dr. Adam Gracz for all of his help and
Figures:
Figure 1:Population Identification and 5-hmC Enrichment. A)Sox9EGFP is an accurate reporter in the intestinal crypt, because it recapitulates endogenous Sox9 expression. B) Flow cytometric analysis illustrates distinct levels of
Sox9EGFP expression within intestinal epithelium. C) Single cells sorted by FACS into discrete populations. Sox9Neg
marks differentiated cells, Sox9SubLow marks progenitor (transit-amplifying) cells, Sox9Low marks active intestinal
stem cells (aISCs), and Sox9High marks reserve intestinal stem cells (rISCs). D) hmC-Seal pull-down requires several
Figure 3: hmC-Seal Enriches for 5-hmC Positive Regions. hmC-Seal-qPCR indicates that Adh6a and Fabp2 loci are enriched for 5-hmC, while Sox2 and Myod1 loci are not. Sox2 and Myod1 signal is considered background noise. Optimized protocol, which utilizes 2X T4BGT, is currently providing a 6.57-fold enrichment of signal over noise.
Figure 4: Analysis of Paneth Cells (darker, granular cells) in buds of organoids. A) Organoids were exposed to different dosages of 2-oxoglutarate, 0 mM through 10 mM. Images taken 6 days after dosing, 12 days after plating.
B) Average observed Paneth cell count per organoid bud. Mice, n=3. Technical replicates, n=6. Buds counted, n=140, 140, 141, 134 for 0, 1, 2, 5 mM 2-oxoglutarate dosages, respectively. Bars represent standard deviation. No data is presented for 10 mM because organoids did not express Paneth cells.
0 mM 1 mM 2 mM 5 mM 10 mM
A)
A)
B)
Figure 8: 5hmC Dot Blot. A) ECL Imaging of 5hmC signal from whole gDNA of organoids treated with 2-oxoglutarate. 2-oxoglutarate concentrations indicated above each column. B) Blots were also analyzed via Methylene Blue. C) ECL imaging of 5-hmC signal from whole gDNA of organoids treated with 2-oxoglutarate, different biological replicate than seen in panel A. D) Blots was analyzed via Methylene Blue to confirm gDNA presence in nitrocellulose membrane.
A) B)
0 1 2 5 mM 0 1 2 5 mM
5-hmC Dot Blot Methylene Blue
C) D)
0 5 0 5 mM 0 5 0 5 mM
Works Cited
1Schroeder, Diane I., et al. "Large-scale methylation domains mark a functional subset of neuronally expressed genes." Genome research 21.10 (2011): 1583-1591.
2Deaton, Aimée M., and Adrian Bird. "CpG islands and the regulation of transcription." Genes & development 25.10 (2011): 1010-1022.
3 Jin, Bilian, and Keith D. Robertson. "DNA methyltransferases, DNA damage repair, and cancer." Epigenetic Alterations in Oncogenesis. Springer, New York, NY, (2013). 3-29.
4Feinberg, Andrew P., and Benjamin Tycko. "The history of cancer epigenetics." Nature Reviews Cancer 4.2 (2004): 143.
5 Kohli, Rahul M., and Yi Zhang. "TET enzymes, TDG and the dynamics of DNA demethylation." Nature 502.7472 (2013): 472-479.
6Branco, Miguel R., Gabriella Ficz, and Wolf Reik. "Uncovering the role of 5-hydroxymethylcytosine in the epigenome." Nature Reviews Genetics 13.1 (2012): 7.
7Lorsbach, R. B., et al. "TET1, a member of a novel protein family, is fused to MLL in acute myeloid leukemia containing the t (10; 11)(q22; q23)." Leukemia 17.3 (2003): 637.
8Iyer, Lakshminarayan M., et al. "Prediction of novel families of enzymes involved in oxidative and other complex modifications of bases in nucleic acids." Cell cycle 8.11 (2009): 1698-1710. 9Carey, Bryce W., et al. "Intracellular α-ketoglutarate maintains the pluripotency of embryonic stem
cells." Nature 518.7539 (2015): 413.
10Ruzov, Alexey, et al. "Lineage-specific distribution of high levels of genomic 5-hydroxymethylcytosine in mammalian development." Cell research 21.9 (2011): 1332.
11Gracz, Adam D., Sendhilnathan Ramalingam, and Scott T. Magness. "Sox9 expression marks a subset of CD24-expressing small intestine epithelial stem cells that form organoids in vitro." American Journal of Physiology-Gastrointestinal and Liver Physiology 298.5 (2010): G590-G600.
12Pastor, William A., L. Aravind, and Anjana Rao. "TETonic shift: biological roles of TET proteins in DNA demethylation and transcription." Nature reviews Molecular cell biology 14.6 (2013): 341. 13Wu, Hao, et al. "Genome-wide analysis of 5-hydroxymethylcytosine distribution reveals its dual
function in transcriptional regulation in mouse embryonic stem cells." Genes & development 25.7 (2011): 679-684.
14 Fatehullah, Aliya, Si Hui Tan, and Nick Barker. "Organoids as an in vitro model of human development and disease." Nature cell biology 18.3 (2016): 246-254.
15 Albers, Theresa M., and Ronda P. Moore. "Use of a lectin as an enterocyte‐specific cell surface marker for flow cytometric analysis of isolated native small intestinal epithelial cells." Cytometry Part A 23.1 (1996): 72-77.