Community Water Systems vs Private Wells:
A Comparison of Water Quality on the Fringes of Municipalities
Frank Joseph Stillo III
A technical report submitted to the faculty at the University of North Carolina at Chapel Hill in partial fulfillment of the requirements for the degree of Master of Science in Public Health in the Environmental Sciences and Engineering Department in the School of Public Health.
Chapel Hill 2014
Approved by:
Jackie MacDonald Gibson
Jill Stewart
ii
© 2015
iii
Frank Joseph Stillo III: Community Water Systems vs Private Wells: A Comparison of Water Quality on the Fringes of Municipalities
(Under the direction of Dr. Jackie MacDonald Gibson) Abstract.
Over the last 100 years, the installation of community water systems in the United States has led to
substantial decreases in waterborne diseases, virtually eliminating previously common infectious diseases such as typhoid and cholera. However, throughout the American South, some communities were excluded from municipal water supply services as a result of racial segregation, and some of the resulting disparities in water service persist. The quality of well water in such excluded communities and the resulting health implications are not well understood. We collected water samples from private wells in 57 households selected at random from majority African American census blocks in Wake County, North Carolina, that have been historically excluded from municipal water supply service, and we compared the microbiological quality of water in these households to the quality of water distributed by nearby Wake County Community Water Systems. Each household was sampled three times over six months and tested for three types of indicator bacteria: total coliforms, Escherichia coli, and Enterococci.In addition, we used a population intervention model to characterize the cases of acute gastrointestinal illness emergency department visits that could be avoided if community water service were available to all 1,220 people in such excluded communities of Wake County. Overall, 29.2% of samples tested positive for total coliform bacteria, compared to 0.566% of samples in the adjacent CWSs. At the household level, 49% tested positive for total coliform bacteria at least once, and 65% tested positive for any of the three indicator organisms. The population intervention model estimated that 0.703 (95% CI: 0.482-0.994) emergency department visits for acute gastrointestinal illness, representing 21% of all such visits, could be avoided per month if the entire study population of 1,220 people were connected to the community water system. We conclude that private well users have lower water quality than their neighboring community water system users, potentially causing undue health effects for consumers. Extension of
iv
ACKNOWLEDGEMENTS
Warmest regards to my advisor, Dr. Jackie MacDonald Gibson, for taking a chance and bestowing on me her experience and wisdom. When life bites you, keep working hard and your goals will end up behind you. I would also like to thank my committee members, Dr. Jill Stewart and Dr. Joachim Pleil for accepting the task of revising and advising me through the Master’s Technical Report. I am very grateful to all my research assistants for all their hard work and time: Anna Ballasiotes; Jamie Sabo; Daisy Wang; Joe Strasser; Heather Dew; Yuyun Liang; Brenda Benavides; Yang Du; and Chelsea Fizer. We are all grateful for the experience of using Dr. Mark Sobsey’s lab and all the wonderful help and advice that Emily Bailey gave in the lab. I would also like to express my gratitude to all of my participants. Without their water, this research would not have been possible. I am so grateful for my friends and family, Meiji Tran, for their ongoing support and
v
T
ABLE OFC
ONTENTSList of Tables ... vi
List of Figures ... vii
List of Abbreviations ...viii
1. INTRODUCTION...1
2. METHODS AND MATERIALS ...2
3. RESULTS ...8
4. DISCUSSION ...14
5. CONCLUSION ...18
Appendix 1: Recruitment Mailer Script...19
Appendix 2: Telephone Recruitment and Survey Script ...20
Appendix 3: Sampling Protocol and Chain of Custody ...21
Appendix 4: Sampling Data ...22
vi
L
IST OFT
ABLESTable 1: Causal Inference model inputs and parameters ...7
Table 2a: Percent positive samples per month for private wells separated by indicator organism in ETJ of Wake County, NC (2014)...9
Table 2b: Percent positive samples per month for public water supply in Wake County, NC (2006-2013) ...9
vii
L
IST OFF
IGURESFigure 1: Sampling area of residents on private drinking well systems in Wake County, NC ...3
Figure 2. – Household level comparison between indicator organisms sampled from Wake Co., NC...8
Figure 3a: Concentration of total coliform from private wells in Wake County, NC ...10
Figure 3b: Concentration of E. coli from private wells in Wake County, NC ...11
Figure 3c: Concentration of Enterococcus from private wells in Wake County, NC ...11
Figure 4. WHO risk classification of E. coli concentrations of positive samples in Wake County, NC ...12
Figure 5a: Well Age for Private Wells in Wake Co., NC ...13
viii
List of Abbreviations
NC North Carolina
ETJ Extra Territorial Jurisdiction
CWS Community Water System
FIB Fecal Indicator Bacteria
MPN Most Probable Number
TC Total Coliform Bacteria
P/A Presence/ Absence
EPA Environmental Protection Agency
TNTC Too Numerous To Count
AGI Acute Gastrointestinal Illness
MCL Maximum Contaminant Level
1 1. Introduction
Access to community water supply systems (CWSs) has greatly reduced the incidence of waterborne disease over the last 100 years in the United States.1 Nonetheless, some communities lack access to CWSs and the health protections these systems provide. According to the 2010 United States Geological Survey, 86% of the U.S. population and 65% of the North Carolina (NC) population are served by public water systems, defined as those that are either publicly or privately owned and serve at least 25 people or at least 15 service connections year-round.2,3 While most of the NC homes unserved by CWSs are in rural areas where extending municipal water lines is difficult due to the large distances between households, evidence suggests that tens of thousands of unserved homes are on the fringes of cities in towns in close proximity to municipal water lines, in areas known as extraterritorial jurisdictions (ETJs). ETJ residents are part of municipal planning and subject to the municipality’s development regulations but have limited opportunities to influence land use decisions, in part because they cannot vote in municipal elections.4 Several studies have documented that some communities in ETJs lack basic amenities, such as water and sewer service for residents, despite being adjacent to public infrastructure, and that exclusion from these amenities is in part a legacy of Jim Crow-era racial segregation.5–7 A recent study of ETJ communities in Wake County, NC, found that the odds of exclusion from public water systems increased as the African American population increased, indicating possible racial disparities in access.6 In a qualitative study of three communities across NC, the common theme influencing access to water infrastructure among stakeholders was financing for projects. Due to a lack of water quality data and
quantitative risk assessment, it was also found that municipal officials involved in decision making to extend community water service to the unincorporated communities were largely unaware of the potential health risks of lack of CWS service.8
Water quality for CWS consumers is well established because of monitoring and treatment standards, but this is not the case for private well water consumed by ETJ residents who reside on the fringes of CWSs.
2
quality for these residents. Poor water quality could lead to elevated health risks, but the magnitude of this risk in NC ETJ communities is currently unknown.
This research has three main objectives: (1) determine the microbiological water quality of private wells in predominantly African American census blocks in ETJs of Wake County, NC, using fecal indicator bacteria (FIB); (2) compare the quality of water between these wells to that in the nearby City of Raleigh CWS; and (3) perform a risk assessment to estimate health risks associated with exclusion from CWS service. The population for this study consists of 1,220 residents of Wake County ETJs in census blocks with greater than 50% African American population proportion. Studying the microbiology and health risks associated with private wells upon which these residents rely can inform future debates about the benefits of extending CWSs to these under-served areas.
2. Methods and Materials
2.1Source of Community Water System Data
The major CWS in Wake County, NC is the City of Raleigh public system. This CWS serves 500,000 people in Raleigh, Garner, Wake Forest, Rolesville, Knightdale, Wendell, and Zebulon areas.9 To complete Wake County’s CWS service, infrastructure has been built for the rest of the county’s cities and towns, mobile parks, and other communities of 15 households or more. Microbial testing data was procured from Wake County Environmental Services Department for all microbial water testing in the Wake County CWS.10 This data was used to compare against the private well water system.
2.2Population Determination and Participant Recruitment
3
Recruitment letters gave a brief description of the study and offered each participant who completed the study a $25 gift card. The completion of the study required participants to answer a short telephone survey and allow for three water samples to be collected from their home. (Appendix 1)
The telephone survey involved a brief project description, reiterated our offer of a $25 gift card upon completion of the project, and asked the following questions: (Appendix 2)
Are you on a community water system?
Are you willing to participate in this study as a volunteer?
Do you have a septic tank and do you know the age of that system?
What is the approximate age of your well?
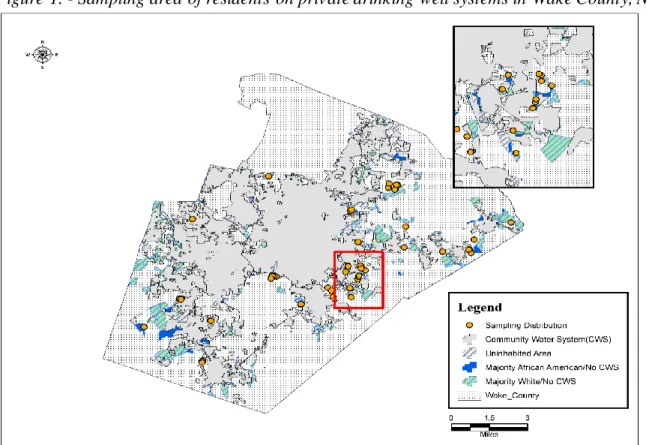
This study was granted exemption status by the Institutional Review Board after all research assistants obtained Collaborative Institutional Training Initiative human research curriculum training. Figure 1 shows a map of Wake County, NC and the distribution of our participants.
Figure 1. - Sampling area of residents on private drinking well systems in Wake County, NC
4 2.3 Sampling Design
The revised total coliform rule of the Code of Federal Regulations (40 CFR 141.21) requires monitoring of indicator organisms by CWS dependent on the size of the population served.11 In order to compare our results directly to the CWS, aseptic sampling procedures were inherited from Wake County Department of Environmental Services and were strictly followed.12 Sampling was conducted by research assistants who were trained in the sampling and lab safety protocols. The sampling protocol involved the following: Samplers must wash their hands and/or wear gloves before each sampling; run the tap water on cold for five minutes prior to sampling; keep all objects from touching the rim or inside of the sampling container prior to fill; and store samples on ice immediately after sampling. (Appendix 3)
Quality control for sampling containers was performed by the lab personnel for all containers prior to use. Each sampling container was autoclaved prior to use and stored on ice until sampling began. If any container was thought to become contaminated, it was discarded and replaced. If the contamination happened either during or after the sample was taken, that too was discarded and a new sample taken. After the five minute period elapsed and a 500mL grab sample was taken, it was labeled and immediately put in a cooler on ice. After all samples were collected for the day, the samples were transported to the laboratory and stored in a 4°C cooler until testing.
Testing of each sample was completed 1 to 5 days from the sampling date. Each household was sampled three times at 2 to 8 week intervals.
2.4 Detection of Indicator Species by Colilert
In the Standard Methods for the Examination of Water and Wastewater, IDEXX systems that conform to the current multi-well enzyme substrate method (SM#9223) and Most Probable Number (MPN) index were used.13 Our study identified IDEXX Colilert® and Enterolert® in conjunction with the Quanti-Tray®/2000 enumeration system as most appropriate for our study. We chose these systems for their sensitivity in
5
Undiluted samples followed exact testing procedures of the IDEXX systems for MPN enumeration and presence/absence (P/A) of the fecal indicator bacteria total coliforms (TC), E. coli, and Enterococci with one exception. Colilert® was incubated per instructions, and Enterolert® was incubated at 44.5 ± 0.5°C instead of 41± 0.5°C in order to be more selective for bacteria normally found in the human gut.14 All other laboratory standards were in line with the Environmental Protection Agency (EPA) “Manual for the Certification of Laboratories Analyzing Drinking Water.”15
All results were calculated in MPN/100mL concentrations, and if a positive test could not be enumerated, we truncated the mean at MPN 2419.6 (test max) and the upper 95th percentile at too numerous to count (TNTC) to avoid more complicated dilution techniques. Furthermore, we utilized IDEXX MPN generator software program version 1.4 to calculate MPN and 95th percentile values.
2.5 Statistical Analysis
Statistical analysis and modeling was performed using Microsoft Excel 2013 and Analytica Free 101 Edition (Release 4.5.3.31, 4 Feb 2014) by Lumina Decision Systems. To compare the quality of drinking water for both public and private water, we standardized the data into percent positive samples for each indicator organism. Since publicly available data only shows the P/A of indicator organisms, summary statistics were calculated for both public and private data as percentage positive tests. A one tailed T test was used to determine if the private water supply differed from the public water supply significantly.
A causal inference model, developed in previous research by DeFelice et. al., was used to estimate the number of acute gastrointestinal illness (AGI) emergency department visits that could be avoided per month if the entire population of residents of majority black ETJ census blocks relying on domestic wells were connected to the community water system.16 DeFelice et al. developed this causal inference model by fitting a panel
6
ln(Y𝑖,𝑗/𝑁𝑖,𝑗) = 𝛼 + 𝛽1𝐶CWS𝑖,𝑗+ 𝛽2𝐸CWS𝑖,𝑗+ 𝛽3𝐶DWS𝑖,+ 𝛽4𝑃𝑜𝑣𝑖+ 𝛽5𝐸𝐷𝑖+ +𝛽6𝐼𝑖+ (∑9 𝛽𝑙
𝑙=7 R𝑙) +
(∑20 𝛽𝑚
𝑚=10 t𝑚) + μ𝑗 (Equation 1)
where Yi,jis the number of AGI ED visits in county i during month j, Ni,j is the county population, α is a constant, CCWS,i,j is the population proportion exposed to a monthly MCL violation during month j (determined by assuming all customers of a CWSs with monthly MCL violations were exposed), ECWSi,jis the population proportion exposed to an acute MCL violation, CDWS,iis the population proportion potentially exposed to
coliform bacteria in private wells (determined by multiplying the fraction of private wells testing positive by the proportion of the county population served by private wells), Pov,iis the proportion of the population in poverty,
EDiis a binary indicator of whether or not the county has an emergency department, Ii is a binary indicator of whether the county health uninsurance rate exceeds the median rate for North Carolina (16%), Ri indicates the region of the state where the county is located (Coastal Plain, Piedmont and Mountain), and tj,mis an indicator of month (with January serving as the reference month), and uj is a first-order autoregressive error term.,.
To estimate the avoided AGI cases if all unserved 1,220 residents were connected to CWSs, Equation 1 was first applied under current conditions and then assuming a counterfactual scenario in which all residents are connected to CWS, and the difference was computed. Under current conditions, since there are no CWS users,
CCWS and ECWS are both zero. Under the counterfactual scenario, CDWS is zero, since the residents no longer rely on domestic wells. Hence, the fraction of AGI cases that could be prevented (the attributable fraction, AF) can be estimated from:
𝐴𝐹 = 1 −exp(ln(
Y𝑖,𝑗,𝑐𝑜𝑢𝑛𝑡𝑒𝑟𝑓𝑎𝑐𝑡𝑢𝑎𝑙 𝑁𝑖 ))
exp(ln(Y𝑖,𝑗
𝑁𝑖))
= 1 −exp(𝛽1𝐶CWS𝑖,𝑗+𝛽2𝐸CWS𝑖,𝑗)
exp(𝛽3𝐶DWS𝑖,) (Equation 2)
7
obtained from the NC Department of Environment and Natural Resources as compiled by DeFelice et al.(Table 1). 10,16CDWS was estimated from the percentage of wells testing positive for coliform bacteria in this study.
Finally, to determine the avoided cases per month of ED visits for AGI if the counterfactual scenario were true, we used equation 3:
Avoided Cases= AF* (R*P) (Equation 3)
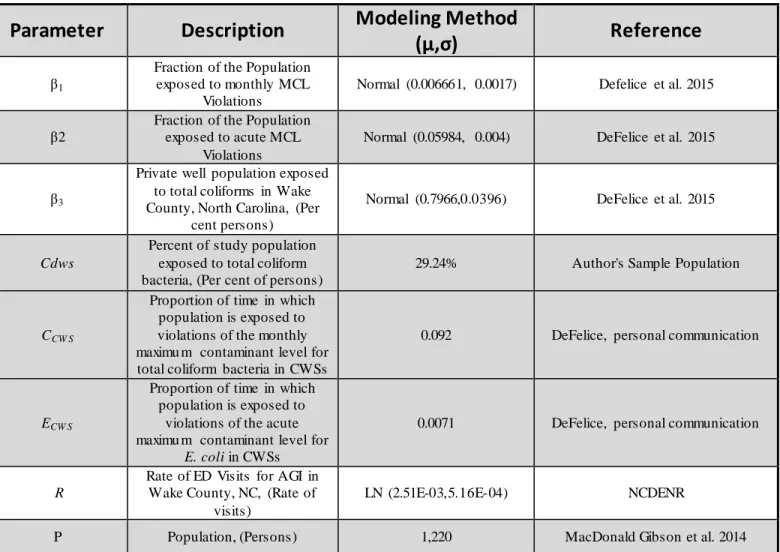
where R is the annual rate of ED visits for AGI in Wake County represented from data collected between 1/2007 and 10/2013,10and P is the population of residents who live in the Wake County ETJ and are in majority African American census blocks in 2012.6 Table 1 shows the model inputs and parameters used in the
calculation.
Table 1. Model Inputs and Parameters
Parameter
Description
Modeling Method
(μ,σ)
Reference
β1
Fraction of the Population exposed to monthly MCL
Violations
Normal (0.006661, 0.0017) Defelice et al. 2015
β2
Fraction of the Population exposed to acute MCL
Violations
Normal (0.05984, 0.004) DeFelice et al. 2015
β3
Private well population exposed to total coliforms in Wake County, North Carolina, (Per
cent persons)
Normal (0.7966,0.0396) DeFelice et al. 2015
Cdws
Percent of study population exposed to total coliform bacteria, (Per cent of persons)
29.24% Author's Sample Population
CCW S
Proportion of time in which population is exposed to violations of the monthly maximu m contaminant level for total coliform bacteria in CWSs
0.092 DeFelice, personal communication
ECW S
Proportion of time in which population is exposed to
violations of the acute maximu m contaminant level for
E. coli in CWSs
0.0071 DeFelice, personal communication
R
Rate of ED Visits for AGI in Wake County, NC, (Rate of
visits)
LN (2.51E-03,5.16E-04) NCDENR
P Population, (Persons) 1,220 MacDonald Gibson et al. 2014
8 3. Results
3.1 Fecal Indicator Bacteria Presence/Absence Testing
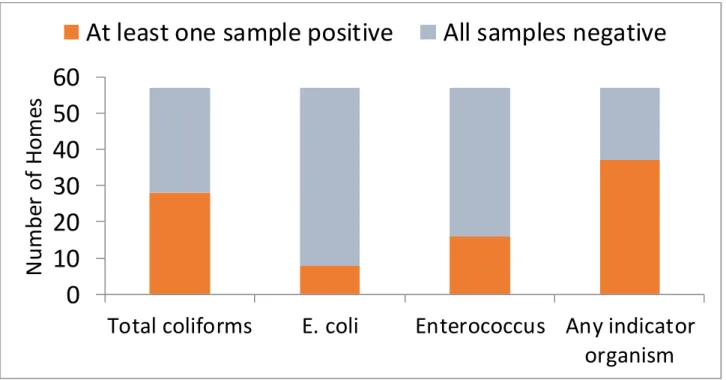
Total coliform, Escherichia coli, and Enterococci indicator bacteria were tested for P/A and enumerated for concentration during this study. P/A testing data derived from tap water sampled from each of the 57 households at three separate time intervals over a period of six months. At the household level, 49% tested positive for TC at least once and 65% tested positive for any of the three indicator organisms. Figure 2 shows a comparison across indicator organisms at the household level.
Figure 2. – Household level comparison between indicator organisms sampled from Wake Co., NC
Tables 2a and 2b compare water quality between the private well water sampled in this study and the adjacent community water systems in Wake County. Of the 171 samples drawn from households with private wells, 50 (29.2%) were positive for total coliform. The results of tests for indicator organisms other than TC are not directly comparable, because we tested all private well samples for each indicator, whereas CWS testing procedures follow the EPA’s Total Coliform Rule, under which only TC positive samples are tested for E.coli.11 Nonetheless, the magnitude of the difference between the private wells and the neighboring CWS when
0
10
20
30
40
50
60
Total coliforms
E. coli
Enterococcus Any indicator
organism
N
um
be
r
o
f
H
o
m
es
9
considering all indicators is worth noting: 32.2% of private well samples tested positive for any indicator organism compared to 0.567% of CWS samples.
Table 2a. - Percent positive samples per month for private wells sampled in
this study (2014)
Total Coliform E.coli Enterococci Any Indicator
July (n=14) 35.7% 7.1% 7.1% 35.7%
August (n=30) 13.3% 0.0% 3.3% 16.7%
September (n=32) 28.1% 0.0% 31.3% 31.3%
October (n=26) 46.2% 3.0% 15.4% 53.8%
November (n=16) 12.5% 0.0% 6.3% 18.8%
December (n=53) 34.0% 13.2% 3.8% 34.0%
Total (n=171) 29.2% 6.43% 11.1% 32.2%
IDEXX Colilert and Enterolert testing systems were used to find indicator organisms of private well water samples taken from 57 houses (each sam pled 3 tim es) in Wake County, NC; n is the num ber of sam ples
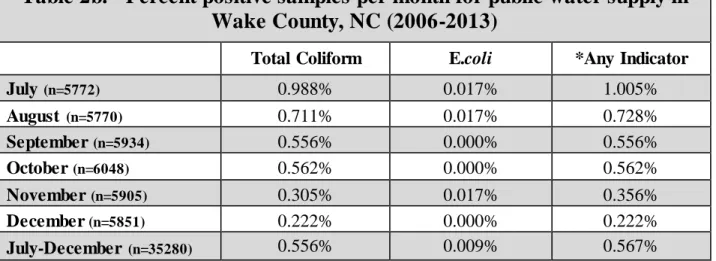
Table 2b. - Percent positive samples per month for public water supply in
Wake County, NC (2006-2013)
Total Coliform E.coli *Any Indicator
July (n=5772) 0.988% 0.017% 1.005%
August (n=5770) 0.711% 0.017% 0.728%
September (n=5934) 0.556% 0.000% 0.556%
October (n=6048) 0.562% 0.000% 0.562%
November (n=5905) 0.305% 0.017% 0.356%
December (n=5851) 0.222% 0.000% 0.222%
July-December (n=35280) 0.556% 0.009% 0.567%
*Any Indicator is all indicators tested. Note that no further testing is completed if sample is negative for total coliform. Data retrieved from North Carolina Department of Environment and Natural Resources Public Water Supply Section. March 12, 2014, contact via email.10
Acute maximum contaminant level (MCL) violations are when an EPA regulated contaminant exceeds its MCL. For TC, a monthly MCL violation occurs if more than 5% of samples test positive in any given month. Our sampling would have incurred a monthly MCL violation for all months tested if one considers the study households as representing the equivalent of a water system. For E. coli, the MCL is 0.0 MPN/100mL in any sample per month, therefore any detection of E. coli violates the acute MCL.11
10 3.2 Fecal Indicator Bacteria Concentrations
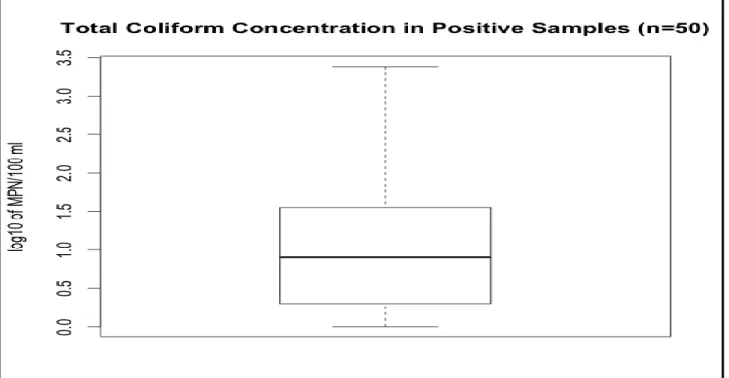
Most probable number concentrations for TC ranged from 0 to 2,419 MPN/100mL, E.coli from 0 to 150 MPN/100mL, and Enterococci from 0 to 71.7 MPN/100mL. Figures 3a, 3b, and 3c show box and whisker plots of concentrations (MPN/100mL) and Table 3 shows summary statistics for all positive samples from private wells in our study population. Two samples in October exceeded the detection limit of the Colilert®/Quanti tray 2000 enumeration system for total coliforms.
11
Figure 3b. – Concentration of E. coli from private wells in Wake County, NC
12
Table 3. - Summary statistics for Within Positive samples of private well water in Wake County, NC
Month
Total Coliform (MPN) E.coli (MPN) Enterococci (MPN)
GeoMean (GeoSD) Max MPN GeoMean (GeoSD) Max MPN GeoMean (GeoSD) Max MPN
July 12.7 (7.6) 185.0 1.0 (*) 1.0 12.1 (*) 12.1
August 2.3 (2.8) 8.6 0.0 (**) 0.0 1.0 (*) 1.0
September 3.8 (3.8) 18.5 0.0 (**) 0.0 1.0 (1.0) 1.0
October 29.9 (13.6) 2419.6 8.4 (12.1) 150.0 1.9 (2.4) 6.3
November 23.0 (2.4) 43.2 0.0 (**) 0.0 2.0 (*) 2.0
December 12.3 (7.2) 866.4 3.3 (2.6) 14.2 14.9 (9.2) 71.7
Jul-Dec 11.0 (7.9) 2419.6 3.8 (4.5) 150.0 1.8 (3.0) 71.7
Most probable Number (MPN) is the number of colonies per 100 mL. Testing was completed using IDEXX Colilert and Enterolert systems. Max MPN is the maximum concentration over all positive samples for that month.
*Only one sample tested positive during July for E.coli**Indicates no samples tested positive in that month.
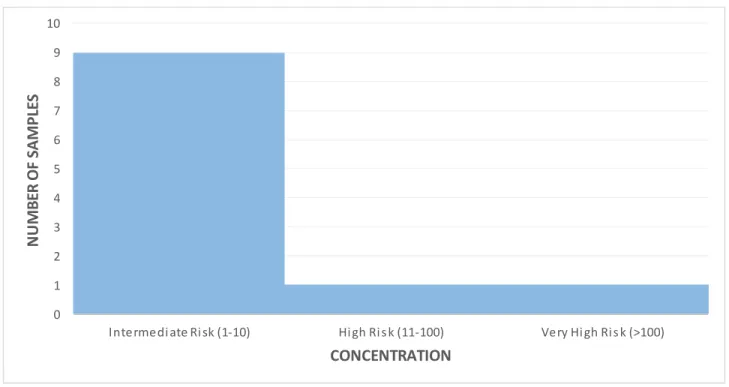
The World Health Organization classifies E.coli concentrations in drinking water into three categories of risk: Intermediate risk (1-10 MPN/100mL); high risk (11-100 MPN/100mL); and very high risk (>100
MPN/100mL).17 Individual sample results for E. coli found 9 samples were of intermediate risk, 1 sample was high risk, and 1 sample was very high risk. Figure 4 shows a histogram of E. coli concentrations (MPN/10mL) organized following the WHO classifications.
Figure 4. - WHO risk classification of E. coli concentrations of positive samples in Wake County, NC 0 1 2 3 4 5 6 7 8 9 10
Intermedi ate Ri sk (1-10) Hi gh Ri s k (11-100) Very Hi gh Ri s k (>100)
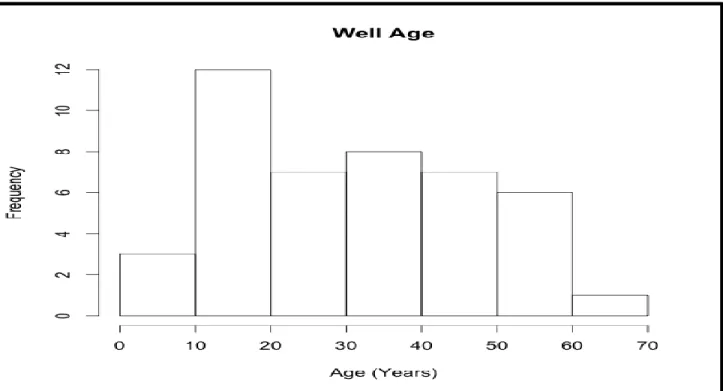
13 3.3 Well and Septic age
Well and septic system age (figures 4a and 4b) was given by most residents. In total, 44 residents responded with well age and 47 residents responded with septic tank age. The median (mean) age of wells and septic systems was 30.5 (32.0) years and 20 (25.7) years respectively.
14
Figure 5b. - Septic Tank Age for Private Wells in Wake Co., NC
3.4 Causal inference model
The causal inference model estimated that 0.703 cases per month (95% CI: 0.482-0.994) of ED visits for acute gastrointestinal illness could be avoided if CWS service were extended to the entire study population of 1,220 (Figure 4). These potentially avoidable cases represent 21% (95% CI: 19-23%) of all ED visits for AGI expected to occur among members of this population.
4. Discussion
4.1 Disparity in water quality
15
households tested positive for at least one of the three indicator organisms for our study, which suggests that management of microbial contamination for private wells is not being accomplished by the households tested. The high percentage of households that tested positive for fecal indicator bacteria indicates that these residents are potentially ingesting more pathogens than those served by the CWS.
Our findings are similar to those of other recent studies of private well water quality in North America. Testing results for the P/A of total coliforms from our study found a lower prevalence than the most recent national study of domestic wells from the 2006 U.S. Geological Survey Report, which found 33% of wells tested positive for TC.18 A study of private wells in Virginia by Pieper et. al. found 46% of samples tested positive for TC.19 Additionally, a study of rural households relying on private wells in Ontario, Canada, found that water from more than one-third of households tested positive for coliform bacteria.20
When samples are separated by month from the date sampled, this study found the equivalent of 11 acute MCL violations for E.coli among private wells in our study population or 6.43% of all samples. This is lower than the national percentage found by the 2006 U.S. Geological Survey Report (7.8%) and results found in Virginia by Pieper et. al. (10%).18,19
Previous studies have found that microbiological contamination of well water increases with the spatial density of septic systems.21,22 In our study, all of the homes relied on private single family septic systems. The density of septic systems in these communities thus could contribute to the observed high frequency of
occurrence of fecal indicator organisms in the well water.
4.2 Disparity in monitoring and treatment
16
wells using the fee schedule from their local Department of Health and Human Services.24 Wake County also provides software called iMAPS which has collected data for wells installed since 1998 and those assessed by Environmental Services.25 Our study found a median well age of 30.5 years old, which suggests most wells are lacking any regulation or data collection (Figure 3a). According to the 2003 Wake County Comprehensive Groundwater Assessment Final Report, among the recommendations was the creation of a well water quality database for the estimated 37,000 private wells in the county.26 Currently, this has yet to be accomplished due to lack of data, especially from older wells.
Lack of water quality data has been cited in numerous papers over the last 30 years.1,5,8,27,28 Data is especially sparse for wells prior to 1998, leaving well water quality to be inadequately measured to date. This is the first study to measure water quality for residents adjacent to the CWS that rely on private well systems. Due to the very limited state regulations on private wells (requiring an initial test of new wells but no subsequent monitoring and no testing of existing wells), citizens lacking training in well management are left to manage their water quality. Our study results suggests that this approach has left such communities at much greater risk of exposure to microbial contaminants in their drinking water than neighboring communities connected to the CWS.
4.3 Causal inference model
17 4.4 Limitations
This study was limited in the number of samples taken. All told, the sampled households represented, 6% of the homes in the majority African American census blocks in Wake County ETJs. Random recruitment of study participants helped to decrease the effects of this limitation and enables the generalization of the sample results from the studied homes to the rest of the population.
The causal inference model demonstrates statistical association, but does not prove causation. To establish with certainty the magnitude of risks associated with private well contamination, information on pathogen concentrations in the well water and health outcome data specific to each member of the population of interest would be needed. Instead, the causal inference model predicts AGI risks on the basis of a previous state-wide study associating county-level emerging department visits with microbiolo gical water quality in the county’s community water systems and private wells. Measurement of pathogens and collection of household-level health data was beyond the scope of the present study. Nonetheless, previous research comparing methods for quantifying health risks associated with microbial contaminants in drinking water on the basis of microbial indicator organism concentrations found that the causal inference model had the highest internal validity among the available approaches.16
4.5 Research Implications
18 5. Conclusion
19
Appendix 1: Recruitment Mailer Script
Date
Addressee Information Here:
Name
Address
Address
I am writing to ask your help in a study of drinking water quality in North Carolina. All participants will receive a $25 Visa gift card upon completion of the study.
The study objective is to compare tap water quality in homes served by private wells with that in homes served by public water utilities. In order to accomplish this objective, we will collect and analyze three tap water samples in 130 randomly selected homes in Wake County that obtain water from private wells. The results will inform future water resources planning and public health protection programs.
It is my understanding that you own residential propertie(s) in Wake County and do not currently have a public water supply for those houses. Students from the University of North Carolina Gillings School of Global Public Health will be contacting you by phone in a few days to offer you a brief survey regarding your water supply and to ask for your participation in the water sampling study. In addition to receiving the $25 Visa gift card, your water will be tested free of charge. You will receive the water quality analysis results, but nobody else outside of the research team will have access to your information.
We will be contacting you by phone in a few days to offer you a brief survey regarding your water supply and to ask for your participation in the water sampling. If you have any questions on how to participate or comments about this study, please contact us at 704.608.4240. This study is completely voluntary. However, this research can be beneficial for the public health of your community.
Sincerely,
20
Appendix 2: Telephone Recruitment/ Survey Script
Hello Sir or Ma’am,
The University of North Carolina is conducting a study on the water quality of non-municipal water sources in Wake
County. Your household has been randomly selected to participate in this study. Participation requires collecting tap water
from your home on 3 separate occasions over the course of 3 months. UNC students helping with water research will
collect the samples. The water will then be tested for any possible bacterial contamination. If you choose to participate,
you will be compensated with a $25 gift card at the end of the study. Results of the study will be kept private, and your
personal information will not be associated with the results in the published study. We will provide testing results to the
home owner at the end of the study.
1) Are you on a public municipal water system?
-If Yes, “I’m sorry, but you are not qualified for this study, we appreciate your time.”
2) If No, are you willing to participate in this study?
3) Do you have a septic tank? Y/N If yes, what is the approximate age of the septic system?
4) What is the approximate age of your well?
5) When is it convenient for you (date and time) to have us collect your first water sample?
(Within two weeks of phone survey)
21
Appendix 3: Sampling Protocol and Chain of Custody
Sampling Protocol:
1. Wash hands prior to sampling.
2. Turn on kitchen faucet and flush for five minutes.
3. Remove lid of sample container with one hand. While holding lid with one hand, fill the container with other hand.
Note: Do not rinse prior to sampling. Be careful not to touch sides or inside lid of bottle to anything to prevent the sample from being contaminated.
4. Fill sample container with more than 125 mL of sample. Do not overfill container. 5. Immediately replace lid tightly.
6. Take 2-3 samples per household.
7. If there is any question as to whether or not a sample has become contaminated, discard and collect new sample using a new container.
8. Immediately label container with the following identification information: a. Date (XX/XX/XXXX)
b. Time (XX:XX)
c. Sample ID Number (Random numbers provided by PI) d. Initials of sampler
9. Fill out Field Data Record with the following information: a. Date (XX/XX/XXXX)
b. Time (XX:XX) c. Sample ID Number d. Initials of sampler
22
11.Fill out Chain of Custody.
12.Immediately place containers in 4*C cooler in lab upon returning from sampling on the same date sampling occurs.
13.Transferee will sign Chain of Custody prior to sampling. 14.Test samples within one week of sample date.
Chain of Custody Procedure:
1. The sample collector must fill out the chain of custody log with the following information: a. Date
b. Time
c. Sample ID Number d. Address
e. Number of Containers and analyses required f. Signature
2. Second individual present at the collection site must also sign.
3. When turning over the sample collection, the transferor must sign, date and note the time of transfer. 4. The transferee must sign, date, and note the time upon acquisition of sample.
5. If multiple samples are received, the transferee and transferor must both initial next to each sample in addition to their signature to acknowledge the transfer of each individual sample.
23
Appendix 4: Sampling Data
*(95th percentiles)
1st Sample Total Coli. MPN Ecoli MPN Entero MPN Sample Date Septic tank
Age
Well Age (yrs)
1 9.7(4.5-17.2) 0 12.1(6.5-21.1) 07/26/14 34 34
2 0 0 0 07/26/14 10 NA
3 0 0 0 07/26/14 16 16
4 1.0(0.0-3.7) 0 0 07/26/14 2 30
5 0 0 0 07/26/14 NA NA
6 44.1(30.6-62.5) 1.0(0.1-5.5) 0 07/26/14 66 66
7 0 0 0 08/06/14 43 43
8 0 0 0 08/21/14 2 38
9 0 0 0 08/21/14 NA NA
10 1.0(0.1-5.5) 0 0 08/07/14 23 23
11 0 0 0 08/22/14 30 30
12 0 0 0 08/06/14 54 54
13 0 0 0 08/06/14 NA NA
14 0 0 0 08/22/14 14 14
15 0 0 0 08/07/14 33 33
16 0 0 0 08/07/14 20 20
17 0 0 0 08/21/14 16 30
18 0 0 0 08/06/14 43 43
19 0 0 0 08/22/14 20 20
20 3.0(0.7-7.4) 0 0 08/21/14 20 20
21 0 0 0 08/21/14 32 32
22 0 0 0 08/07/14 24 36
23 0 0 0 08/07/14 6 38
24 0 0 0 08/07/14 14 15
25 1.0(0.1-5.5) 0 0 08/07/14 1 49
26 0 0 0 08/21/14 15 15
27 0 0 0 08/06/14 16 NA
28 0 0 1.0(0.1-5.5) 08/22/14 54 54
29 0 0 0 09/18/14 55 55
30 35.5(23.9-51.0) 0 0 10/18/14 54 54
31 0 0 0 08/21/14 NA NA
32 0 0 0 08/07/14 28 28
33 0 0 0 08/21/14 5 50
34 0 0 0 09/18/14 24 24
35 0 0 0 10/03/14 NA NA
36 8.6(4.5-16.9) 0 0 08/22/14 10 NA
24
38 0 0 0 11/06/14 NA NA
39 0 0 0 08/22/14 NA NA
40 0 0 0 08/22/14 NA NA
41 0 0 0 08/22/14 31 31
42 0 0 0 09/18/14 33 33
43 65.7(45.5-90.3) 0 0 10/03/14 53 53
44 387.3(245.9-567) 0 0 10/03/14 20 20
45 0 0 0 10/03/14 8 8
46 0 0 0 10/03/14 50 50
47 1.0(0.0-3.7) 0 0 10/25/14 NA NA
48 0 0 2.0(0.3-5.6) 10/25/14 5 5
49 35.5(23.9-51.0) 0 0 10/25/14 52 52
50 0 0 0 07/26/14 13 13
51 0 0 0 07/26/14 13 13
52 4.1(1.7-9.5) 0 0 07/26/14 30 50
53 0 0 0 07/26/14 15 15
54 0 0 0 07/26/14 7 7
55
185.0(131.9-256.3) 0 0 07/26/14 29 29
56 0 0 0 07/26/14 50 50
57 0 0 0 07/26/14 14 14
2nd Sample Total Coli. MPN Ecoli MPN Entero MPN Sample
Date
1 4.1(1.2-9.1) 0 1.0(0.0-3.7) 09/19/14
2 0 0 0 10/10/14
3 0 0 0 09/19/14
4 6.3(2.9-13.7) 0 0 10/25/14
5 2.0(0.3-7.1) 0 0 10/10/14
6 4.1(1.2-9.1) 2.0(0.3-7.1) 0 10/10/14
7 1.0(0.1-5.5) 0 0 09/18/14
8 0 0 0 10/03/14
9 0 0 0 10/03/14
10 1.0(0.1-5.5) 0 1.0(0.0-3.7) 09/19/14
11 7.5(3.6-14.9) 0 1.0(0.0-3.7) 09/27/14
12 0 0 0 09/18/14
13 0 0 1.0(0.0-3.7) 10/18/14
14 0 0 1.0(0.0-3.7) 09/27/14
15 0 0 0 09/19/14
16 0 0 0 09/19/14
17 0 0 0 10/03/14
18 0 0 1.0(0.0-3.7) 09/18/14
19 0 0 1.0(0.0-3.7) 09/27/14
25
21 0 0 0 10/03/14
22 0 0 0 09/19/14
23 0 0 0 09/19/14
24 1.0(0.1-5.5) 0 0 09/19/14
25 0 0 0 12/06/14
26 0 0 0 10/03/14
27 0 0 0 10/18/14
28 1.0(0.1-5.5) 0 0 09/19/14
29 0 0 0 11/06/14
30 1.0(0.1-5.5) 0 0 12/06/14
31 0 0 1.0(0-3.7) 09/18/14
32 0 0 0 09/19/14
33 15.5(8.6-25.1) 0 0 09/18/14
34 0 0 0 10/18/14
35 0 0 0 11/26/14
36
2420(1439.5-TNTC)
150.0(104.0-211.8) 6.3(2.9-13.7) 10/18/14
37 0 0 0 09/19/14
38 0 0 0 09/19/14
39 0 0 1.0(0-3.7) 09/19/14
40 0 0 1.0(0-3.7) 09/27/14
41 0 0 0 09/19/14
42 0 0 0 11/06/14
43 6.3 (2.9-13.7) 0 0 12/06/14
44
686.7
(449.3-974.4) 3.0(0.6-7.3)
71.7(51.1-97.5) 12/06/14
45 0 0 0 11/26/14
46 0 0 0 11/26/14
47 0 0 0 12/06/14
48 0 0 0 12/06/14
49 0 0 0 12/06/14
50 0 0 0 09/27/14
51 0 0 0 10/25/14
52 6.3(2.5-12.7) 0 0 10/25/14
53 0 0 1.0(0-3.7) 09/27/14
54 17.5(10.1-28.6) 0 0 09/27/14
55 8.5(3.9-15.6) 0 0 10/25/14
56 0 0 0 09/27/14
57 0 0 0 09/27/14
3rd Sample Total Coli. MPN Ecoli MPN Entero MPN Sample
Date
1 7.5(3.6-14.9) 0 0 12/06/14
26
3 0 0 0 12/06/14
4 0 0 0 12/05/14
5 0 0 0 12/17/14
6 0 0 0 12/17/14
7 0 0 0 11/06/14
8 12.2(6.8-21.4) 0 0 11/26/14
9 0 0 2.0(0.3-7.1) 11/26/14
10 0 0 0 12/06/14
11 42.8(29.7-60.1) 4.1(1.2-9.1) 0 12/17/14
12 0 0 0 12/05/14
13 0 0 0 12/05/14
14 0 0 0 12/05/14
15 2.0(0.3-7.1) 0 0 12/06/14
16 0 0 0 12/06/14
17 0 0 0 11/26/14
18 0 0 0 11/06/14
19 0 0 0 12/05/14
20 0 0 0 11/06/14
21 0 0 0 11/26/14
22 0 0 0 12/06/14
23 0 0 0 12/06/14
24 1.0(0.1-5.5) 0 0 12/06/14
25 0 0 0 12/17/14
26 0 0 0 11/26/14
27 9.7(4.5-17.2) 0 0 12/05/14
28 0 0 0 12/06/14
29 0 0 0 12/05/14
30 3.1 (0.7-8.9) 0 0 12/17/14
31 0 0 0 11/06/14
32 0 0 0 12/06/14
33 43.2(29.1-61.4) 0 0 11/06/14
34 0 0 0 12/05/14
35 0 0 0 12/05/14
36 2419.6 (1439.5+) 2.0(0.3-5.6) 1.0(0.0-3.7) 10/25/14
37 0 0 0 12/06/14
38 19.8(12.6-30.4) 4.0(1.1-8.9) 0 12/17/14
39 0 0 0 12/06/14
40 65.2(47.7-85.3) 6.1(2.3-12.1) 0 12/17/14
41 0 0 0 12/06/14
42 0 0 0 12/05/14
43 16.0(9.5-25.1) 1.0(0.0-3.7) 0 12/17/14
44
866.4(583.8-1245.4) 1.0(0.1-5.5) 3.1(0.7-8.9) 12/17/14
27
46 26.9(17.1-39.8) 14.2(7.6-23.4) 0 12/17/14
47 4.1(1.7-9.5) 0 0 12/17/14
48 0 0 0 12/17/14
49 0 0 0 12/17/14
50 0 0 0 12/05/14
51 0 0 0 12/05/14
52 7.5(3.6-14.9) 0 0 12/05/14
53 0 0 0 12/05/14
54 0 0 0 12/05/14
55 31.5(20.6-45.7) 0 0 12/17/14
56 0 0 0 12/05/14
28 References
1. Craun GF, Brunkard JM, Yoder JS, et al. Causes of outbreaks associated with drinking water in the United States from 1971 to 2006. Clin Microbiol Rev. 2010;23(3):507-528. doi:10.1128/CMR.00077-09. 2. Maupin, M.A., Kenny, J.F., Hutson, S.S., Lovelace, J.K., Barber, N.L., and Linsey KS. Estimated Use of
Water in the United States in 2010: U.S. Geological Survey Circular 1405.; 2014. http://dx.doi.org/10.3133/cir1405.
3. Perlman H. Water Science Glossary of Terms. 2015. https://water.usgs.gov/edu/dictionary. html. Accessed January 1st, 2015.
4. Bowers K. ETJ In North Carolina. 2012. http://www.nclm.org/SiteCollectionDocuments/Legislative/ETJ in North Carolina.pdf. Accessed March 24th, 2015.
5. Wilson SM, Heaney CD, Cooper J, Wilson O. Built environment issues in unserved and underserved African-American neighborhoods in North Carolina. Environ Justice. 2008;1(2):63-72.
http://online.liebertpub.com/doi/abs/10.1089/env.2008.0509.
6. MacDonald Gibson J, DeFelice N, Sebastian D, Leker H. Racial disparities in access to community water supply service in Wake County, North Carolina. Front Public Heal Serv Syst Res. 2014;3(3).
7. Marsh B, Parnell AM, Joyner AM. Institutionalization of Racial Inequality in Local Political Geographies. Urban Geogr. 2010;31:691-709. doi:10.2747/0272-3638.31.5.691.
8. Naman JM. Disparities in water and sewer services in North Carolina: An analysis of the decision-making process. Master's thesis completed in the Dept. of Envr. Sci. and Eng. at the University of North Carolina at Chapel Hill 2014.
9. Raleigh C of. City of Raleigh Public Utilities Department: Services tab. Accessed March 24th, 2015. http://www.raleighnc.gov/services/content/Departments/Articles/PublicUtilities.html. Accessed January 1st, 2015.
10. Cavalier J. North Carolina Department of Environment and Natural Resources Public Water Supply Section, March 12th, 2014 contact via email.
11. EPA. The Revised Total Coliform Rule (RTCR) State Implementation Guidance—Interim Final.; 2014. http://water.epa.gov/lawsregs/rulesregs/sdwa/tcr/upload/epa816r14004.pdf.
12. Bright G. Aseptic Sampling Procedure for collection of bacteria water samples. July 15th, 2014 contact via email.
13. APHA, WEF A. Standard Methods for the Examination of Water and Wastewater. 21st ed. (American Public Health Association, Water Environment Federation and AWWA, ed.). Washington D.C.; 2005. 14. Godfrey S, Watkins J, Toop K, Francis C. Analysis of enterococci using portable testing equipment for
29
15. EPA. Manual for the Certification of Laboratories Analyzing Drinking Water Criteria and Procedures Quality Assurance. 5th ed.; 2005(V1-V77).
16. Defelice, N.B., Johnson, J.E., Gibson JM. Burden of Acute Gastrointestinal Illness from Microbial Contaminants in North Carolina Community Water Systems. Dissertation completed in the Dept. of Envr. Sci. and Eng. at the University of North Carolina at Chapel Hill; 2015.
17. Lloyd BJ, Bartram JK. Surveillance Solutions To Microbiological Problems in Water-Quality Control in Developing-Countries. Water Sci Technol. 1991;24(2):61-75. <Go to ISI>://WOS:A1991FF25600014. 18. Embrey, S. S. & Runkle DL. Microbial Quality of the Nation ’ S Ground-Water Resources , 1993 –
2004.; 2006. http://pubs.usgs.gov/sir/2006/5290/pdf/sir20065290.pdf.
19. Kelsey J. Pieper, Leigh-Anne H. Krometis, Daniel L. Gallagher BLB and ME. Incidence of waterborne lead in private drinking water systems in Virginia. J Water Health. 2015:1-21.
doi:10.2166/hydro.2013.124.
20. Goss MJ, Barry D a J, Rudolph DL. Contamination in Ontario farmstead domestic wells and its
association with agriculture: 1. Results from drinking water wells. J Contam Hydrol. 1998;32:267-293. doi:10.1016/S0169-7722(98)00054-0.
21. Borchardt M a., Chyou PH, DeVries EO, Belongia E a. Septic system density and infectious diarrhea in a defined population of children. Environ Health Perspect. 2003;111(5):742-748. doi:10.1289/ehp.5914. 22. Reay WG. Septic tank impacts on ground water quality and nearshore sediment nutrient flux. Ground
Water. 2004;42(7):1079-1089. doi:10.1111/j.1745-6584.2004.tb02645.x.
23. Resources NCD of E and N. SECTION.3800 - PRIVATE DRINKING WATER WELL SAMPLING.; 2008:1-2. file:///C:/Users/Frank/Downloads/SECTION-3800-PRIVATE-DRINKING-WATER-WELL.pdf.
24. Government WC. Groundwater Protection and Wells. 2015.
http://www.wakegov.com/water/wells/Pages/default.aspx. Accessed January 1st, 2015.
25. Government WC. City of Raleigh and Wake County iMAPS. 2015. http://maps.raleighnc.gov/imaps/. 26. Government WC. Wake County Comprehensive Groundwater Investigation Final Report.; 2003.
http://hdl.handle.net/2060/19970012342.
27. Aiken CS. Race as a Factor in Municipal Underbounding. Ann Assoc Am Geogr. 1987;77(March 2015):564-579. doi:10.1111/j.1467-8306.1987.tb00181.x.
28. Gilbert P. The State of Exclusion: An Empirical Analysis of the Legacy of Segregated Communities in North Carolina.; 2013.
30